
tricontour
Makie.tricontour Function
tricontour(triangulation, zs; kwargs...)
tricontour(xs, ys, zs; kwargs...)
Plots isolines of the scalar field zs at the horizontal positions xs and vertical positions ys on an unstructured triangular grid. A Triangulation from DelaunayTriangulation.jl can also be provided instead of xs and ys, otherwise an unconstrained Delaunay triangulation of xs and ys is computed.
Plot type
The plot type alias for the tricontour function is Tricontour.
Examples
using CairoMakie
using Random
Random.seed!(1234)

x = randn(200)
y = randn(200)
z = sin.(2π .* x) .* cos.(2π .* y)

f, ax, tr = tricontour(x, y, z; levels = 10)
Colorbar(f[1, 2], tr)
f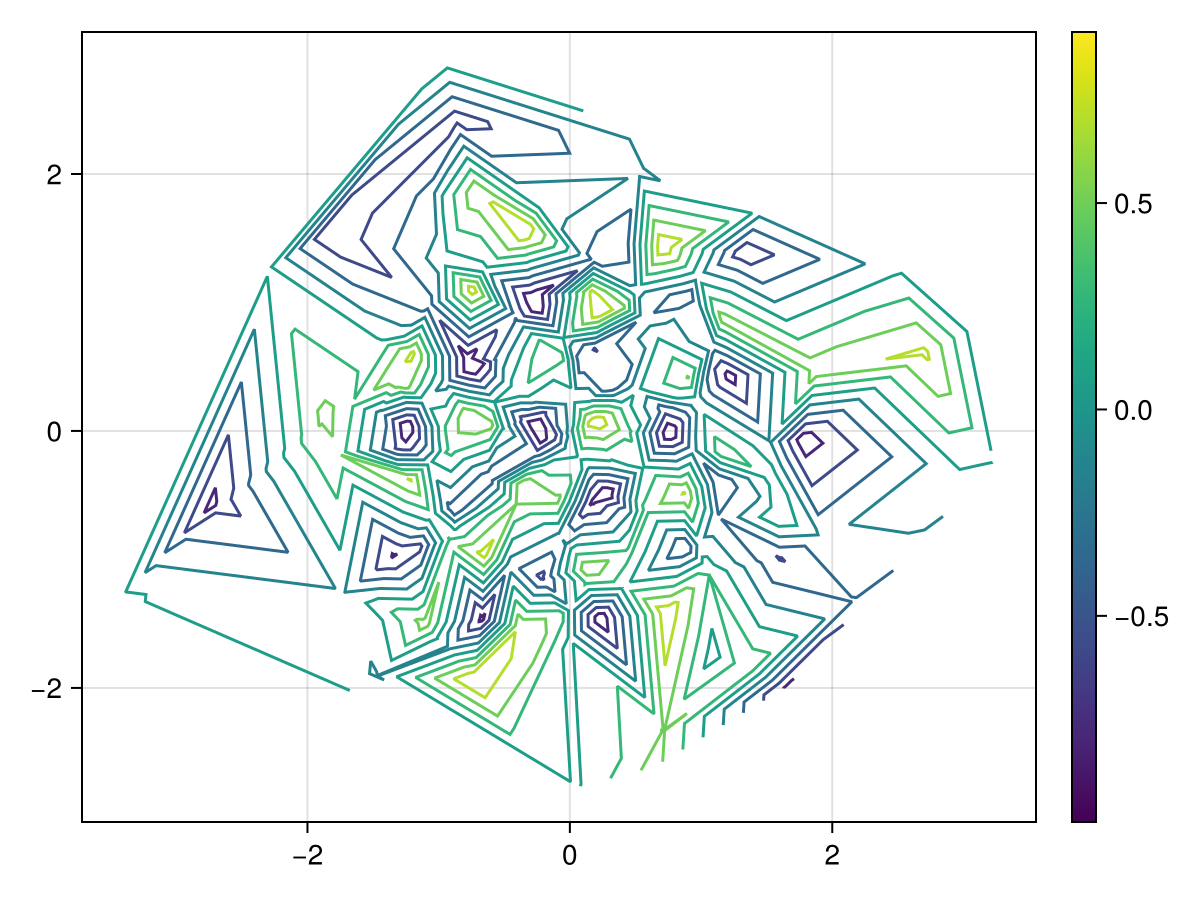
Setting color to a fixed value draws all isolines in that color instead of sampling from the colormap.
using CairoMakie
using Random
Random.seed!(1234)

x = randn(200)
y = randn(200)
z = sin.(2π .* x) .* cos.(2π .* y)

f, ax, tr = tricontour(x, y, z; levels = 10, color = :black, linewidth = 1.5)
f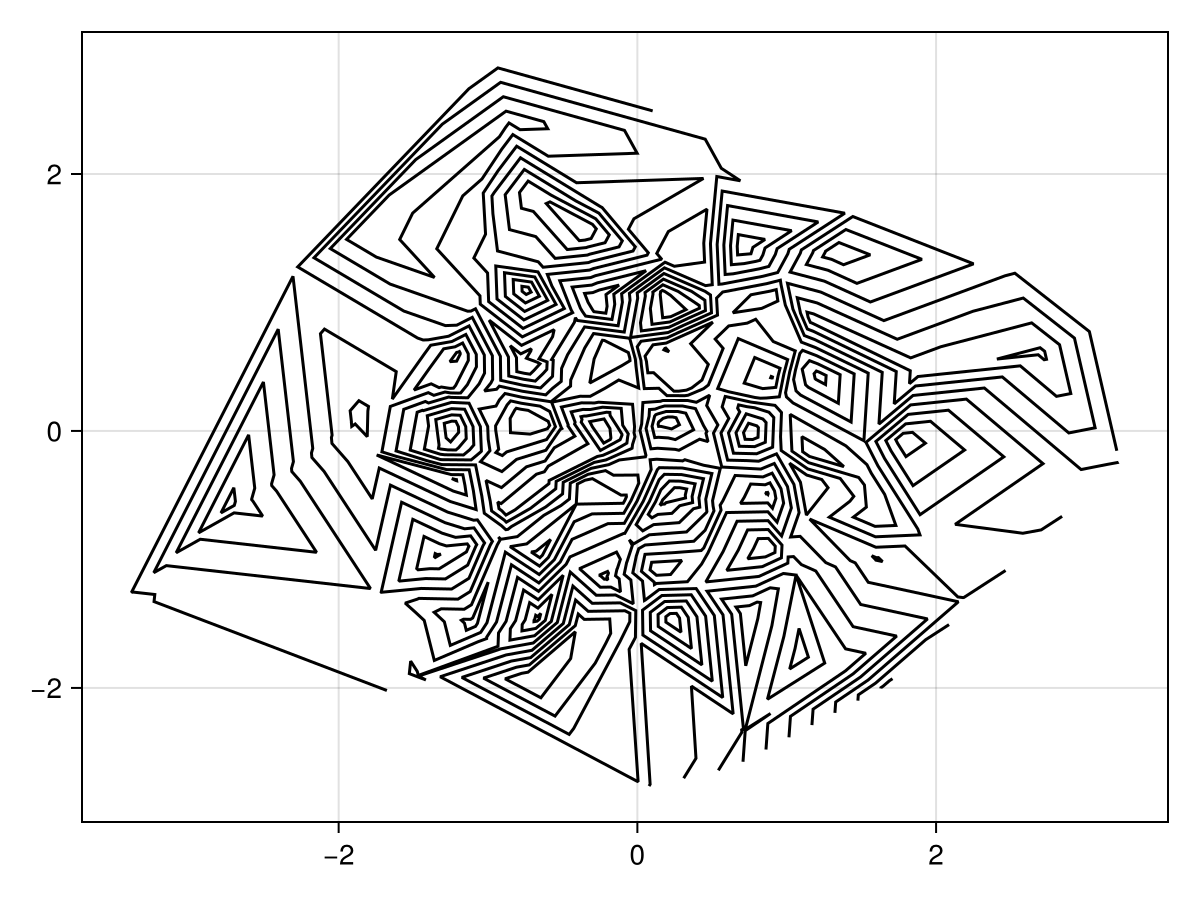
Explicit isoline values can be passed as a vector.
using CairoMakie
using Random
Random.seed!(1234)

x = randn(200)
y = randn(200)
z = -sqrt.(x .^ 2 .+ y .^ 2) .+ 0.1 .* randn.()

f, ax, tr = tricontour(x, y, z; levels = -1.5:0.3:0.0, colormap = :plasma)
Colorbar(f[1, 2], tr)
f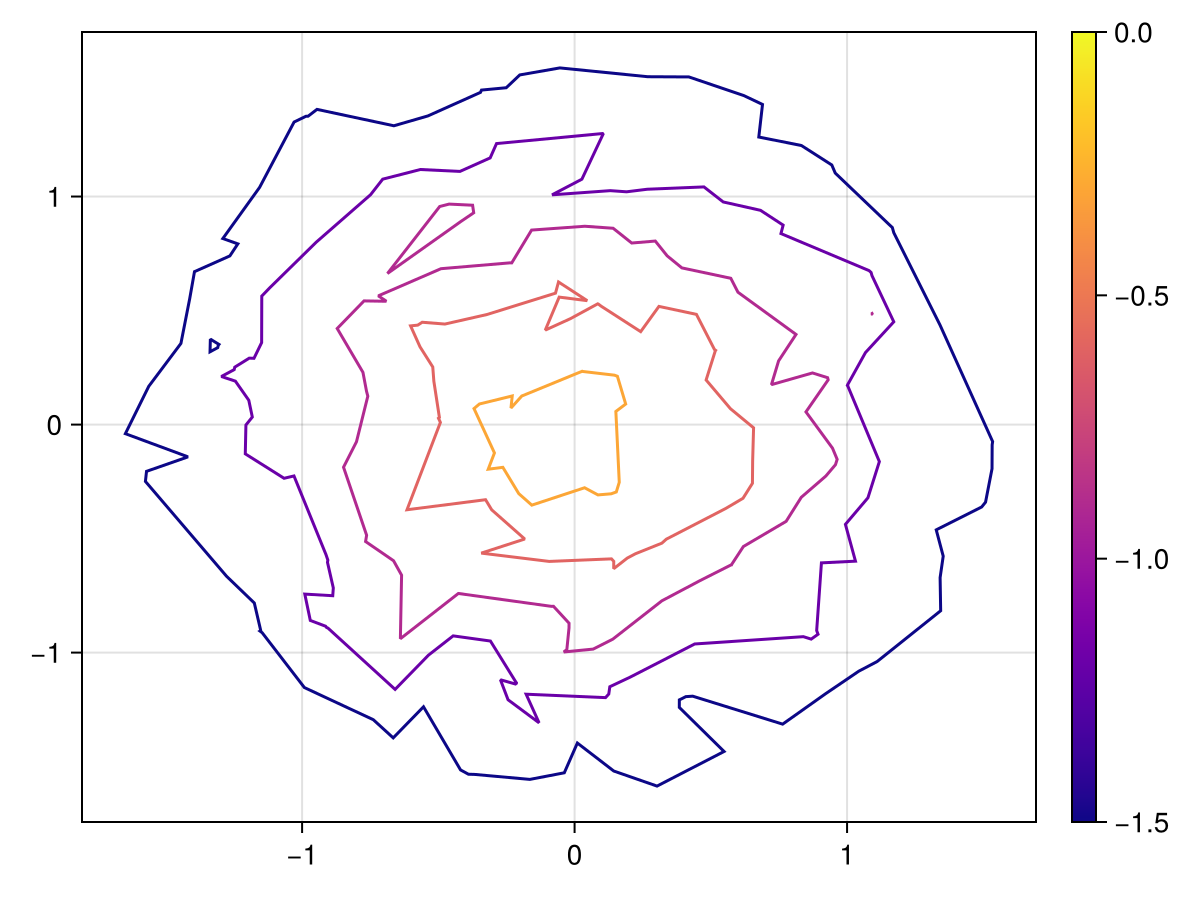
Triangulation modes
A pre-built Triangulation from DelaunayTriangulation.jl can be passed as the first argument instead of xs and ys. Manual triangulations can also be passed as a 3×N integer matrix where each column specifies the vertex indices of one triangle.
using CairoMakie
using DelaunayTriangulation
using Random
Random.seed!(123)

n = 20
angles = range(0, 2pi, length = n+1)[1:end-1]
x = [cos.(angles); 2 .* cos.(angles .+ pi/n)]
y = [sin.(angles); 2 .* sin.(angles .+ pi/n)]
z = (x .- 0.5).^2 + (y .- 0.5).^2 .+ 0.5.*randn.()

inner = [n:-1:1; n]
outer = [(n+1):(2n); n+1]
boundary_nodes = [[outer], [inner]]
points = [x'; y']
tri = triangulate(points; boundary_nodes = boundary_nodes)

f, ax, tr = tricontour(tri, z; levels = 8, axis = (; aspect = 1))
Colorbar(f[1, 2], tr)
f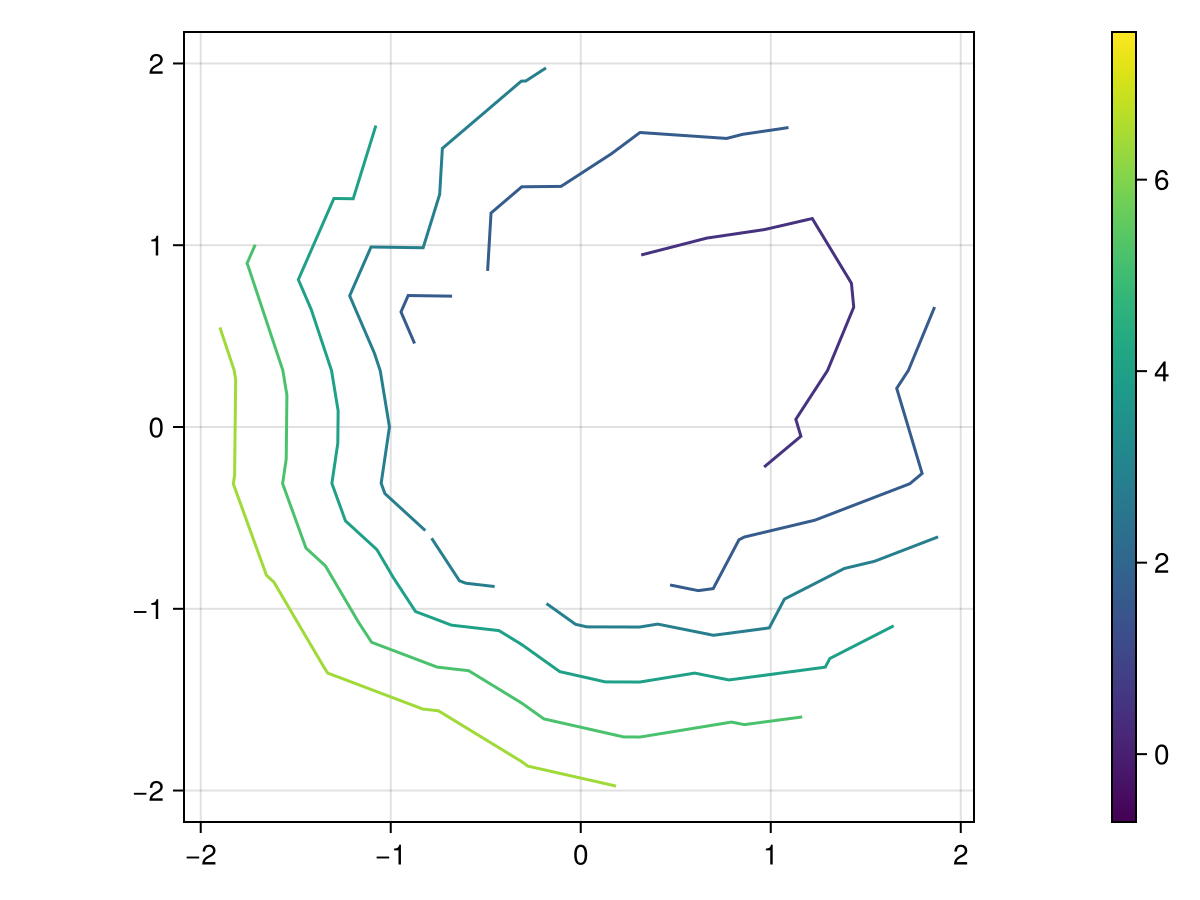
Attributes
alpha
Defaults to 1.0
The alpha value of the colormap or color attribute. Multiple alphas like in plot(alpha=0.2, color=(:red, 0.5)), will get multiplied.
clip_planes
Defaults to @inherit clip_planes automatic
Clip planes offer a way to do clipping in 3D space. You can set a Vector of up to 8 Plane3f planes here, behind which plots will be clipped (i.e. become invisible). By default clip planes are inherited from the parent plot or scene. You can remove parent clip_planes by passing Plane3f[].
color
Defaults to nothing
The color of the contour lines. If nothing, colors are sampled from colormap according to each isoline's level value. Otherwise all lines use this single color.
colormap
Defaults to @inherit colormap
Sets the colormap from which isoline colors are sampled when color is nothing.
colorrange
Defaults to automatic
The values representing the start and end points of colormap.
colorscale
Defaults to identity
The color transform function. Can be any function, but only works well together with Colorbar for identity, log, log2, log10, sqrt, logit, Makie.pseudolog10, Makie.Symlog10, Makie.AsinhScale, Makie.SinhScale, Makie.LogScale, Makie.LuptonAsinhScale, and Makie.PowerScale.
depth_shift
Defaults to 0.0
Adjusts the depth value of a plot after all other transformations, i.e. in clip space, where -1 <= depth <= 1. This only applies to GLMakie and WGLMakie and can be used to adjust render order (like a tunable overdraw).
fxaa
Defaults to false
Adjusts whether the plot is rendered with fxaa (fast approximate anti-aliasing, GLMakie only). Note that some plots implement a better native anti-aliasing solution (scatter, text, lines). For them fxaa = true generally lowers quality. Plots that show smoothly interpolated data (e.g. image, surface) may also degrade in quality as fxaa = true can cause blurring.
highclip
Defaults to automatic
The color for any value above the colorrange.
inspectable
Defaults to @inherit inspectable
Sets whether this plot should be seen by DataInspector. The default depends on the theme of the parent scene.
inspector_clear
Defaults to automatic
Sets a callback function (inspector, plot) -> ... for cleaning up custom indicators in DataInspector.
inspector_hover
Defaults to automatic
Sets a callback function (inspector, plot, index) -> ... which replaces the default show_data methods.
inspector_label
Defaults to automatic
Sets a callback function (plot, index, position) -> string which replaces the default label generated by DataInspector.
joinstyle
Defaults to @inherit joinstyle
Controls the rendering at corners. Options are :miter for sharp corners, :bevel for "cut off" corners, and :round for rounded corners. If the corner angle is below miter_limit, :miter is equivalent to :bevel to avoid long spikes.
levels
Defaults to 10
Can be either an Int which results in n equally-spaced isolines between the minimum and maximum of zs, or an AbstractVector{<:Real} that lists explicit isoline values from low to high.
linestyle
Defaults to nothing
Sets the dash pattern of the line. Options are :solid (equivalent to nothing), :dot, :dash, :dashdot and :dashdotdot. These can also be given in a tuple with a gap style modifier, either :normal, :dense or :loose. For example, (:dot, :loose) or (:dashdot, :dense).
For custom patterns have a look at Makie.Linestyle.
linewidth
Defaults to @inherit linewidth
Sets the width of the line in screen units
lowclip
Defaults to automatic
The color for any value below the colorrange.
miter_limit
Defaults to @inherit miter_limit
Sets the minimum inner join angle below which miter joins truncate. See also Makie.miter_distance_to_angle.
model
Defaults to automatic
Sets a model matrix for the plot. This overrides adjustments made with translate!, rotate! and scale!.
nan_color
Defaults to :transparent
The color for NaN values.
overdraw
Defaults to false
Controls if the plot will draw over other plots. This specifically means ignoring depth checks in GL backends
rasterize
Defaults to @inherit rasterize false
Controls whether CairoMakie rasterizes a plot (true, >0) or not (false, 0). If an integer is given, it sets the pixel density for rasterization.
space
Defaults to :data
Sets the transformation space for box encompassing the plot. See Makie.spaces() for possible inputs.
ssao
Defaults to false
Adjusts whether the plot is rendered with ssao (screen space ambient occlusion). Note that this only makes sense in 3D plots and is only applicable with fxaa = true.
transformation
Defaults to :automatic
Controls the inheritance or directly sets the transformations of a plot. Transformations include the transform function and model matrix as generated by translate!(...), scale!(...) and rotate!(...). They can be set directly by passing a Transformation() object or inherited from the parent plot or scene. Inheritance options include:
:automatic: Inherit transformations if the parent and childspaceis compatible:inherit: Inherit transformations:inherit_model: Inherit only model transformations:inherit_transform_func: Inherit only the transform function:nothing: Inherit neither, fully disconnecting the child's transformations from the parent
Another option is to pass arguments to the transform!() function which then get applied to the plot. For example transformation = (:xz, 1.0) which rotates the xy plane to the xz plane and translates by 1.0. For this inheritance defaults to :automatic but can also be set through e.g. (:nothing, (:xz, 1.0)).
transparency
Defaults to false
Adjusts how the plot deals with transparency. In GLMakie transparency = true results in using Order Independent Transparency.
triangulation
Defaults to DelaunayTriangulation()
The mode with which the points in xs and ys are triangulated. Passing DelaunayTriangulation() performs a Delaunay triangulation. You can also pass a preexisting triangulation as an AbstractMatrix{<:Int} with size (3, n), where each column specifies the vertex indices of one triangle, or as a Triangulation from DelaunayTriangulation.jl.
visible
Defaults to true
Controls whether the plot gets rendered or not.