Legend
Creating A Legend From Elements
You can create a basic Legend by passing a vector of legend entries and a vector of labels, plus an optional title as the third argument.
The elements in the vector of legend entries can either be plot objects or LegendElements like LineElement, MarkerElement and PolyElement. Or they can be vectors of such objects that will be layered together as one.
Legend element attributes
The standard plot objects like Scatter or Lines have predefined conversions to MarkerElements and LineElements that copy the relevant plot attributes to the legend element. If an attribute has a vector-like value, it falls back to the scalar default of the legend. The legend defaults themselves are by default inherited from the main theme. For example, polystrokewidth of the legend falls back to patchstrokewidth of the main theme. In the following example, you can see that the legend for sca2 copies the :rect marker but not the vector-valued color.
using CairoMakie

f = Figure()

Axis(f[1, 1])

xs = 0:0.5:10
ys = sin.(xs)
lin = lines!(xs, ys, color = :blue)
sca = scatter!(xs, ys, color = :red)
sca2 = scatter!(xs, ys .+ 0.5, color = 1:length(xs), marker = :rect)

Legend(f[1, 2],
    [lin, sca, [lin, sca], sca2],
    ["a line", "some dots", "both together", "rect markers"])

f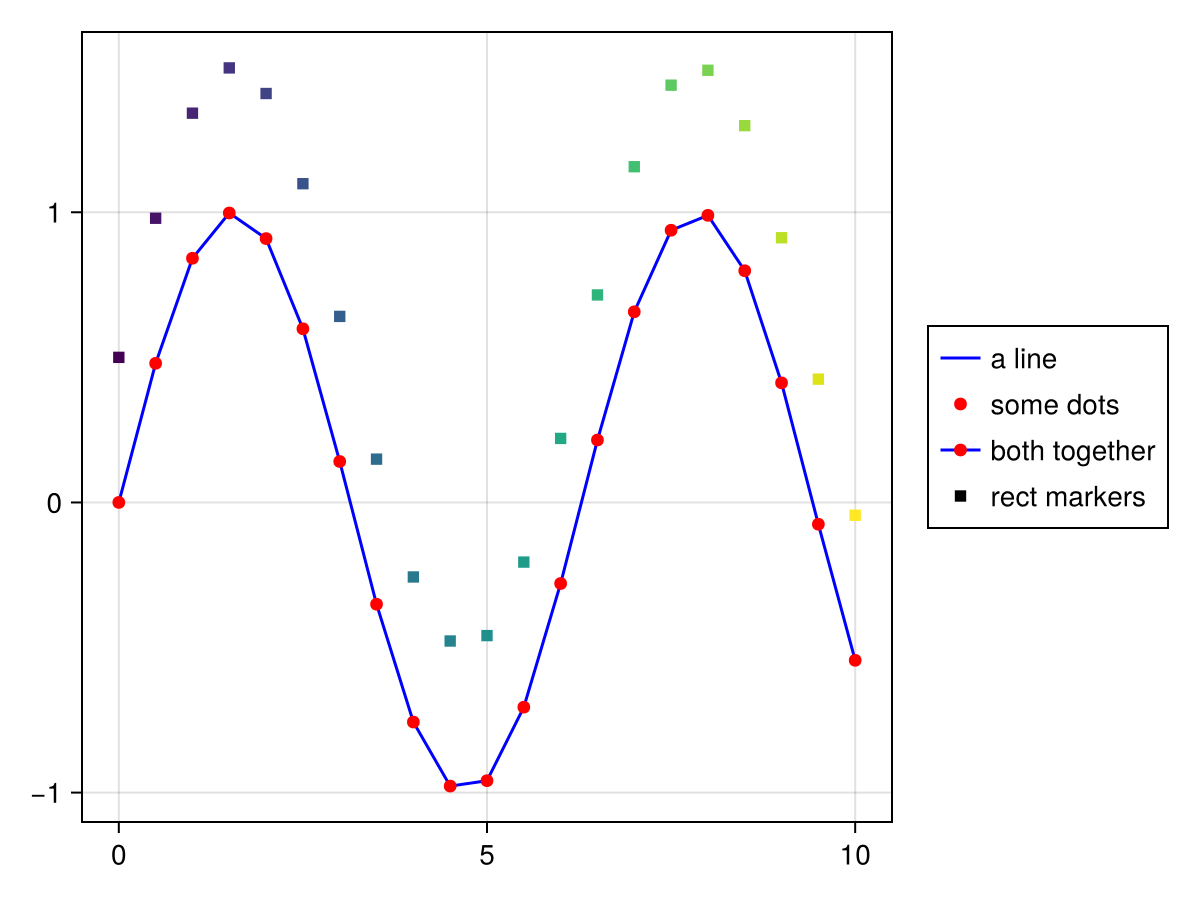
Creating A Legend From An Axis
You can also create a Legend by passing it an axis object, like Axis, LScene or Scene. All plots that have a label attribute set will be put into the legend, in the order that they appear in the axis, and you can optionally pass a title as the third argument.
using CairoMakie

f = Figure()

ax = f[1, 1] = Axis(f)

lines!(0..15, sin, label = "sin", color = :blue)
lines!(0..15, cos, label = "cos", color = :red)
lines!(0..15, x -> -cos(x), label = "-cos", color = :green)

f[1, 2] = Legend(f, ax, "Trig Functions", framevisible = false)

f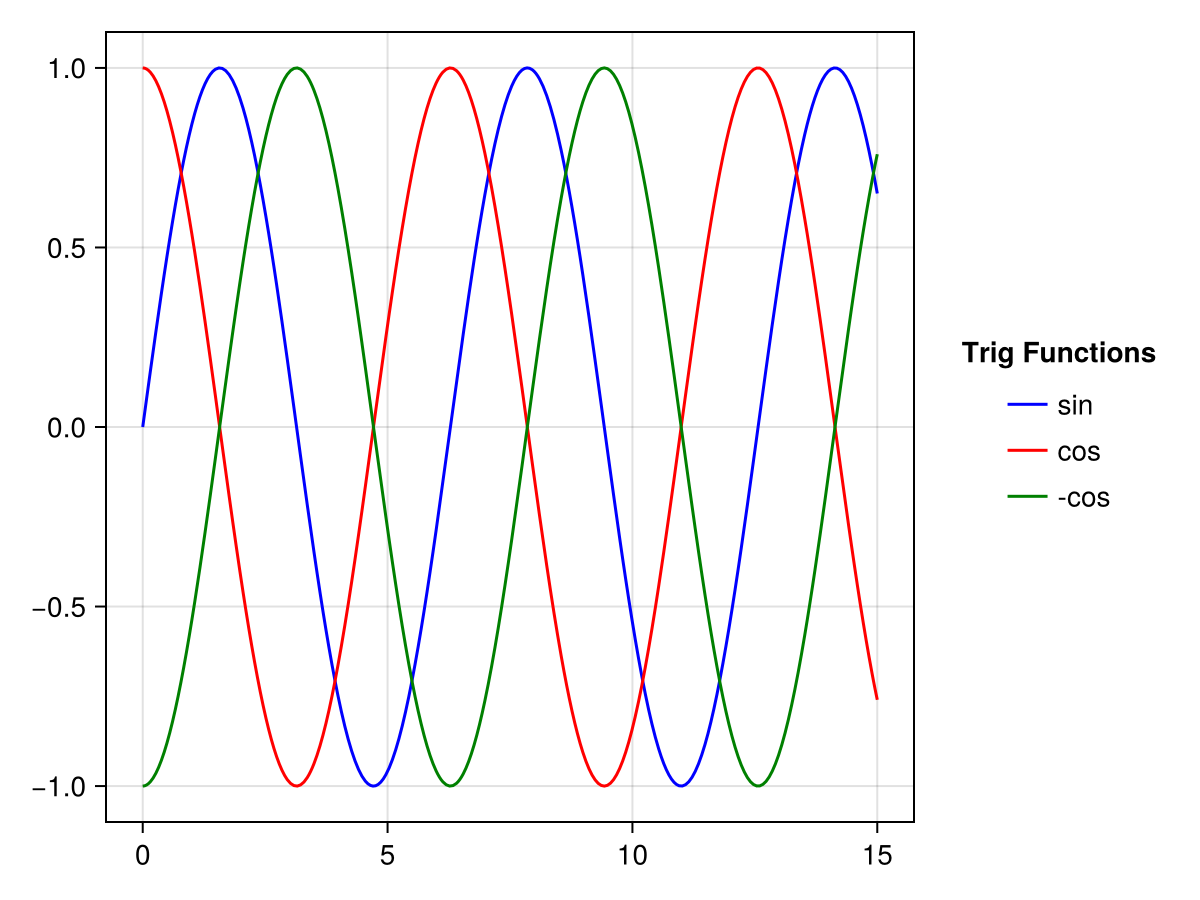
With the keywords merge and unique you can control how plot objects with the same labels are treated. If merge is true, all plot objects with the same label will be layered on top of each other into one legend entry. If unique is true, all plot objects with the same plot type and label will be reduced to one occurrence.
using CairoMakie

f = Figure()

traces = cumsum(randn(10, 5), dims = 1)

for (i, (merge, unique)) in enumerate(
        Iterators.product([false, true], [false true]))

    axis = Axis(f[fldmod1(i, 2)...],
        title = "merge = $merge, unique = $unique")

    for trace in eachcol(traces)
        lines!(trace, label = "single", color = (:black, 0.2))
    end

    mu = vec(sum(traces, dims = 2) ./ 5)
    lines!(mu, label = "mean")
    scatter!(mu, label = "mean")

    axislegend(axis, merge = merge, unique = unique)

end

f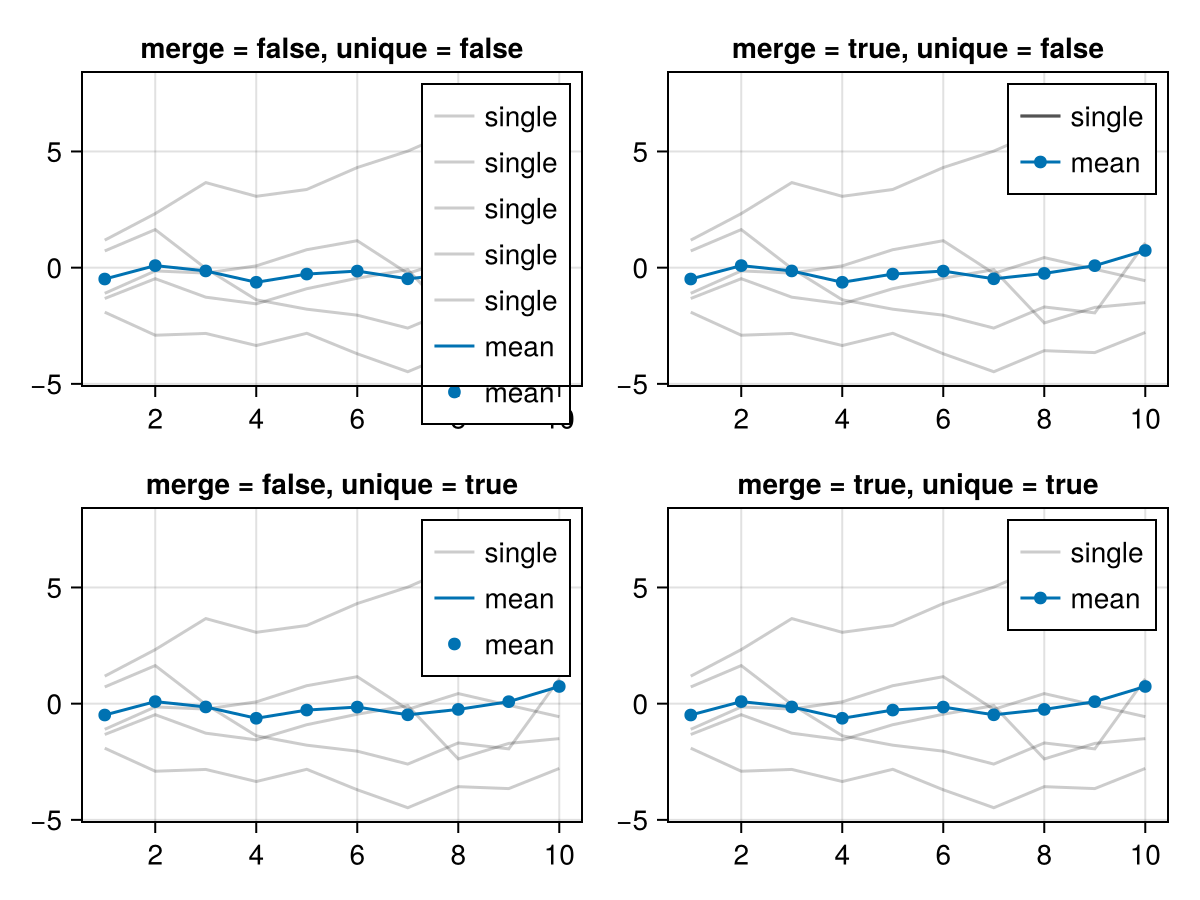
To create a joint legend for multiple axes it is also possible to pass a Vector of axis objects. Together with the merge keyword this can be useful for legend interactivity spanning multiple axes.
using CairoMakie

f = Figure()

ax1 = Axis(f[1, 1])
ax2 = Axis(f[1, 2])

xs = range(0, 4pi, length = 31)
lines!(ax1, xs, sin, label = "sin", color = :blue)
lines!(ax2, xs, cos, label = "cos", color = :red)
scatter!(ax1, xs, sin, label = "Points", color = :black)
scatter!(ax2, xs, cos, label = "Points", color = :black)

f[0, 1:2] = Legend(f, [ax1, ax2], "Automatic Joint Legend", merge = true, orientation = :horizontal, tellheight = true)

f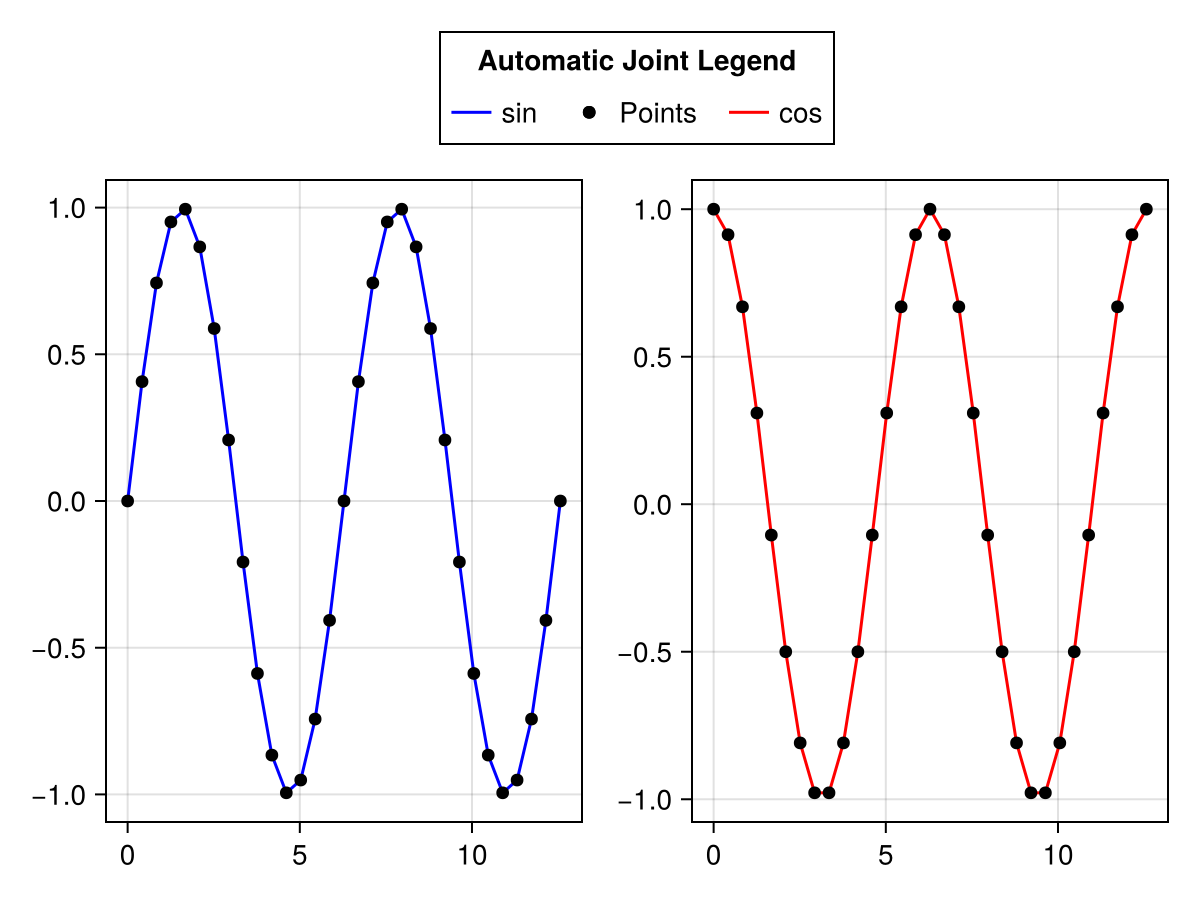
Legend Inside An Axis
The axislegend function is a quick way to add a legend to an Axis. You can pass a selected axis plus arguments which are forwarded to the Legend constructor, or the current axis is used by default. If you pass only a string, it's used as the title with the current axis.
The position can be set via a shortcut symbol, first halign (l, r, c) then valign (b, t, c), such as :lt for left, top and :cb for center bottom. Or you can set position with tuple (halign, valign) with elements from 0 to 1: position = (0.1, 0.9)
using CairoMakie

f = Figure()

ax = Axis(f[1, 1])

sc1 = scatter!(randn(10, 2), color = :red, label = "Red Dots")
sc2 = scatter!(randn(10, 2), color = :blue, label = "Blue Dots")
scatter!(randn(10, 2), color = :orange, label = "Orange Dots")
scatter!(randn(10, 2), color = :cyan, label = "Cyan Dots")

axislegend()

axislegend("Titled Legend", position = :lb)

axislegend(ax, [sc1, sc2], ["One", "Two"], "Selected Dots", position = :rb,
    orientation = :horizontal)

f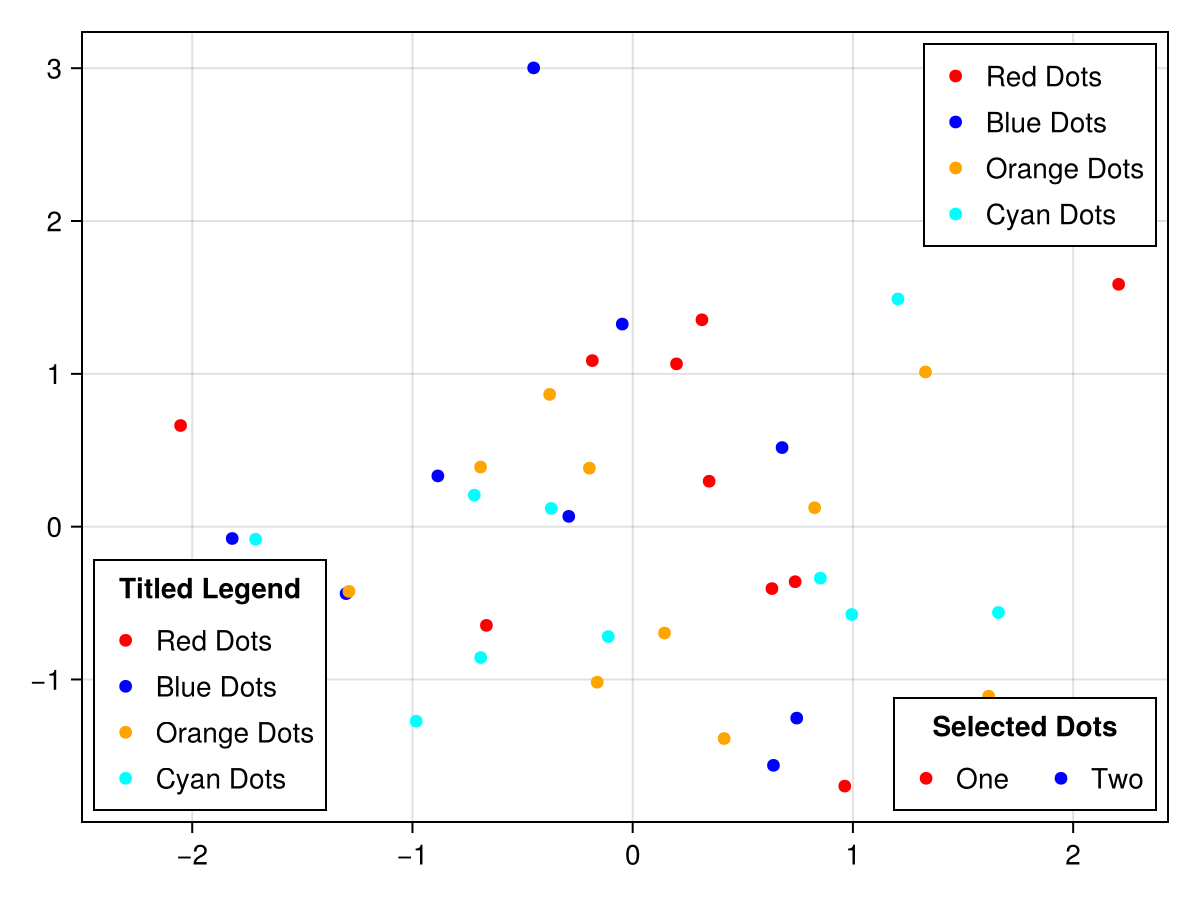
Alternatively, you can simply add a Legend to the same layout slot that an axis lives in. As long as the axis is bigger than the legend you can set the legend's tellheight and tellwidth to false and position it using the align variables. You can use the margin keyword to keep the legend from touching the axis spines.
using CairoMakie

haligns = [:left, :right, :center]
valigns = [:top, :bottom, :center]

f = Figure()

Axis(f[1, 1])

xs = 0:0.1:10
lins = [lines!(xs, sin.(xs .* i), color = color)
    for (i, color) in zip(1:3, [:red, :blue, :green])]

for (j, ha, va) in zip(1:3, haligns, valigns)
    Legend(
        f[1, 1], lins, ["Line $i" for i in 1:3],
        "$ha & $va",
        tellheight = false,
        tellwidth = false,
        margin = (10, 10, 10, 10),
        halign = ha, valign = va, orientation = :horizontal
    )
end

f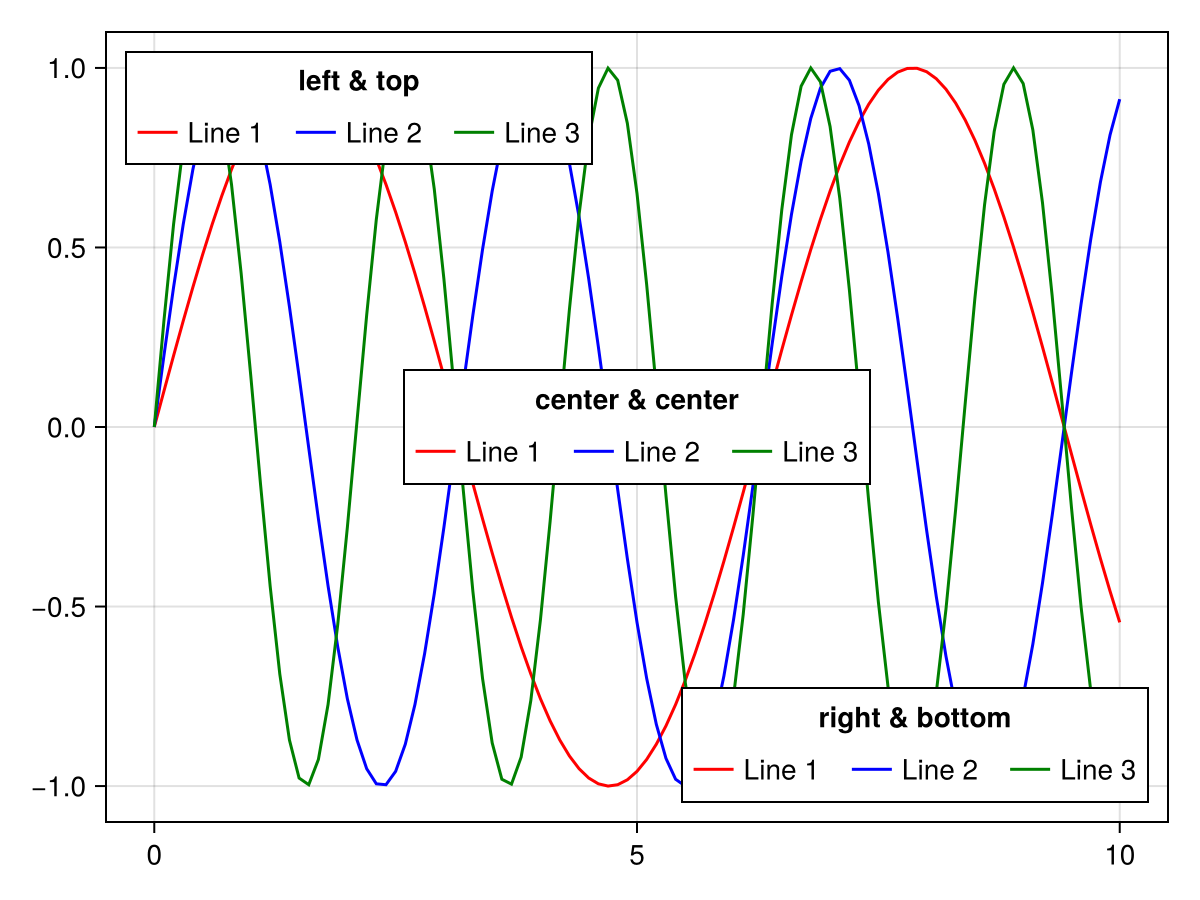
Creating Legend Entries Manually
Sometimes you might want to construct legend entries from scratch to have maximum control. So far you can use LineElements, MarkerElements or PolyElements. The attributes for these elements are the following (the [] parts can be left out when constructing these elements directly, but have to be fully written out for the attributes that the legend holds):
# LineElement
[line]points, [line]color, linestyle, linewidth

# MarkerElement
[marker]points, marker, markersize, [marker]color,
[marker]strokewidth, [marker]strokecolor

# PolyElement
[poly]points, [poly]color, [poly]strokewidth, [poly]strokecolor
The attributes linepoints, markerpoints and polypoints decide where in the legend entry patch rectangle the plot objects are placed. These values should be normalized to a 1 by 1 rectangle, and the final shape depends on the patchsize of the legend. For example, if you want wider line and poly markers, you could set the patchsize of the legend to (50, 30).
using CairoMakie

f = Figure()

Axis(f[1, 1])

elem_1 = [LineElement(color = :red, linestyle = nothing),
          MarkerElement(color = :blue, marker = 'x', markersize = 15,
          strokecolor = :black)]

elem_2 = [PolyElement(color = :red, strokecolor = :blue, strokewidth = 1),
          LineElement(color = :black, linestyle = :dash)]

elem_3 = LineElement(color = :green, linestyle = nothing,
        points = Point2f[(0, 0), (0, 1), (1, 0), (1, 1)])

elem_4 = MarkerElement(color = :blue, marker = 'π', markersize = 15,
        points = Point2f[(0.2, 0.2), (0.5, 0.8), (0.8, 0.2)])

elem_5 = PolyElement(color = :green, strokecolor = :black, strokewidth = 2,
        points = Point2f[(0, 0), (1, 0), (0, 1)])

Legend(f[1, 2],
    [elem_1, elem_2, elem_3, elem_4, elem_5],
    ["Line & Marker", "Poly & Line", "Line", "Marker", "Poly"],
    patchsize = (35, 35), rowgap = 10)

f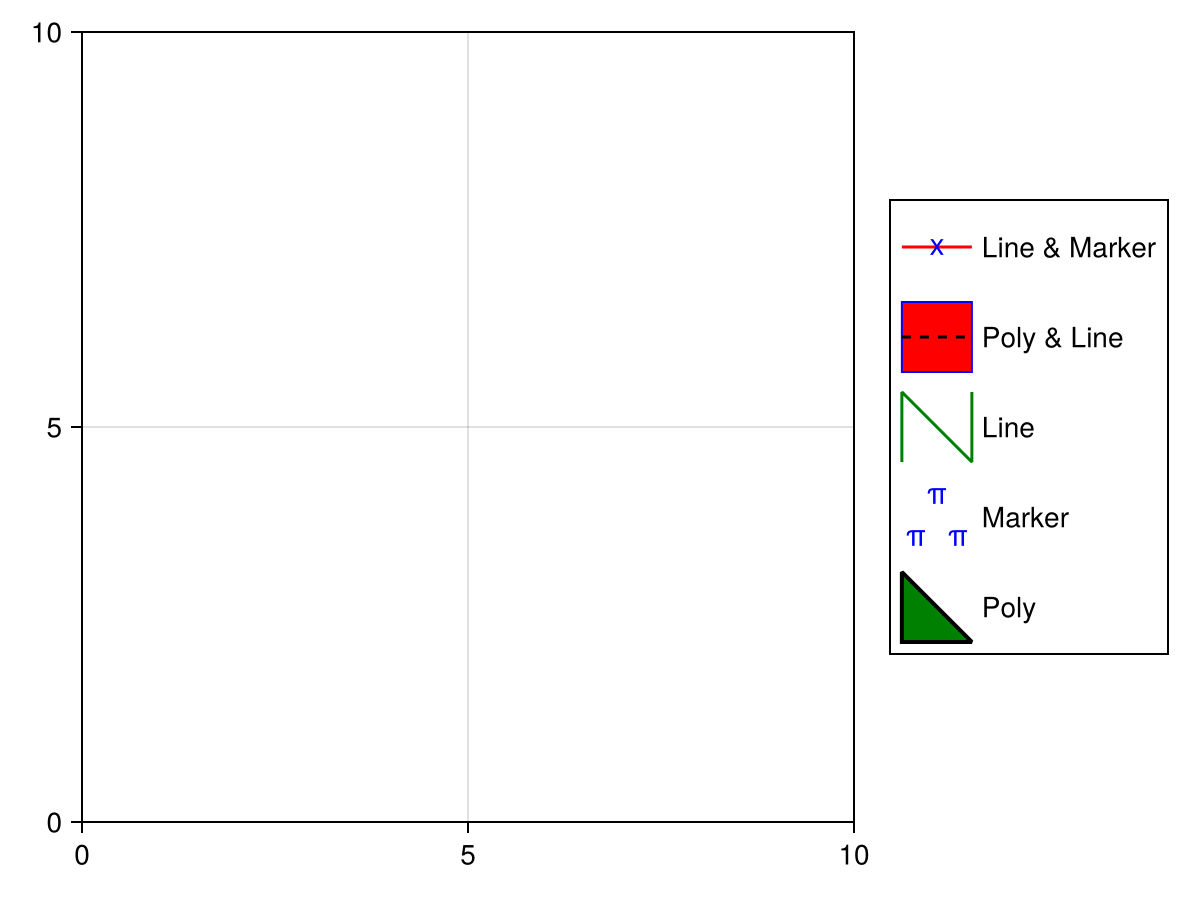
Overriding legend entry attributes
By default, legends inherit the visual attributes of the plots they belong to. Sometimes, it is necessary to override some of these attributes to make the legend more legible. You can pair a key-value object like a NamedTuple or a Dict{Symbol} to a plot's label to override its automatic legend entry, for example to increase the marker size of a Scatter:
using CairoMakie
f, ax, sc = scatter(
    cos.(range(0, 7pi, 100)),
    color = :black,
    markersize = 8,
    label = "cos" => (; markersize = 15)
)
scatter!(
    sin.(range(0, 7pi, 100)),
    color = :black,
    marker = :utriangle,
    markersize = 8,
    label = "sin" => (; markersize = 15)
)
Legend(f[1, 2], ax)
f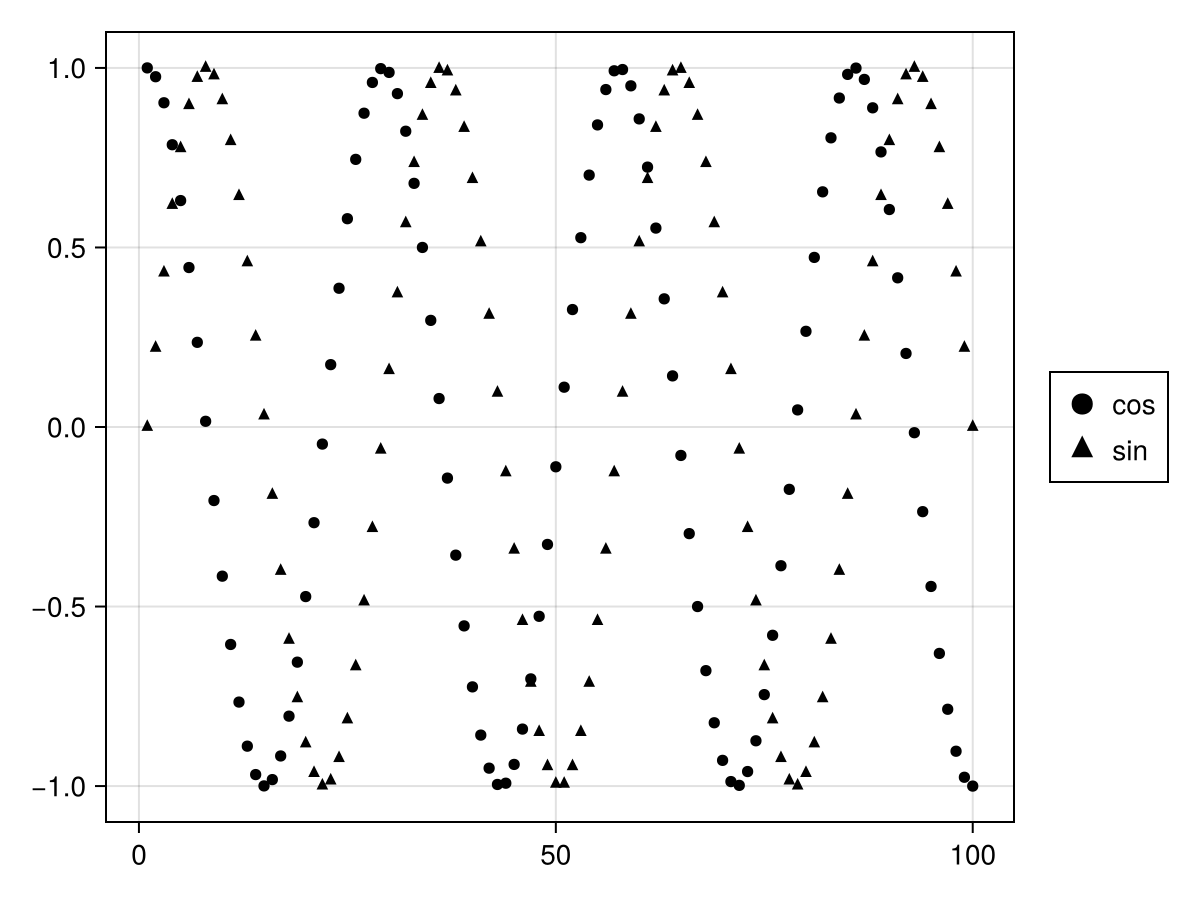
These are the attributes you can override (note that some of them have convenience aliases like color which applies to all elements while polycolor only applies to PolyElements):
MarkerElement[marker]points,markersize,[marker]strokewidth,[marker]color,[marker]strokecolor,[marker]colorrange,[marker]colormap
LineElement[line]points,linewidth,[line]color,linestyle,[line]colorrange,[line]colormap
PolyElement[poly]points,[poly]strokewidth,[poly]color,[poly]strokecolor,[poly]colorrange,[poly]colormap
MeshElementmesh,color,colormap,colorrange,uv_transform
ImageElementlimits,data,colormap,colorrange,interpolate
MeshScatterElementposition,color,marker,markersize,rotation,colormap,colorrange
Another common case is when you want to create a legend for a plot with a categorical colormap. By passing a vector of labels paired with overrides, you can create multiple entries with the correct colors:
using CairoMakie
f, ax, bp = barplot(
    1:5,
    [1, 3, 2, 5, 4],
    color = 1:5,
    colorrange = (1, 5),
    colormap = :Set1_5,
    label = [label => (; color = i)
        for (i, label) in enumerate(["red", "blue", "green", "purple", "orange"])]
)
Legend(f[1, 2], ax)
f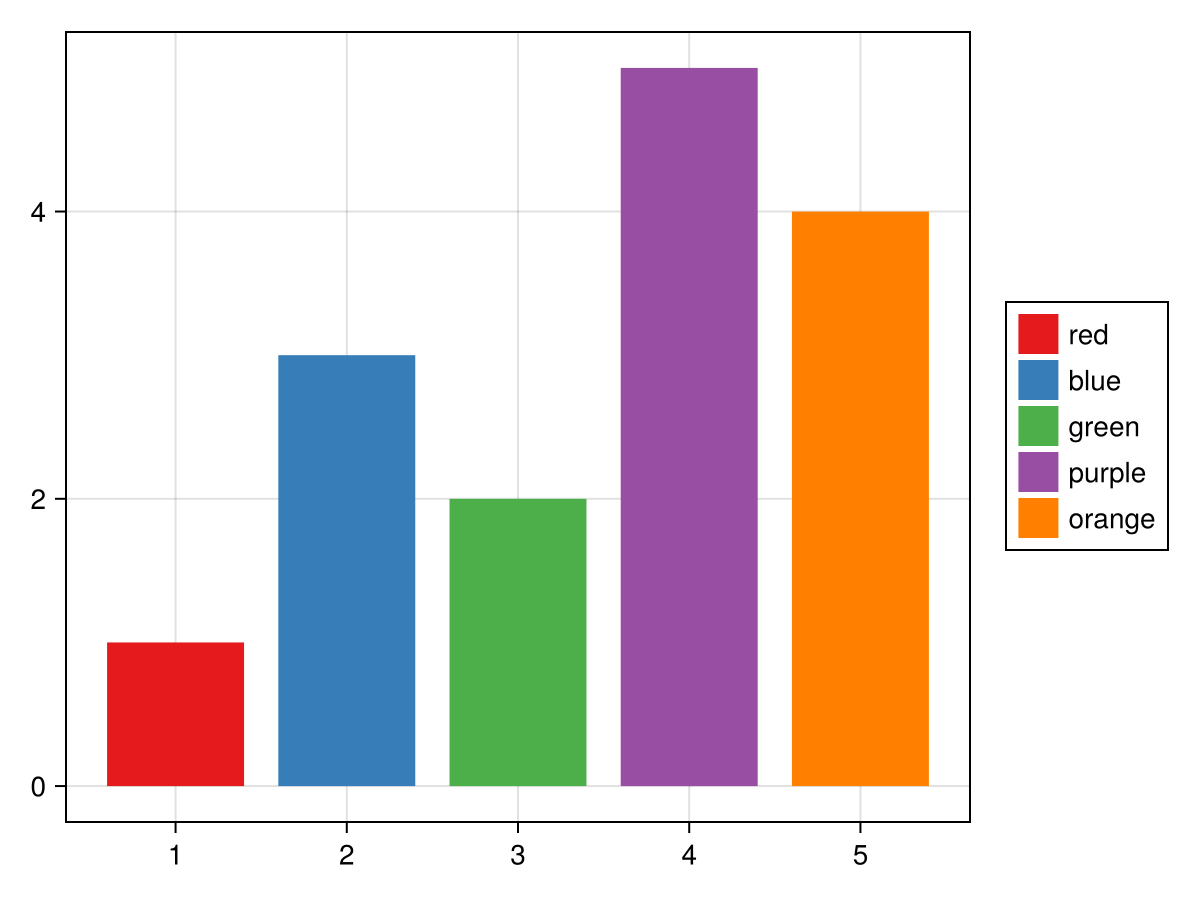
You may also override plots in the Legend constructor itself, in this case, you pair the overrides with the plots whose legend entries you want to override:
using CairoMakie
f = Figure()
ax = Axis(f[1, 1])
li = lines!(ax, 1:5, linestyle = :dot)
sc = scatter!(ax, 1:5, markersize = 10)
Legend(
    f[1, 2],
    [
        sc => (; markersize = 20),
        li => (; linewidth = 3),
        [li, sc] => (; color = :red),
        [li => (; linewidth = 3), sc => (; markersize = 20)],
    ],
    ["Scatter", "Line", "Both", "Both 2"],
    patchsize = (40, 20),
)
f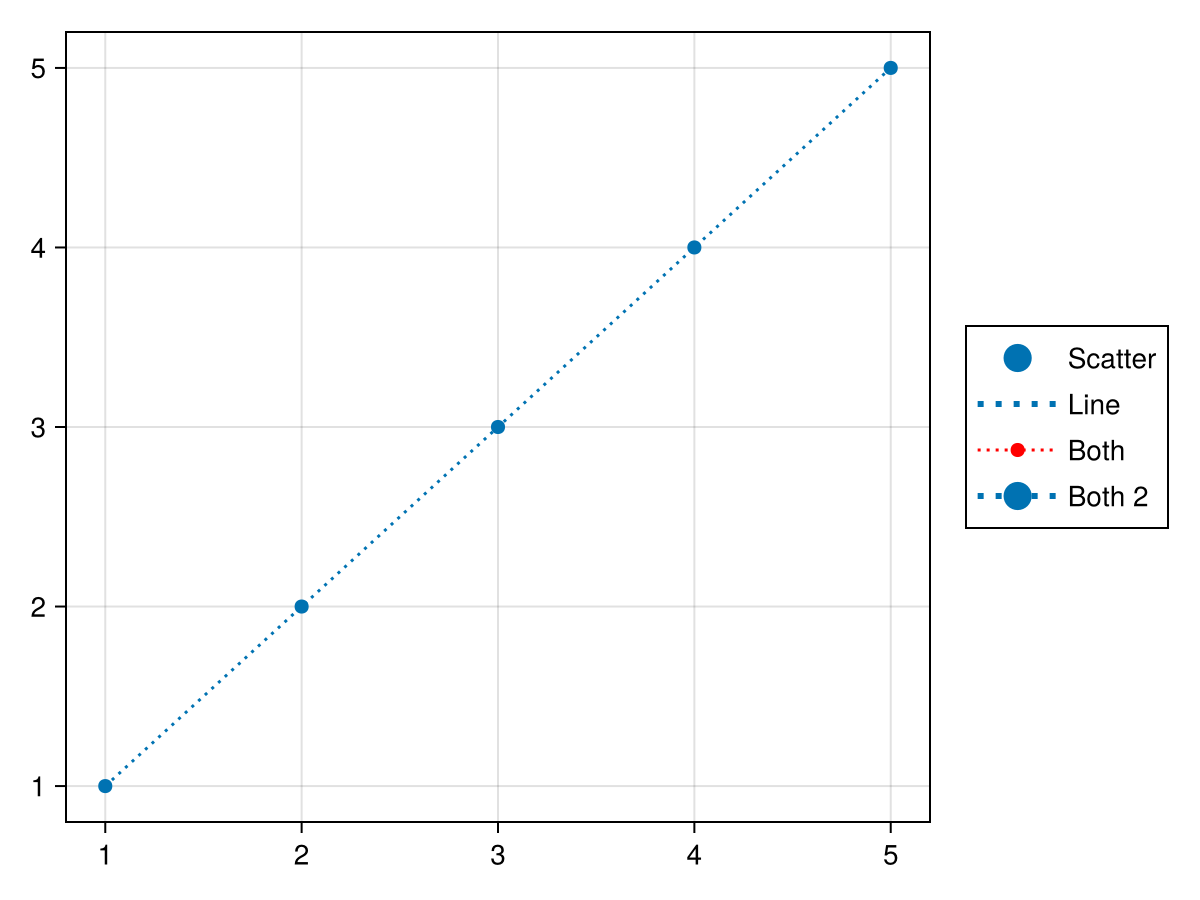
Multi-Group Legends
Sometimes a legend consists of multiple groups, for example in a plot where both marker size and color are varied and those properties need to be visualized separately, but still together in one legend. Each group's content is given as an array of elements and an array of labels, each within one collective array. You can shift the position of the titles relative to each group with the titleposition attribute, either :left or :top.
using CairoMakie

f = Figure()

markersizes = [5, 10, 15, 20]
colors = [:red, :green, :blue, :orange]

group_size = [MarkerElement(marker = :circle, color = :black,
    strokecolor = :transparent,
    markersize = ms) for ms in markersizes]

group_color = [PolyElement(color = color, strokecolor = :transparent)
    for color in colors]

legends = [Legend(f,
    [group_size, group_color],
    [string.(markersizes), string.(colors)],
    ["Size", "Color"], tellheight = true) for _ in 1:4]

f[1, 1:2] = legends[1:2]
f[2, :] = legends[3]
f[3, :] = legends[4]

for l in legends[3:4]
    l.orientation = :horizontal
    l.tellheight = true
    l.tellwidth = false
end

legends[2].titleposition = :left
legends[4].titleposition = :left

legends[1].nbanks = 2
legends[4].nbanks = 2

Label(f[1, 1, Left()], "titleposition = :top\norientation = :vertical\nnbanks = 2", font = :italic, padding = (0, 10, 0, 0))
Label(f[1, 2, Right()], "titleposition = :left\norientation = :vertical\nnbanks = 1", font = :italic, padding = (10, 0, 0, 0))
Label(f[2, 1:2, Top()], "titleposition = :top, orientation = :horizontal\nnbanks = 1", font = :italic)
Label(f[3, 1:2, Top()], "titleposition = :left, orientation = :horizontal\nnbanks = 2", font = :italic)

f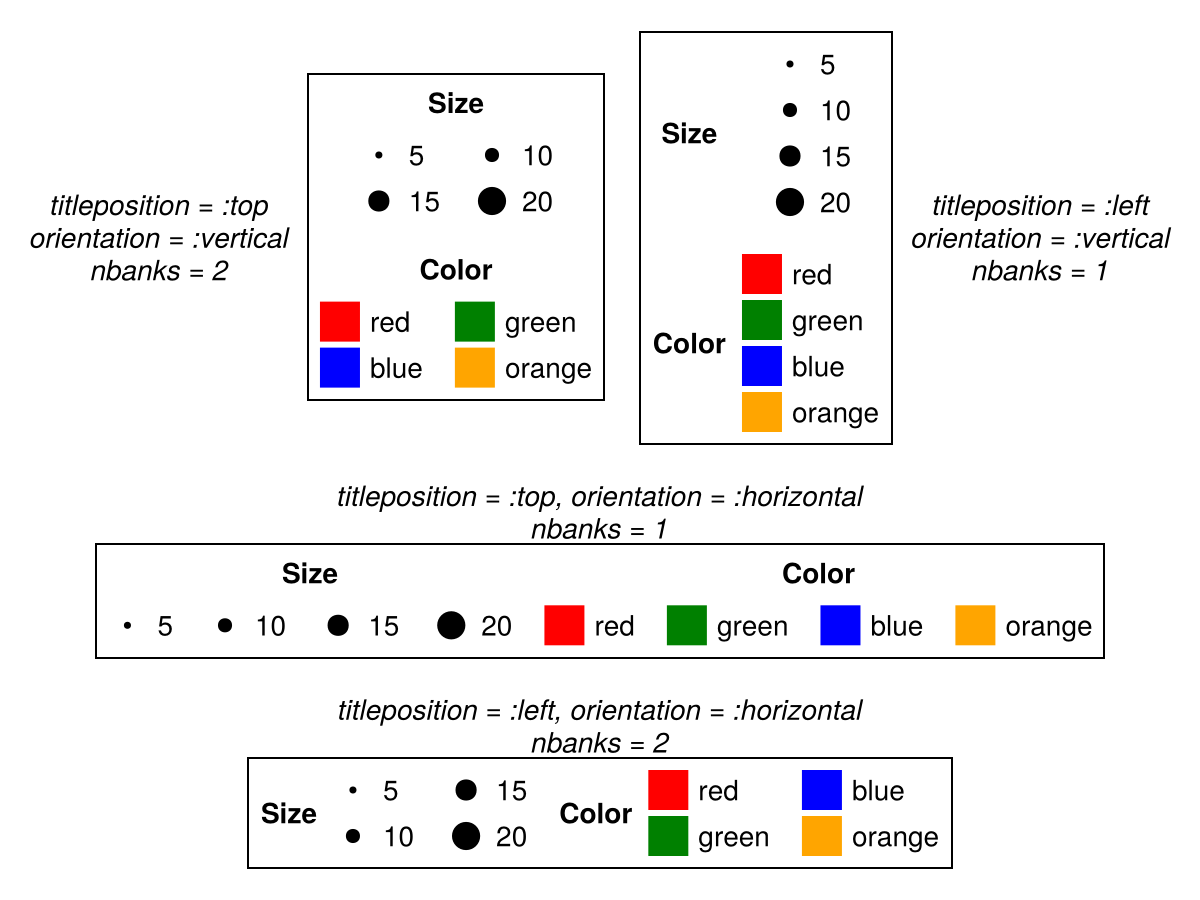
Legend Interactivity
The Legend can be interacted with to show or hide connected plots. A left click on a specific element will toggle the visibility of the connected plots. A right click anywhere in the Legend will toggle the visibility of all plots associated with every element. A middle click will toggle all plots if they have the same visibility state or make all visible if they do not. Note that if you construct elements (MarkerElement, PolyElement, etc.) yourself, you need to also pass a plot or vector of plots as the first argument to enable these interactions.
using GLMakie

fig = Figure(size = (600, 450))
ax = Axis(fig[1, 1])
lines!(ax, Rect2f(-1,-1,2,2), linewidth = 5, color = RGBf(0.3, 0.5, 1), label = "blue line")
scatter!(ax, Rect2f(-1,-1,2,2), markersize = 30, color = :orange, label = "orange scatter")
lines!(ax, Circle(Point2f(0), 1), linewidth = 5, color = :darkgreen, label = "green circle")
leg = axislegend(ax, position = (:center, :center))
fig
Attributes
alignmode
Defaults to Inside()
The align mode of the legend in its parent GridLayout.
alpha
Defaults to 1
The default alpha for legend elements
backgroundcolor
Defaults to :white
The background color of the legend.
bgcolor
Defaults to nothing
The background color of the legend. DEPRECATED - use backgroundcolor instead.
colgap
Defaults to 16
The gap between the label of one legend entry and the patch of the next.
using CairoMakie
fig = Figure()
ax = Axis(fig[1, 1])
lines!(ax, 1:10, linestyle = :dash, label = "Line")
poly!(ax, [(5, 0), (10, 0), (7.5, 5)], label = "Poly")
scatter!(ax, 4:13, label = "Scatter")
Legend(fig[1, 2], ax, "Default", nbanks = 2)
Legend(fig[1, 3], ax, "colgap = 40", nbanks = 2, colgap = 40)
fig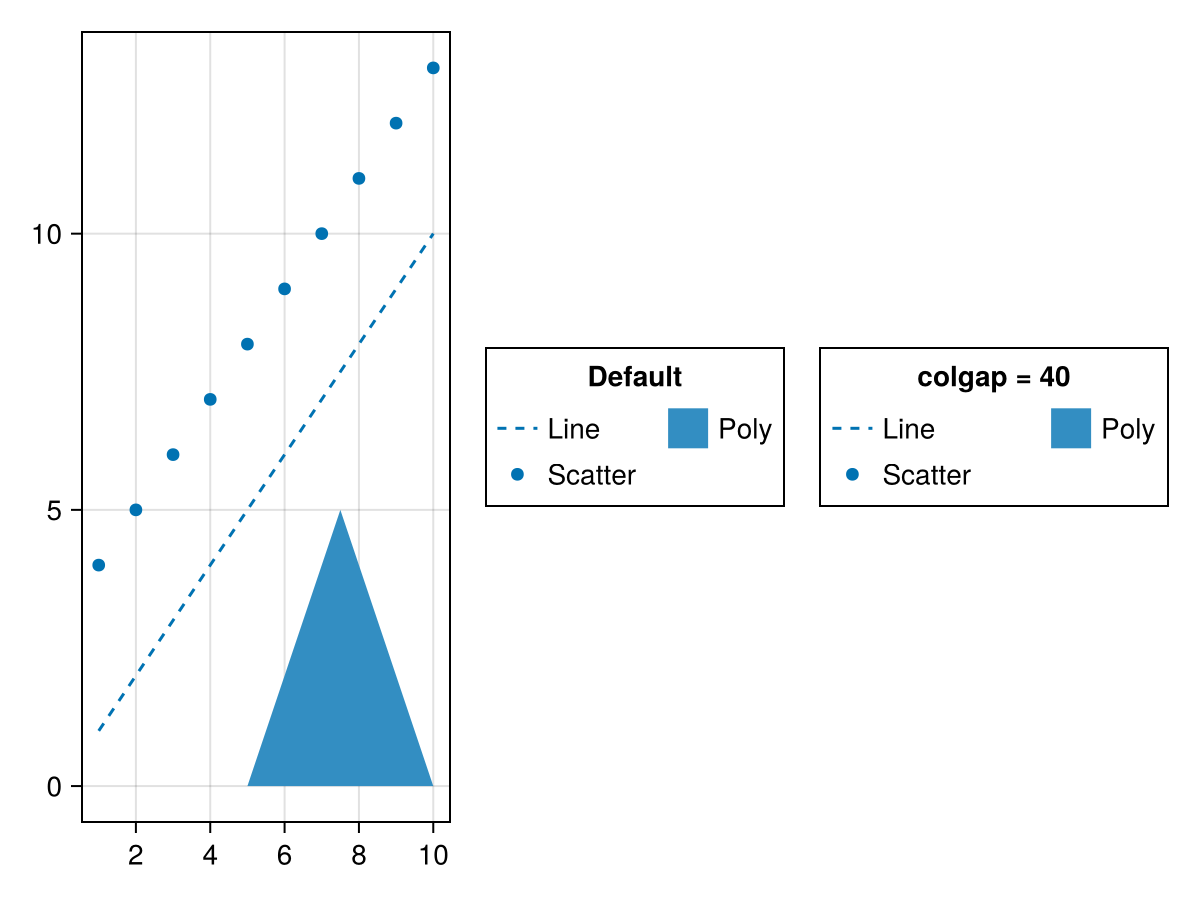
framecolor
Defaults to :black
The color of the legend border.
framevisible
Defaults to true
Controls if the legend border is visible.
framewidth
Defaults to 1.0
The line width of the legend border.
gridshalign
Defaults to :center
The horizontal alignment of entry groups in their parent GridLayout.
gridsvalign
Defaults to :center
The vertical alignment of entry groups in their parent GridLayout.
groupgap
Defaults to 16
The gap between each group and the next.
using CairoMakie
fig = Figure()
ax = Axis(fig[1, 1])
lin = lines!(ax, 1:10, linestyle = :dash)
pol = poly!(ax, [(5, 0), (10, 0), (7.5, 5)])
sca = scatter!(ax, 4:13)
Legend(fig[1, 2],
    [[lin], [pol], [sca]],
    [["Line"], ["Poly"], ["Scatter"]],
    ["Default", "Group 2", "Group 3"];

)
Legend(fig[1, 3],
    [[lin], [pol], [sca]],
    [["Line"], ["Poly"], ["Scatter"]],
    ["groupgap = 30", "Group 2", "Group 3"];
    groupgap = 30,
)
fig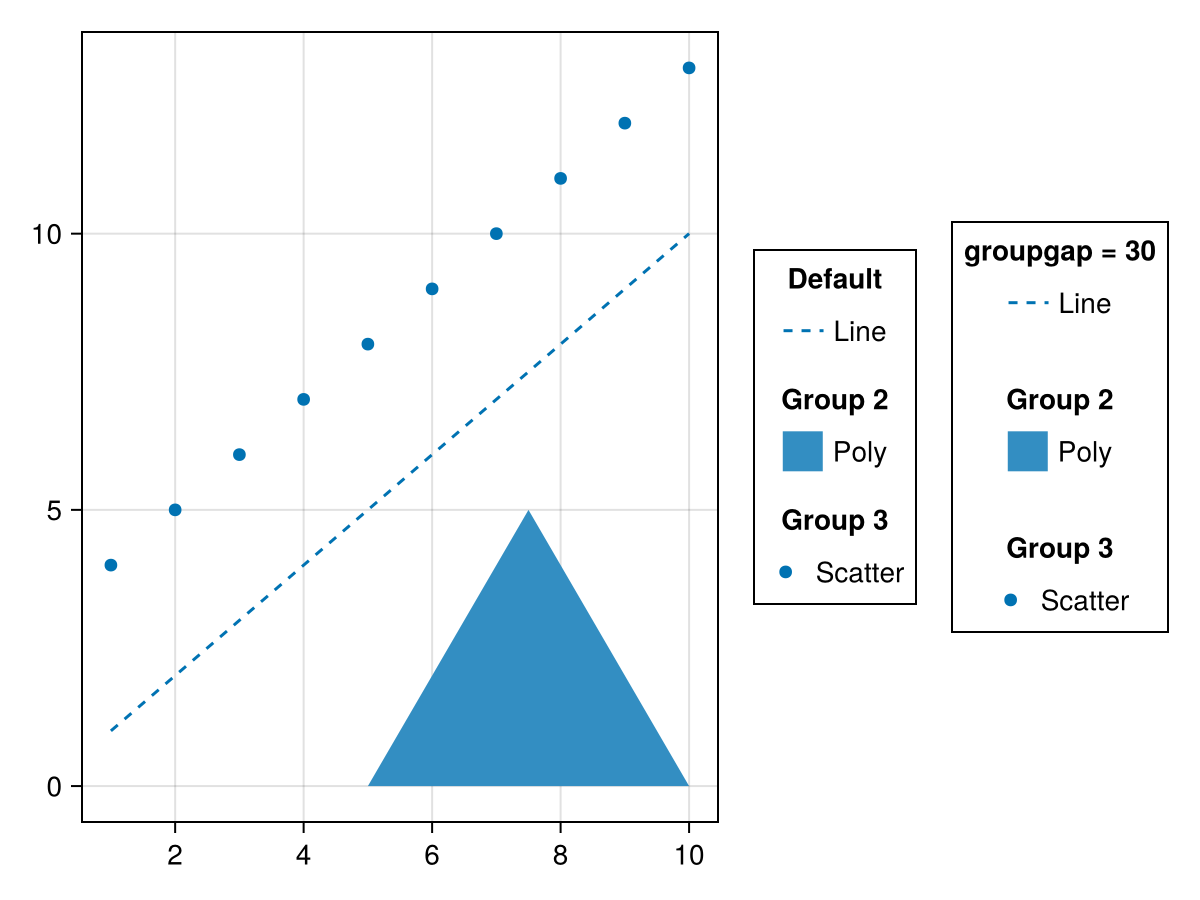
halign
Defaults to :center
The horizontal alignment of the legend in its suggested bounding box.
heatmapcolorrange
Defaults to automatic
The default colorrange for HeatmapElements. If not set this will be derived from heatmapvalues.
heatmaplimits
Defaults to (0 .. 1, 0 .. 1)
The default (x, y) limits (or vectors) used for HeatmapElements in normalized coordinates relative to each label patch.
heatmapvalues
Defaults to [0 0.3; 0.6 1]
The default values used for HeatmapElements.
height
Defaults to Auto()
The height setting of the legend.
imagecolorrange
Defaults to automatic
The default colorrange for ImageElements. If not set this will be derived from imagevalues.
imagelimits
Defaults to (0 .. 1, 0 .. 1)
The default (x, y) limits used for ImageElements in normalized coordinates relative to each label patch.
imagevalues
Defaults to [0 0.3; 0.6 1]
The default values (or colors) used for ImageElements.
joinstyle
Defaults to theme(scene, :joinstyle)
The default join style used for LineElements
label
Defaults to "undefined"
The default entry label.
labelcolor
Defaults to @inherit :textcolor :black
The color of the entry labels.
labelfont
Defaults to :regular
The font family of the entry labels.
labelhalign
Defaults to :left
The horizontal alignment of the entry labels.
labeljustification
Defaults to automatic
The justification of the label text. Default is automatic, which will set the justification to labelhalign.
labelsize
Defaults to @inherit :fontsize 16.0f0
The font size of the entry labels.
labelvalign
Defaults to :center
The vertical alignment of the entry labels.
linecap
Defaults to theme(scene, :linecap)
The default line cap used for LineElements
linecolor
Defaults to theme(scene, :linecolor)
The default line color used for LineElements
linecolormap
Defaults to theme(scene, :colormap)
The default colormap for LineElements
linecolorrange
Defaults to automatic
The default colorrange for LineElements
linepoints
Defaults to [Point2f(0, 0.5), Point2f(1, 0.5)]
The default points used for LineElements in normalized coordinates relative to each label patch.
linestyle
Defaults to :solid
The default line style used for LineElements
linewidth
Defaults to theme(scene, :linewidth)
The default line width used for LineElements.
margin
Defaults to (0.0f0, 0.0f0, 0.0f0, 0.0f0)
The additional space between the legend and its suggested boundingbox.
marker
Defaults to theme(scene, :marker)
The default marker for MarkerElements
markercolor
Defaults to theme(scene, :markercolor)
The default marker color for MarkerElements
markercolormap
Defaults to theme(scene, :colormap)
The default marker colormap for MarkerElements
markercolorrange
Defaults to automatic
The default marker colorrange for MarkerElements
markerpoints
Defaults to [Point2f(0.5, 0.5)]
The default marker points used for MarkerElements in normalized coordinates relative to each label patch.
markersize
Defaults to theme(scene, :markersize)
The default marker size used for MarkerElements.
markerstrokecolor
Defaults to theme(scene, :markerstrokecolor)
The default marker stroke color used for MarkerElements.
markerstrokewidth
Defaults to theme(scene, :markerstrokewidth)
The default marker stroke width used for MarkerElements.
mesh
Defaults to Rect3f(Point3f(-0.7), Vec3f(1.4))
The default mesh used for MeshElements. For 3D elements the camera is positioned at (1, 1, 1), looking towards (0, 0, 0) with z being up.
meshcolor
Defaults to (wong_colors())[1]
The default mesh color used for MeshElements.
meshcolormap
Defaults to theme(scene, :colormap)
The default colormap for MeshElements
meshcolorrange
Defaults to automatic
The default colorrange for MeshElements.
meshscattercolor
Defaults to theme(scene, :markercolor)
The default marker color for MeshScatterElements
meshscattercolormap
Defaults to theme(scene, :colormap)
The default marker colormap for MeshScatterElements
meshscattercolorrange
Defaults to automatic
The default marker colorrange for MeshScatterElements
meshscattermarker
Defaults to Sphere(Point3f(0), 1.0f0)
The default marker for MeshScatterElements
meshscatterpoints
Defaults to [Point3f(0)]
The default marker points used for MeshScatterElements. For 3D elements the camera is positioned at (1, 1, 1), looking towards (0, 0, 0) with z being up.
meshscatterrotation
Defaults to Quaternionf(0, 0, 0, 1)
The default marker rotation used for MeshScatterElements.
meshscattersize
Defaults to 0.8
The default marker size used for MeshScatterElements.
nbanks
Defaults to 1
The number of banks in which the legend entries are grouped. Columns if the legend is vertically oriented, otherwise rows.
using CairoMakie
fig = Figure()
ax = Axis(fig[1, 1])
lines!(ax, 1:10, linestyle = :dash, label = "Line")
poly!(ax, [(5, 0), (10, 0), (7.5, 5)], label = "Poly")
scatter!(ax, 4:13, label = "Scatter")
grid = GridLayout(fig[1, 2], tellheight = false)
Legend(grid[1, 1], ax, "nbanks = 1", nbanks = 1, tellheight = true)
Legend(grid[1, 2], ax, "nbanks = 2", nbanks = 2, tellheight = true)
Legend(grid[2, :], ax, "nbanks = 3", nbanks = 3, tellheight = true)
fig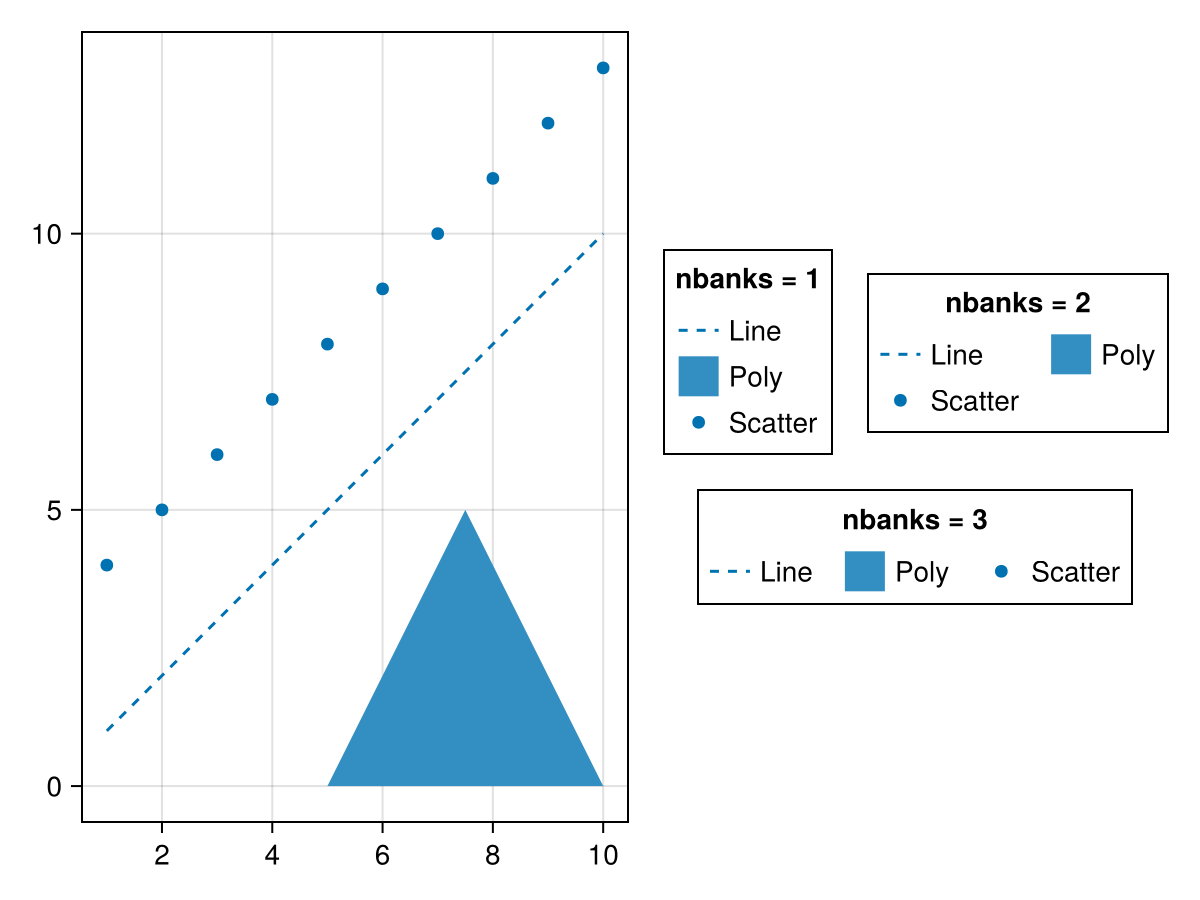
using CairoMakie
fig = Figure()
ax = Axis(fig[1, 1])
lines!(ax, 1:10, linestyle = :dash, label = "Line")
poly!(ax, [(5, 0), (10, 0), (7.5, 5)], label = "Poly")
scatter!(ax, 4:13, label = "Scatter")
grid = GridLayout(fig[2, 1], tellwidth = false)
Legend(grid[1, 1], ax, "nbanks = 1", nbanks = 1,
    orientation = :horizontal, tellwidth = true)
Legend(grid[2, 1], ax, "nbanks = 2", nbanks = 2,
    orientation = :horizontal, tellwidth = true)
Legend(grid[:, 2], ax, "nbanks = 3", nbanks = 3,
    orientation = :horizontal, tellwidth = true)
fig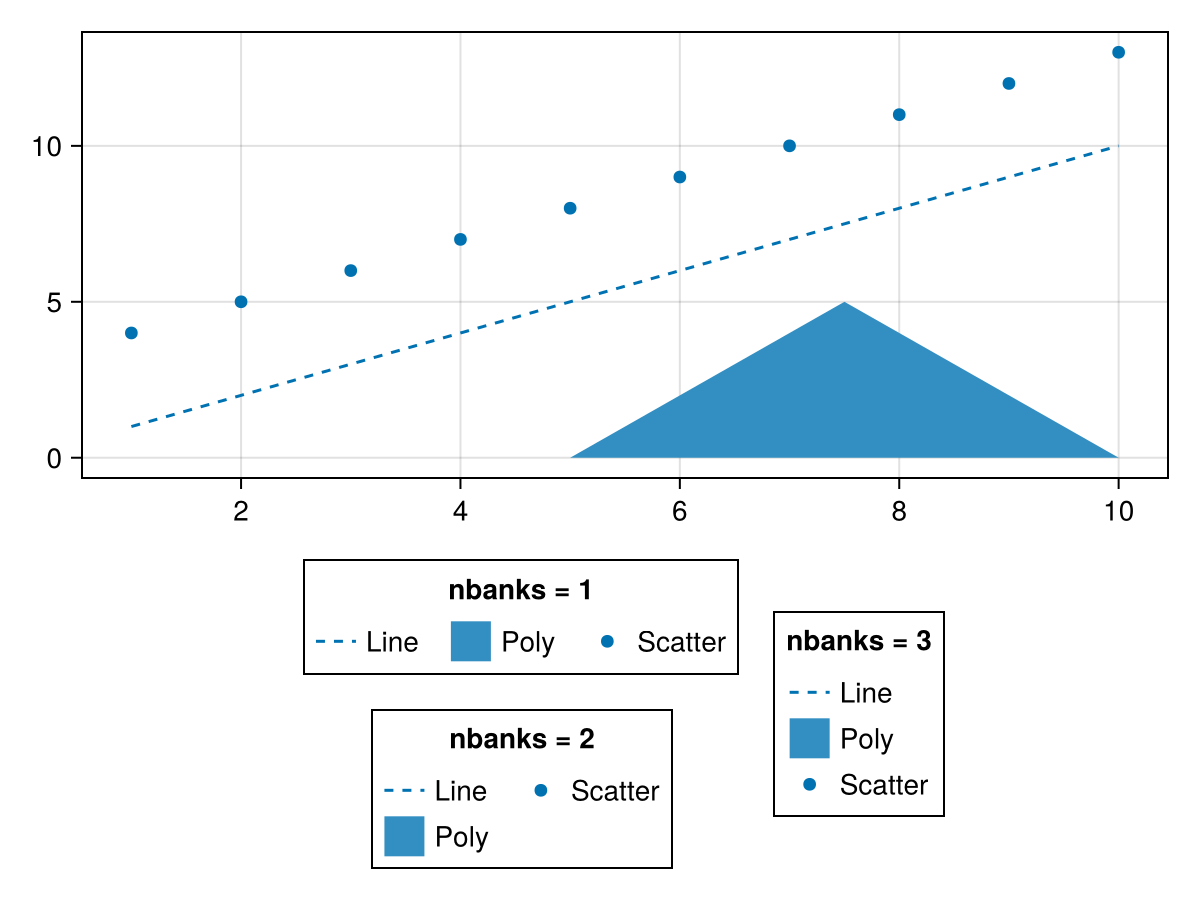
orientation
Defaults to :vertical
The orientation of the legend (:horizontal or :vertical).
using CairoMakie
fig = Figure()
ax = Axis(fig[1, 1])
lines!(ax, 1:10, linestyle = :dash, label = "Line")
poly!(ax, [(5, 0), (10, 0), (7.5, 5)], label = "Poly")
scatter!(ax, 4:13, label = "Scatter")
Legend(fig[2, 1], ax, "orientation
= :horizontal", orientation = :horizontal)
Legend(fig[1, 2], ax, "orientation
= :vertical", orientation = :vertical)
fig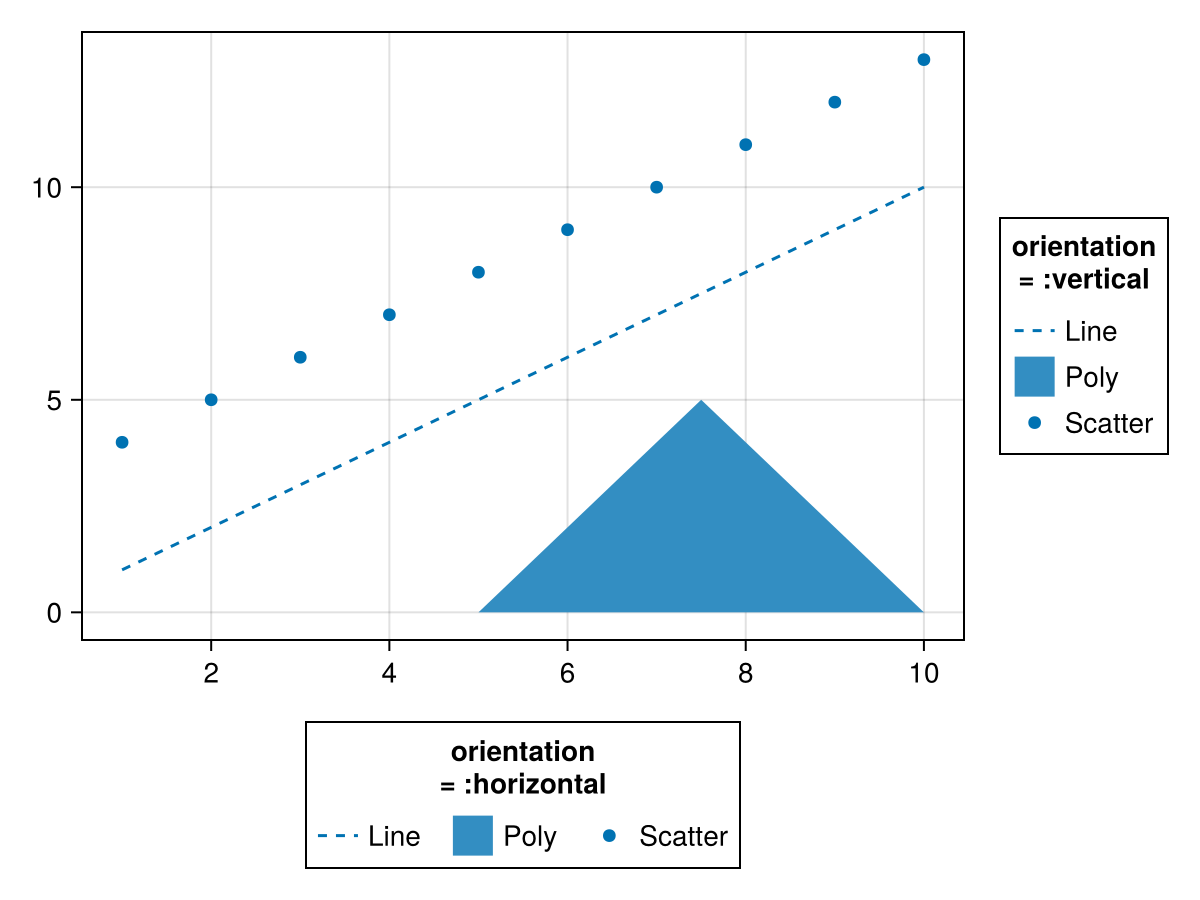
padding
Defaults to (6.0f0, 6.0f0, 6.0f0, 6.0f0)
The additional space between the legend content and the border.
patchcolor
Defaults to :transparent
The color of the patches containing the legend markers.
patchlabelgap
Defaults to 5
The gap between the patch and the label of each legend entry.
using CairoMakie
fig = Figure()
ax = Axis(fig[1, 1])
lines!(ax, 1:10, linestyle = :dash, label = "Line")
poly!(ax, [(5, 0), (10, 0), (7.5, 5)], label = "Poly")
scatter!(ax, 4:13, label = "Scatter")
Legend(fig[1, 2], ax, "Default")
Legend(fig[1, 3], ax, "patchlabelgap
= 20", patchlabelgap = 20)
fig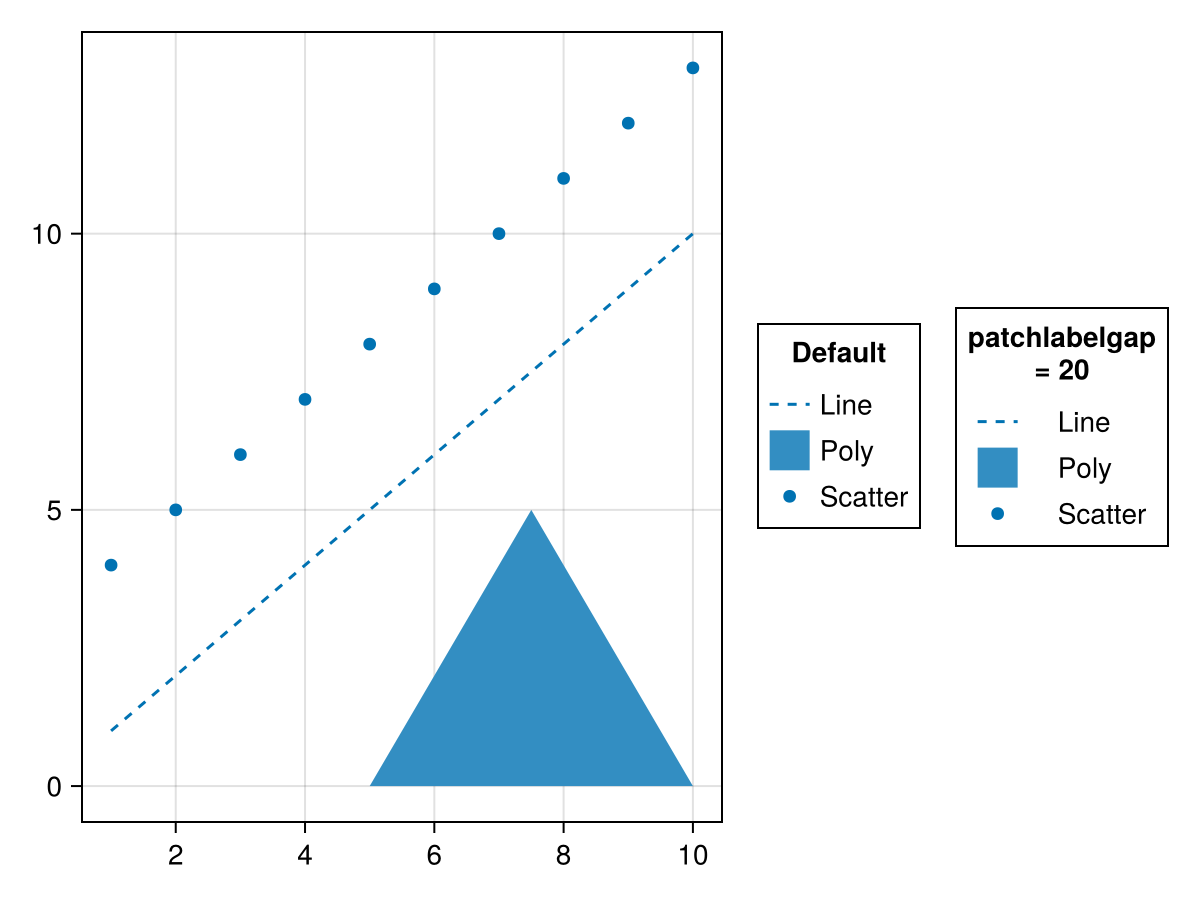
patchsize
Defaults to (20.0f0, 20.0f0)
The size of the rectangles containing the legend markers. It can help to increase the width if line patterns are not clearly visible with the default size.
using CairoMakie
fig = Figure()
ax = Axis(fig[1, 1])
lines!(ax, 1:10, linestyle = :dash, label = "Line")
poly!(ax, [(5, 0), (10, 0), (7.5, 5)], label = "Poly")
scatter!(ax, 4:13, label = "Scatter")
Legend(fig[1, 2], ax, "Default")
Legend(fig[1, 3], ax, "(40, 20)", patchsize = (40, 20))
fig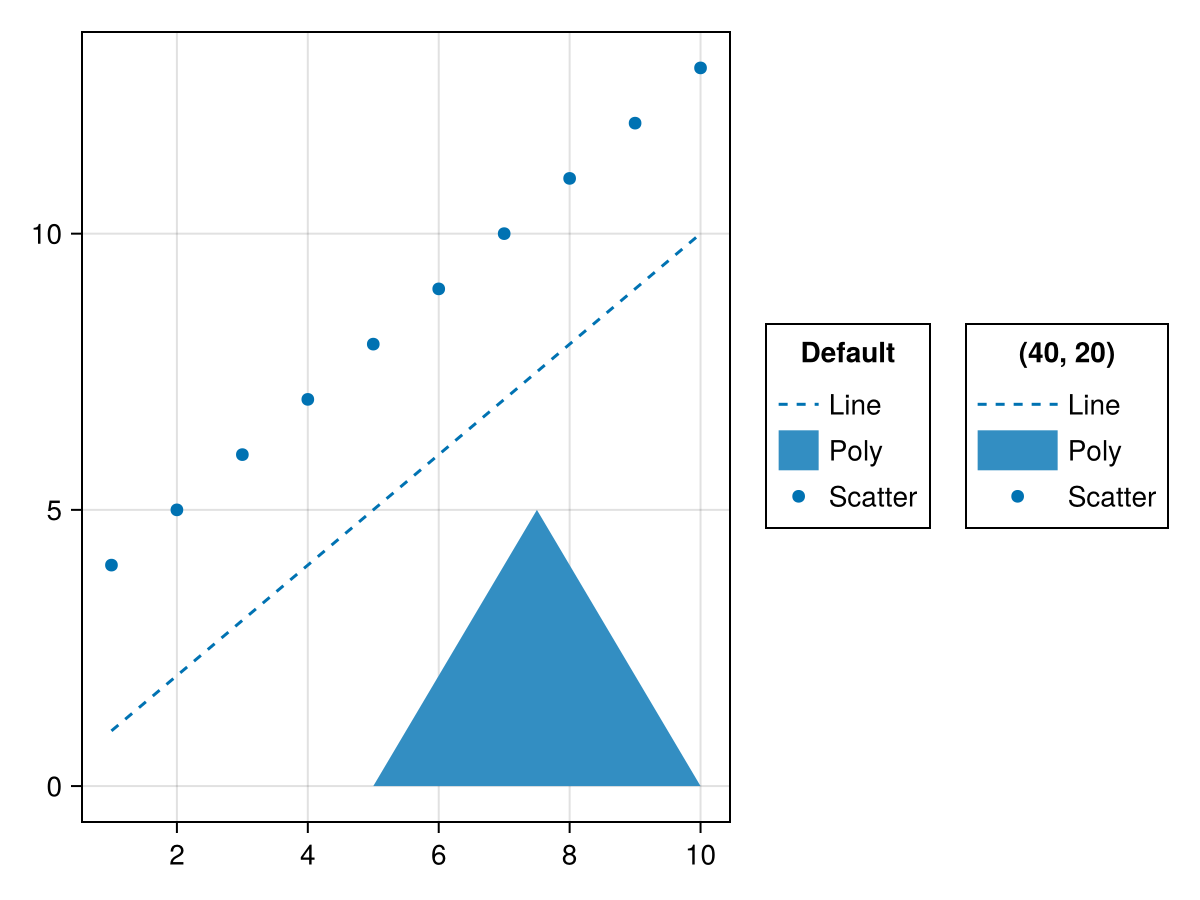
patchstrokecolor
Defaults to :transparent
The color of the border of the patches containing the legend markers.
patchstrokewidth
Defaults to 1.0
The line width of the border of the patches containing the legend markers.
polycolor
Defaults to theme(scene, :patchcolor)
The default poly color used for PolyElements.
polycolormap
Defaults to theme(scene, :colormap)
The default colormap for PolyElements
polycolorrange
Defaults to automatic
The default colorrange for PolyElements
polypoints
Defaults to [Point2f(0, 0), Point2f(1, 0), Point2f(1, 1), Point2f(0, 1)]
The default poly points used for PolyElements in normalized coordinates relative to each label patch.
polystrokecolor
Defaults to theme(scene, :patchstrokecolor)
The default poly stroke color used for PolyElements.
polystrokewidth
Defaults to theme(scene, :patchstrokewidth)
The default poly stroke width used for PolyElements.
rowgap
Defaults to 3
The gap between the entry rows.
using CairoMakie
fig = Figure()
ax = Axis(fig[1, 1])
lines!(ax, 1:10, linestyle = :dash, label = "Line")
poly!(ax, [(5, 0), (10, 0), (7.5, 5)], label = "Poly")
scatter!(ax, 4:13, label = "Scatter")
Legend(fig[1, 2], ax, "Default")
Legend(fig[1, 3], ax, "rowgap = 10", rowgap = 10)
fig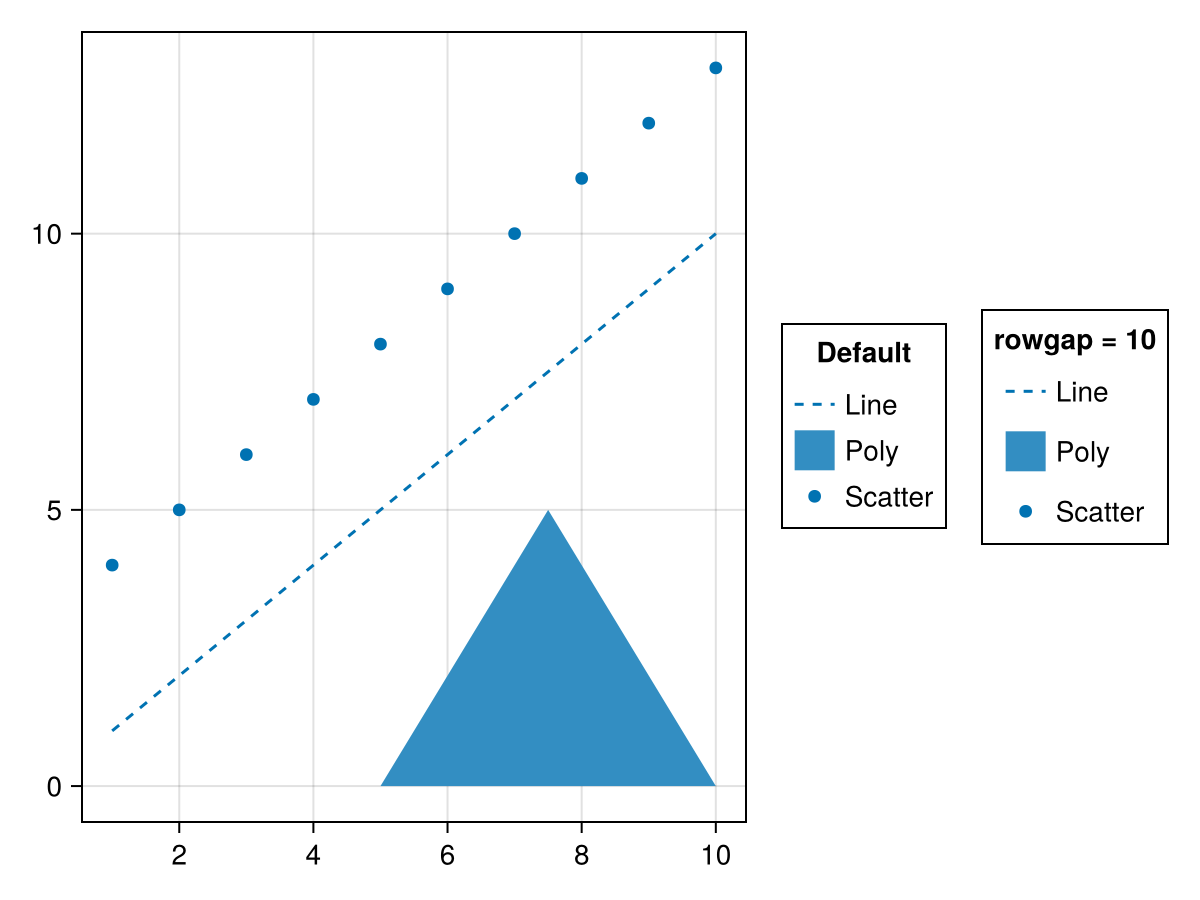
surfacecolormap
Defaults to theme(scene, :colormap)
The default colormap for surface-based MeshElements
surfacecolorrange
Defaults to automatic
The default colorrange for surface-based MeshElements. If not set this will be derived from surfacevalues.
surfacedata
Defaults to (-0.7 .. 0.7, -0.7 .. 0.7, [-0.007 * x ^ 3 * (1 - 0.05 * y ^ 2) for x = -5:5, y = -5:5])
The default (x, y, z) data used for surface-based MeshElements. For 3D elements the camera is positioned at (1, 1, 1), looking towards (0, 0, 0) with z being up.
surfacevalues
Defaults to automatic
The default values/colors used for surface-based MeshElements. These need to match the size of zs. If not set the z values will be used.
tellheight
Defaults to automatic
Controls if the parent layout can adjust to this element's height
tellwidth
Defaults to automatic
Controls if the parent layout can adjust to this element's width
titlecolor
Defaults to @inherit :textcolor :black
The color of the legend titles
titlefont
Defaults to :bold
The font family of the legend group titles.
titlegap
Defaults to 8
The gap between each group title and its group.
titlehalign
Defaults to :center
The horizontal alignment of the legend group titles.
titleposition
Defaults to :top
The group title positions relative to their groups. Can be :top or :left.
using CairoMakie
fig = Figure()
ax = Axis(fig[1, 1])
lines!(ax, 1:10, linestyle = :dash, label = "Line")
poly!(ax, [(5, 0), (10, 0), (7.5, 5)], label = "Poly")
scatter!(ax, 4:13, label = "Scatter")
Legend(fig[1, 2], ax, "titleposition
= :top", titleposition = :top)
Legend(fig[1, 3], ax, "titleposition
= :left", titleposition = :left)
fig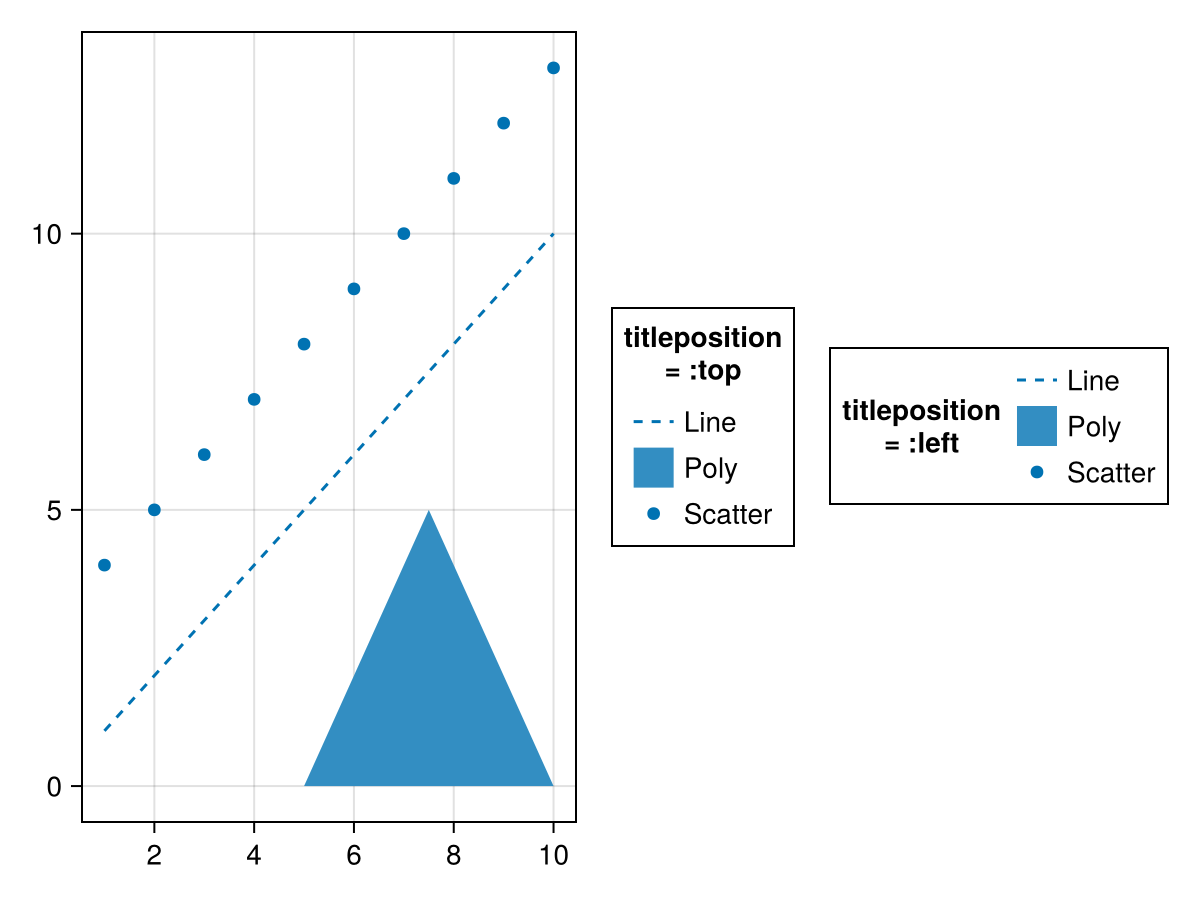
titlesize
Defaults to @inherit :fontsize 16.0f0
The font size of the legend group titles.
titlevalign
Defaults to :center
The vertical alignment of the legend group titles.
titlevisible
Defaults to true
Controls if the legend titles are visible.
valign
Defaults to :center
The vertical alignment of the legend in its suggested bounding box.
width
Defaults to Auto()
The width setting of the legend.