scatter
Makie.scatter Function
scatter(positions)
scatter(x, y)
scatter(x, y, z)
Plots a marker for each element in (x, y, z), (x, y), or positions.
Plot type
The plot type alias for the scatter function is Scatter.
Examples
Using x and y vectors
Scatters can be constructed by passing a list of x and y coordinates.
using CairoMakie
xs = range(0, 10, length = 30)
ys = 0.5 .* sin.(xs)

scatter(xs, ys)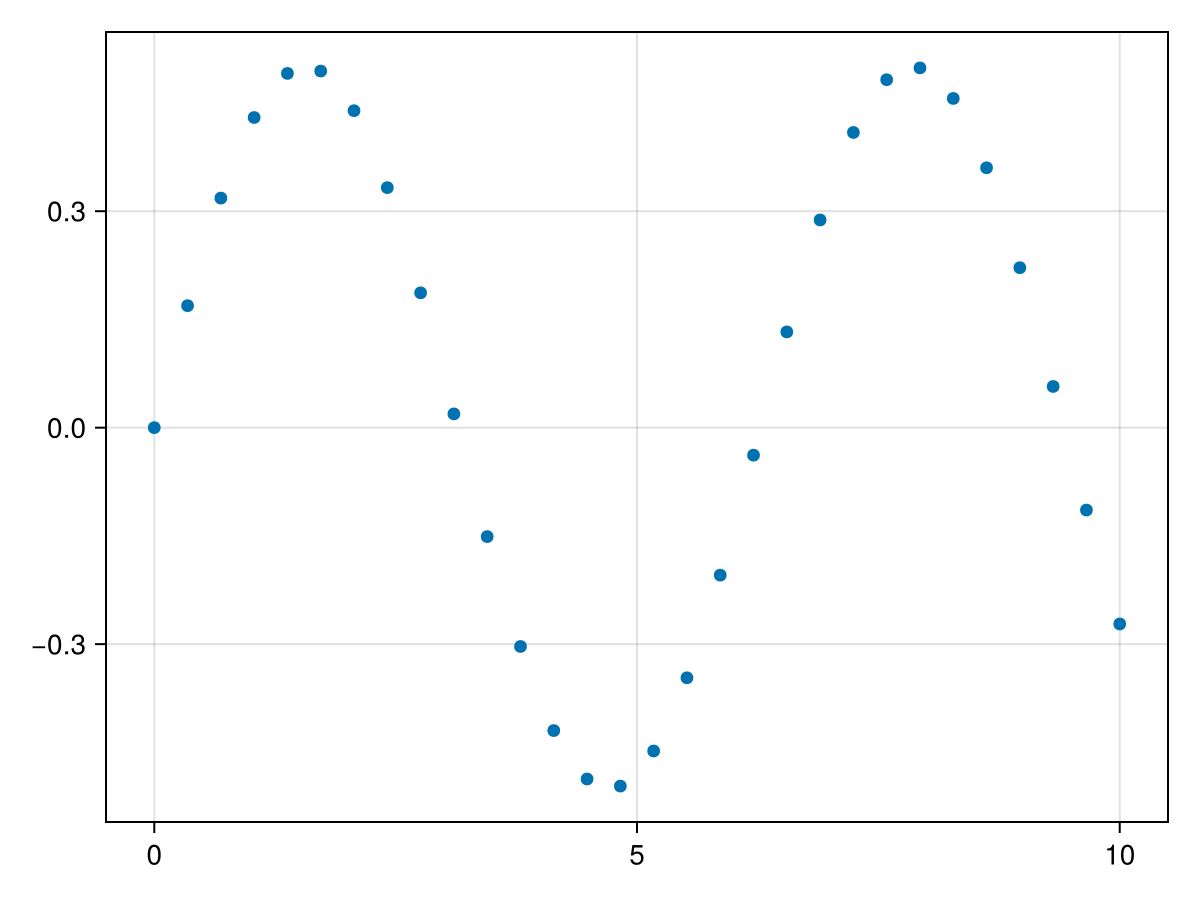
Using points
It is also possible to pass coordinates as a vector of points, which is preferred if the coordinates should be updated later, to avoid different lengths of x and y.
Attributes like color and markersize can be set in scalar or vector form. If you pass a vector of numbers for color, the attribute colorrange which is by default automatically equal to the extrema of the color values, decides how colors are looked up in the colormap.
using CairoMakie
xs = range(0, 10, length = 30)
ys = 0.5 .* sin.(xs)
points = Point2f.(xs, ys)

scatter(points, color = 1:30, markersize = range(5, 30, length = 30),
    colormap = :thermal)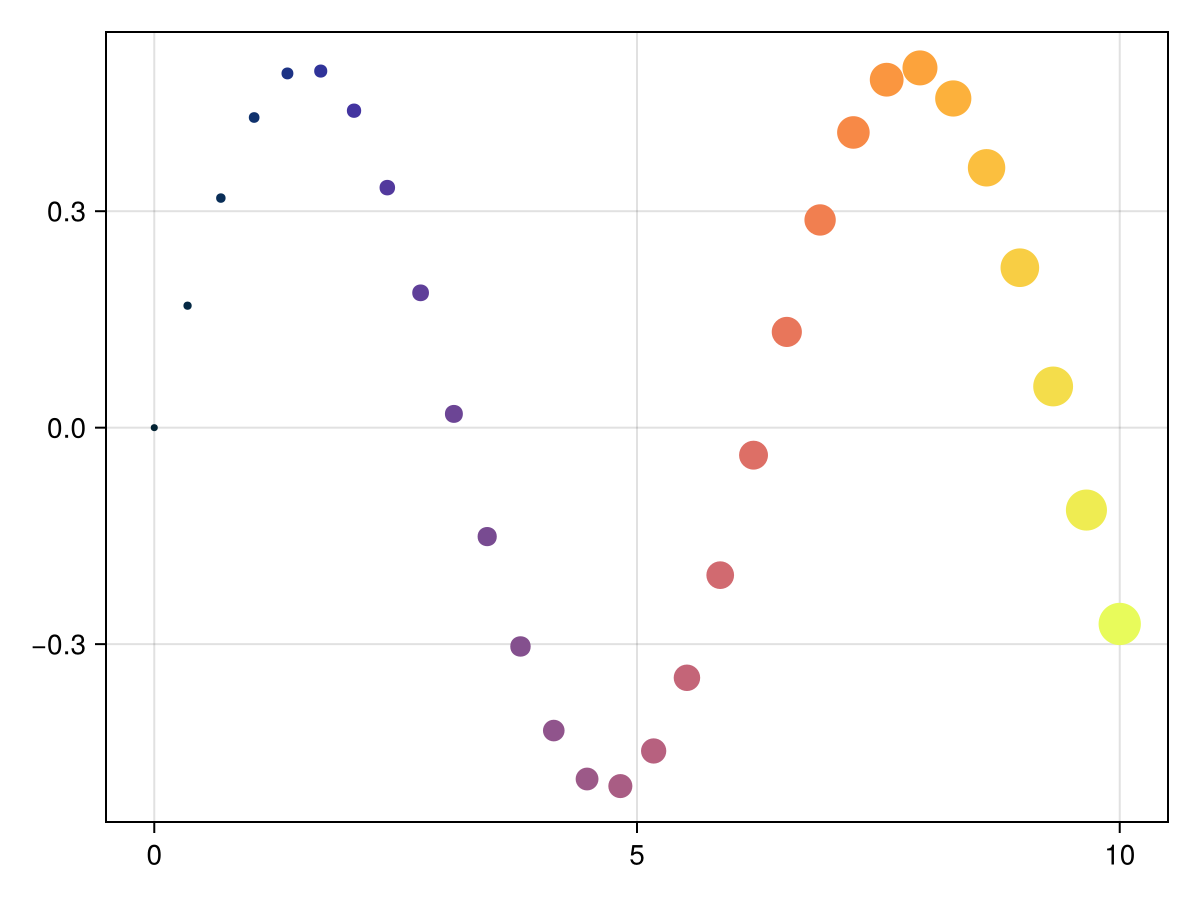
Markers
There are a couple different categories of markers you can use with scatter:
Chars like'x'or'α'. The glyphs are taken from Makie's default fontTeX Gyre Heros Makie.BezierPathobjects which can be used to create custom marker shapes. Most default markers which are accessed by symbol such as:circleor:rectconvert toBezierPaths internally.Polygons, which are equivalent to constructingBezierPaths exclusively out ofLineTocommands.Matrix{<:Colorant}objects which are plotted as image scatters.Special markers like
CircleandRectwhich have their own backend implementations and can be faster to display.
Default markers
Here is an example plot showing different shapes that are accessible by Symbols, as well as a few characters.
using CairoMakie
markers_labels = [
    (:circle, ":circle"),
    (:rect, ":rect"),
    (:diamond, ":diamond"),
    (:hexagon, ":hexagon"),
    (:cross, ":cross"),
    (:xcross, ":xcross"),
    (:utriangle, ":utriangle"),
    (:dtriangle, ":dtriangle"),
    (:ltriangle, ":ltriangle"),
    (:rtriangle, ":rtriangle"),
    (:pentagon, ":pentagon"),
    (:star4, ":star4"),
    (:star5, ":star5"),
    (:star6, ":star6"),
    (:star8, ":star8"),
    (:vline, ":vline"),
    (:hline, ":hline"),
    ('a', "'a'"),
    ('B', "'B'"),
    ('↑', "'\\uparrow'"),
    ('😄', "'\\:smile:'"),
    ('✈', "'\\:airplane:'"),
]

f = Figure()
ax = Axis(f[1, 1], yreversed = true,
    xautolimitmargin = (0.15, 0.15),
    yautolimitmargin = (0.15, 0.15)
)
hidedecorations!(ax)

for (i, (marker, label)) in enumerate(markers_labels)
    p = Point2f(fldmod1(i, 6)...)

    scatter!(p, marker = marker, markersize = 20, color = :black)
    text!(p, text = label, color = :gray70, offset = (0, 20),
        align = (:center, :bottom))
end

f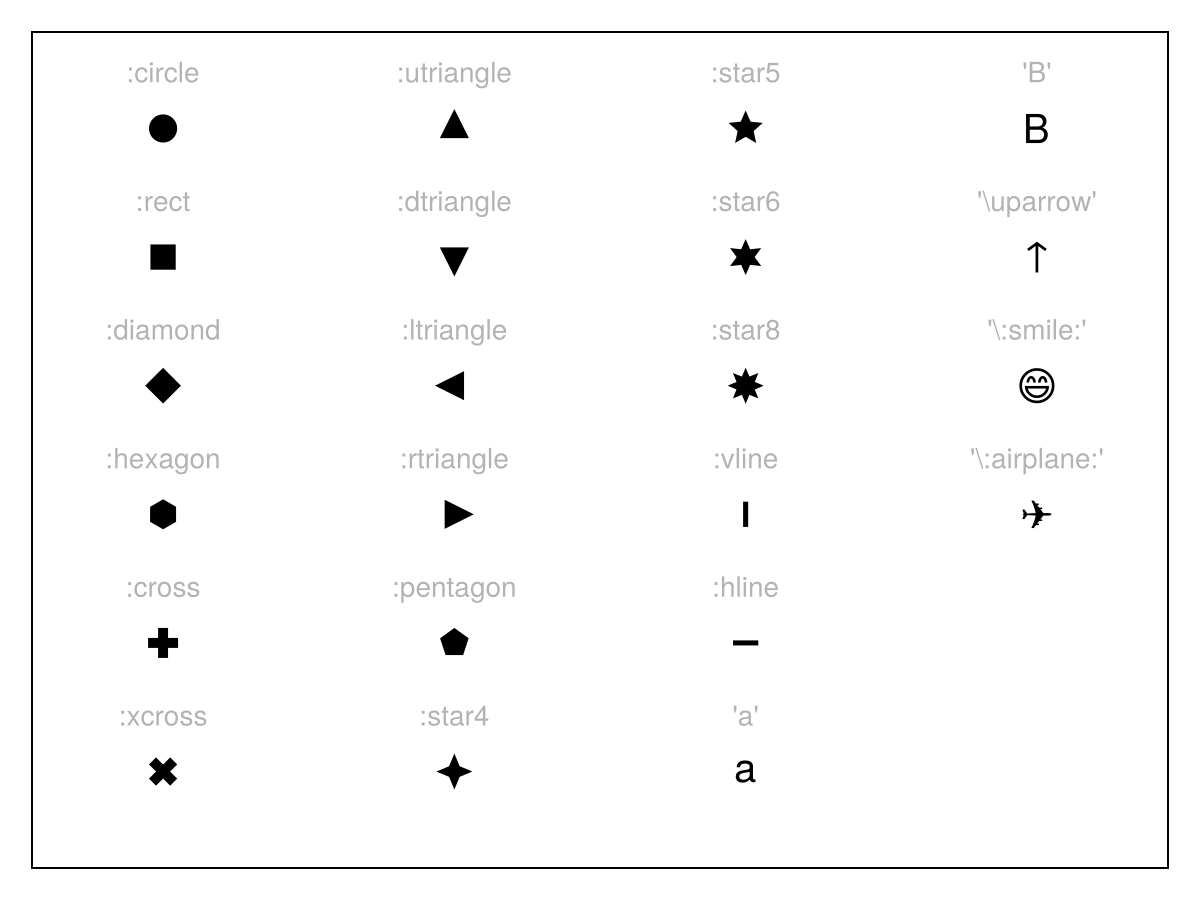
Markersize
The markersize attribute scales the scatter size relative to the scatter marker's base size. Therefore, markersize cannot be directly understood in terms of a unit like px, it depends on what is scaled.
For Char markers, markersize is equivalent to the font size when displaying the same characters using text.
using CairoMakie
f, ax, sc = scatter(1, 1, marker = 'A', markersize = 50)
text!(2, 1, text = "A", fontsize = 50, align = (:center, :center))
xlims!(ax, -1, 4)
f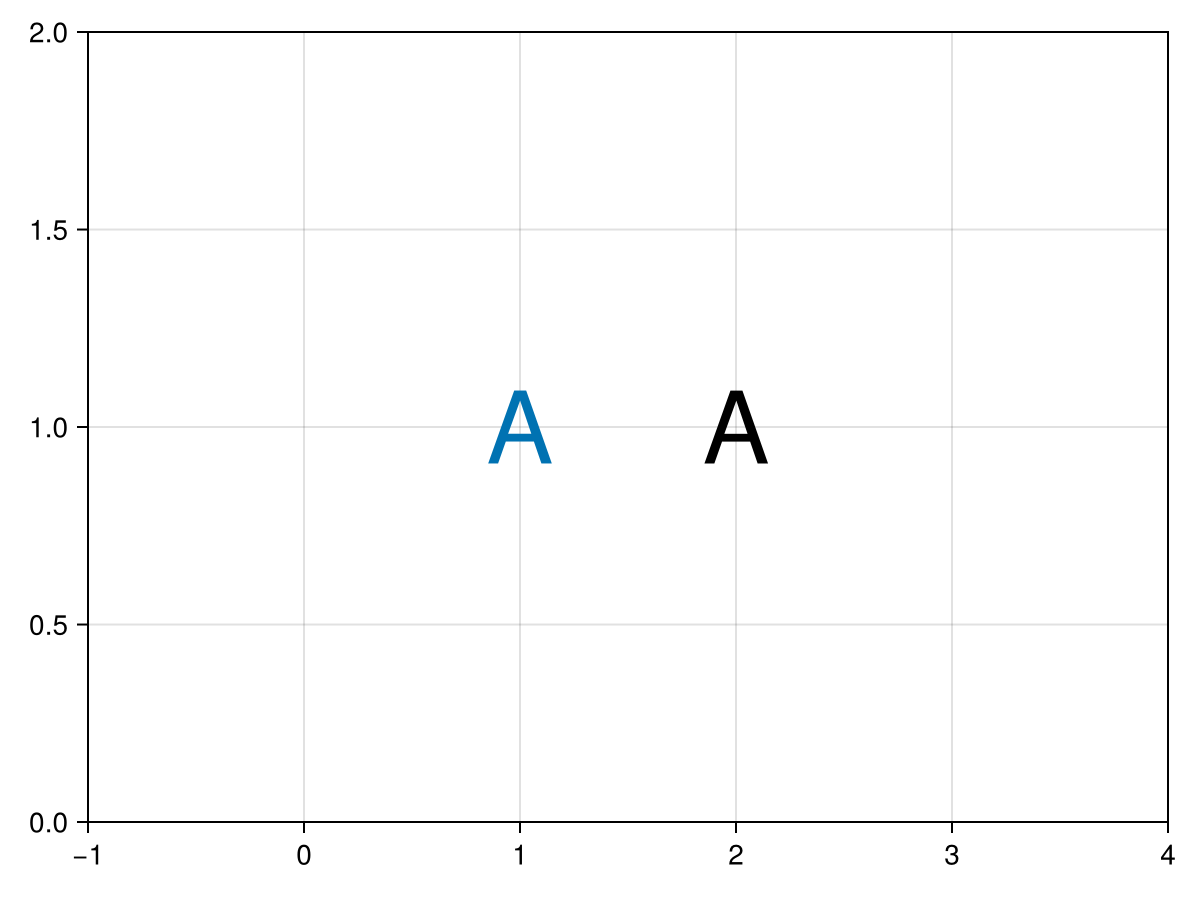
The default BezierPath markers like :circle, :rect, :utriangle, etc. have been chosen such that they approximately match Char markers of the same markersize. This makes it easier to switch out markers without the overall look changing too much. However, both Char and BezierPath markers are not exactly markersize high or wide. We can visualize this by plotting some Chars, BezierPaths, Circle and Rect in front of a line of width 50. You can see that only the special markers Circle and Rect match the line width because their base size is 1 x 1, however they don't match the Chars or BezierPaths very well.
using CairoMakie
f, ax, l = lines([0, 1], [1, 1], linewidth = 50, color = :gray80)
for (marker, x) in zip(['X', 'x', :circle, :rect, :utriangle, Circle, Rect], range(0.1, 0.9, length = 7))
    scatter!(ax, x, 1, marker = marker, markersize = 50, color = :black)
end
f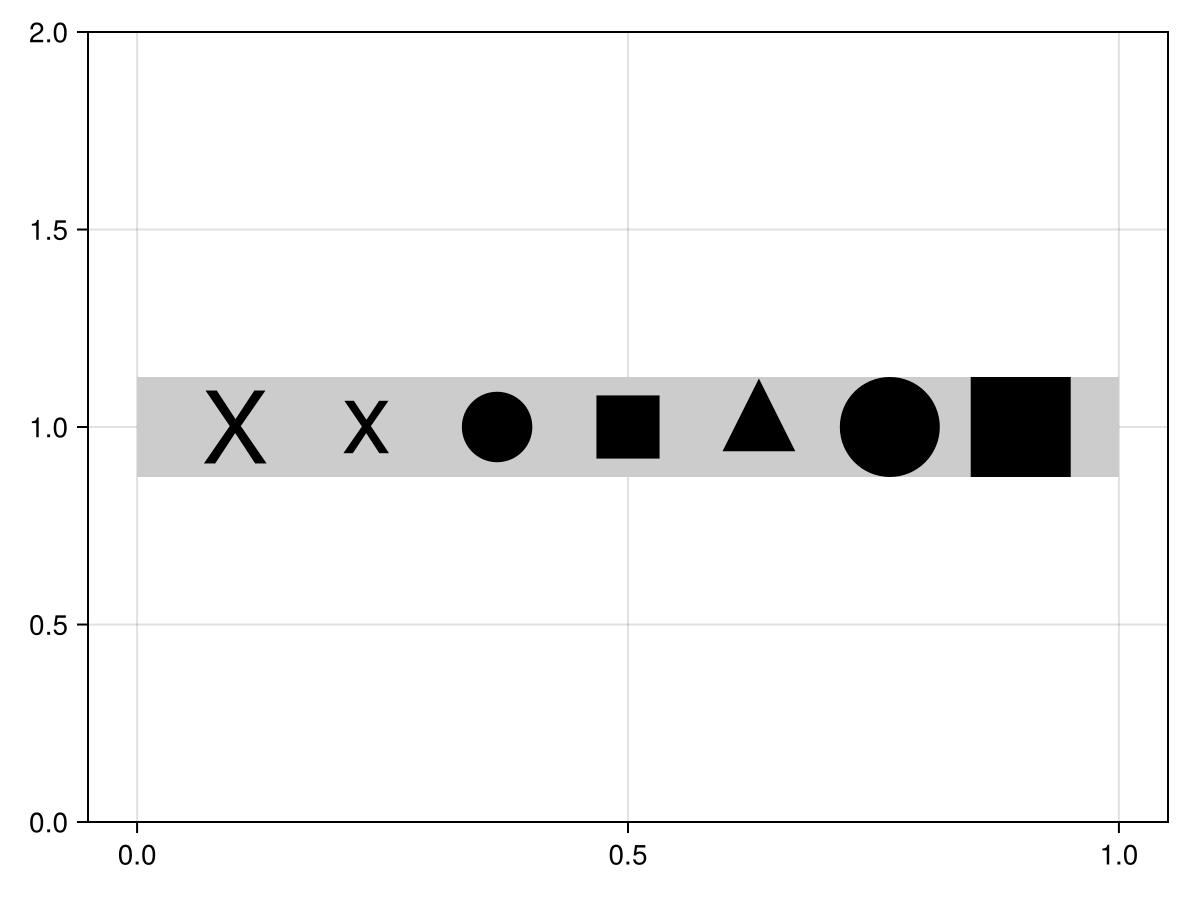
If you need a marker that has some exact base size, so that you can match it with lines or other plot objects of known size, or because you want to use the marker in data space, you can construct it yourself using BezierPath or Polygon. A marker with a base size of 1 x 1, e.g., will be scaled like lines when markersize and linewidth are the same, just like Circle and Rect markers.
Here, we construct a hexagon polygon with radius 1, which we can then use to tile a surface in data coordinates by setting markerspace = :data.
using CairoMakie
hexagon = Makie.Polygon([Point2f(cos(a), sin(a)) for a in range(1/6 * pi, 13/6 * pi, length = 7)])

points = Point2f[(0, 0), (sqrt(3), 0), (sqrt(3)/2, 1.5)]

scatter(points,
    marker = hexagon,
    markersize = 1,
    markerspace = :data,
    color = 1:3,
    axis = (; aspect = 1, limits = (-2, 4, -2, 4)))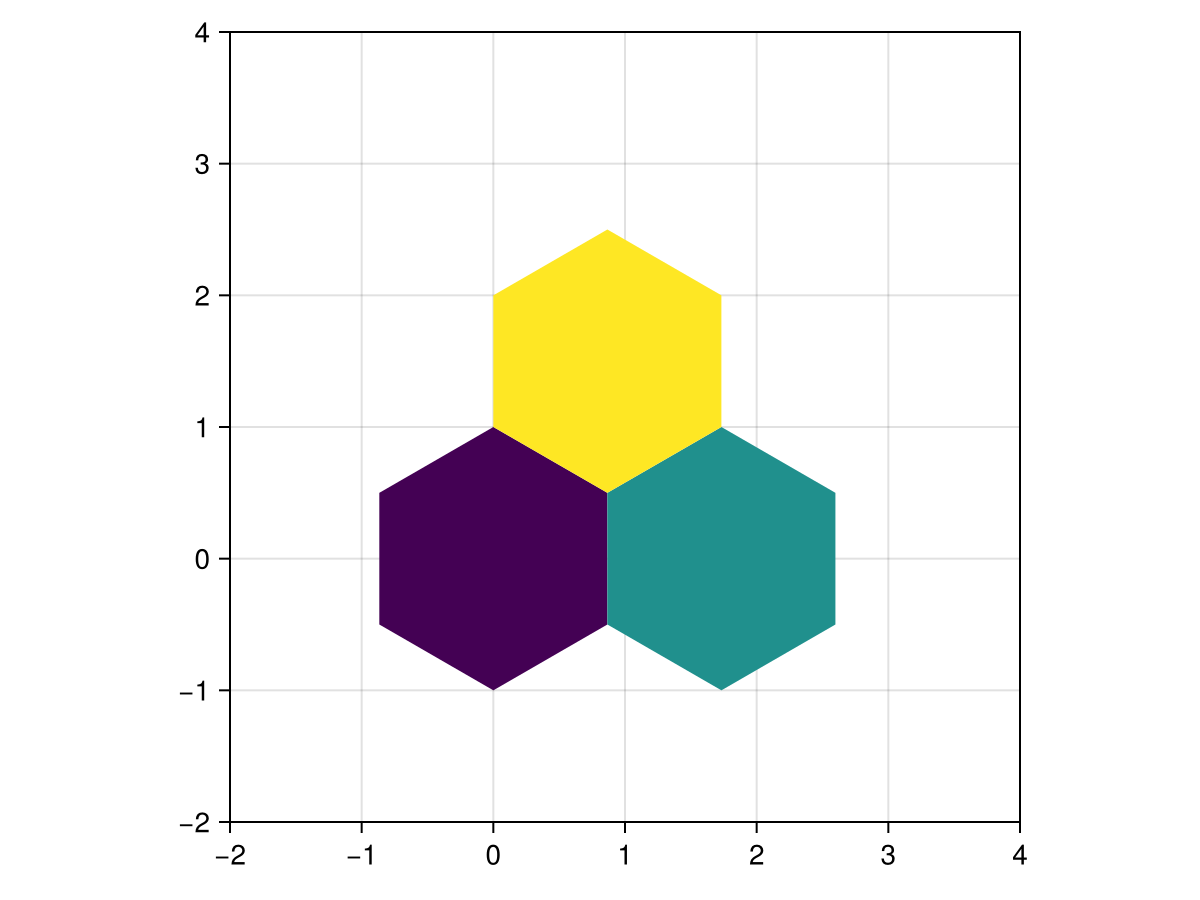
Bezier path markers
Bezier paths are the basis for vector graphic formats such as svg and pdf and consist of a couple different operations that can define complex shapes.
A BezierPath contains a vector of path commands, these are MoveTo, LineTo, CurveTo, EllipticalArc and ClosePath. A filled shape should start with MoveTo and end with ClosePath.
Note
Unfilled markers (like a single line or curve) are possible in CairoMakie but not in GLMakie and WGLMakie, because these backends have to render the marker as a filled shape to a texture first. If no filling can be rendered, the marker will be invisible. CairoMakie, on the other hand can stroke such markers without problem.
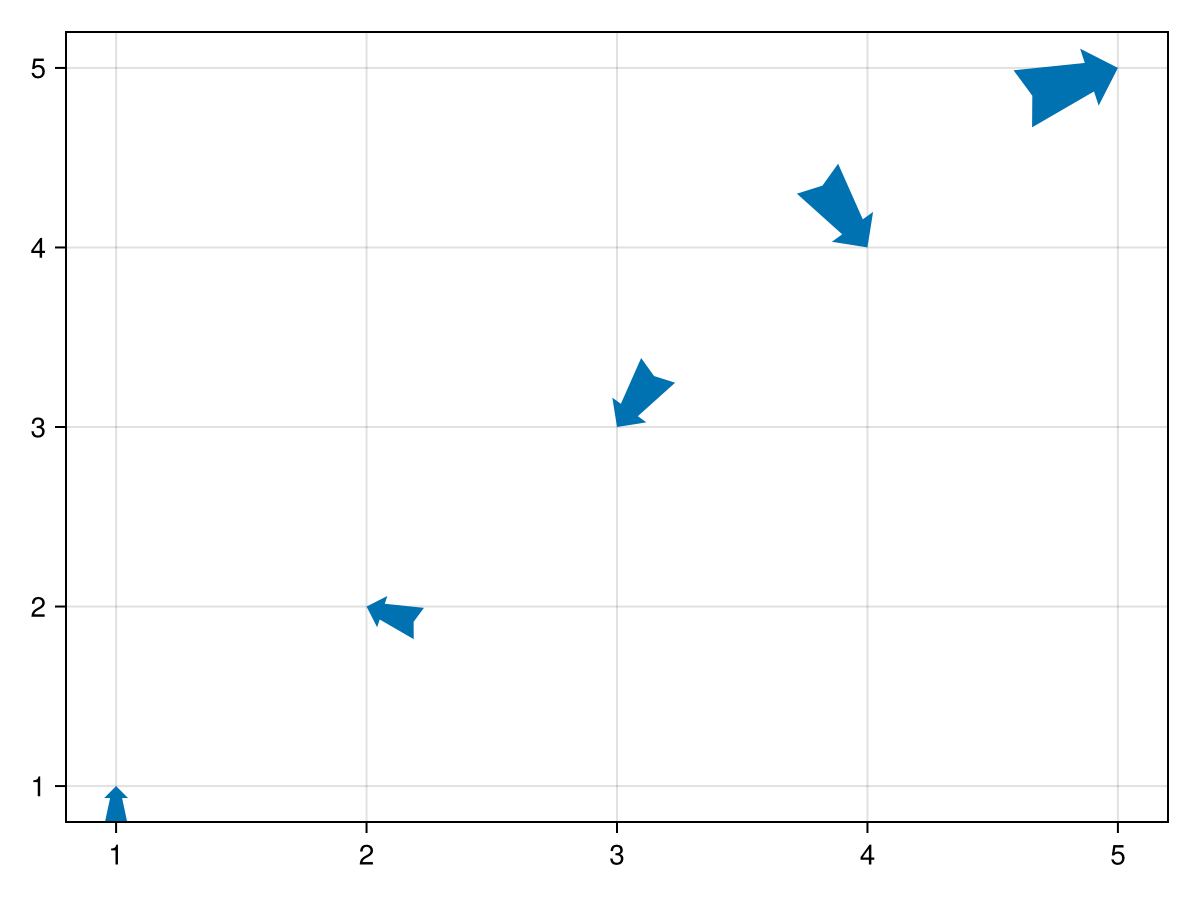
Here is an example with a simple arrow that is centered on its tip, built from path elements.
using CairoMakie
arrow_path = BezierPath([
    MoveTo(Point(0, 0)),
    LineTo(Point(0.3, -0.3)),
    LineTo(Point(0.15, -0.3)),
    LineTo(Point(0.3, -1)),
    LineTo(Point(0, -0.9)),
    LineTo(Point(-0.3, -1)),
    LineTo(Point(-0.15, -0.3)),
    LineTo(Point(-0.3, -0.3)),
    ClosePath()
])

scatter(1:5,
    marker = arrow_path,
    markersize = range(20, 50, length = 5),
    rotation = range(0, 2pi, length = 6)[1:end-1],
)
Here's an example with the CurveTo command.
using CairoMakie
heart = BezierPath([
    MoveTo(Point(0, -1)),
    CurveTo(Point(-1.5, -0.4), Point(-0.6, 1.2), Point(0, 0)),
    CurveTo(Point(0.6, 1.2), Point(1.5, -0.4), Point(0, -1)),
    ClosePath()
])

on_curve = Point2f[(0, -1), (0, 0)]
controls = Point2f[(-1.5, -0.4), (-0.6, 1.2)]

f = Figure()
ax = Axis(f[1, 1], aspect = 1)

scatter!(ax, Point2f(0, 0), marker = heart, markersize = 1,
    markerspace = :data, color = (:red, 0.3), strokewidth = 2, strokecolor = :red)

for (from, to) in zip(on_curve, controls)
    lines!(ax, [from, to], color = :gray60, linestyle = :dash)
end
scatter!(ax, controls, color = :gray60, markersize = 10)
scatter!(ax, on_curve, color = :black, markersize = 12)

annotation!(ax, controls, text = ["control point 1", "control point 2"], fontsize = 12)
annotation!(ax, on_curve, text = ["on-curve point 1", "on-curve point 2"], fontsize = 12)

f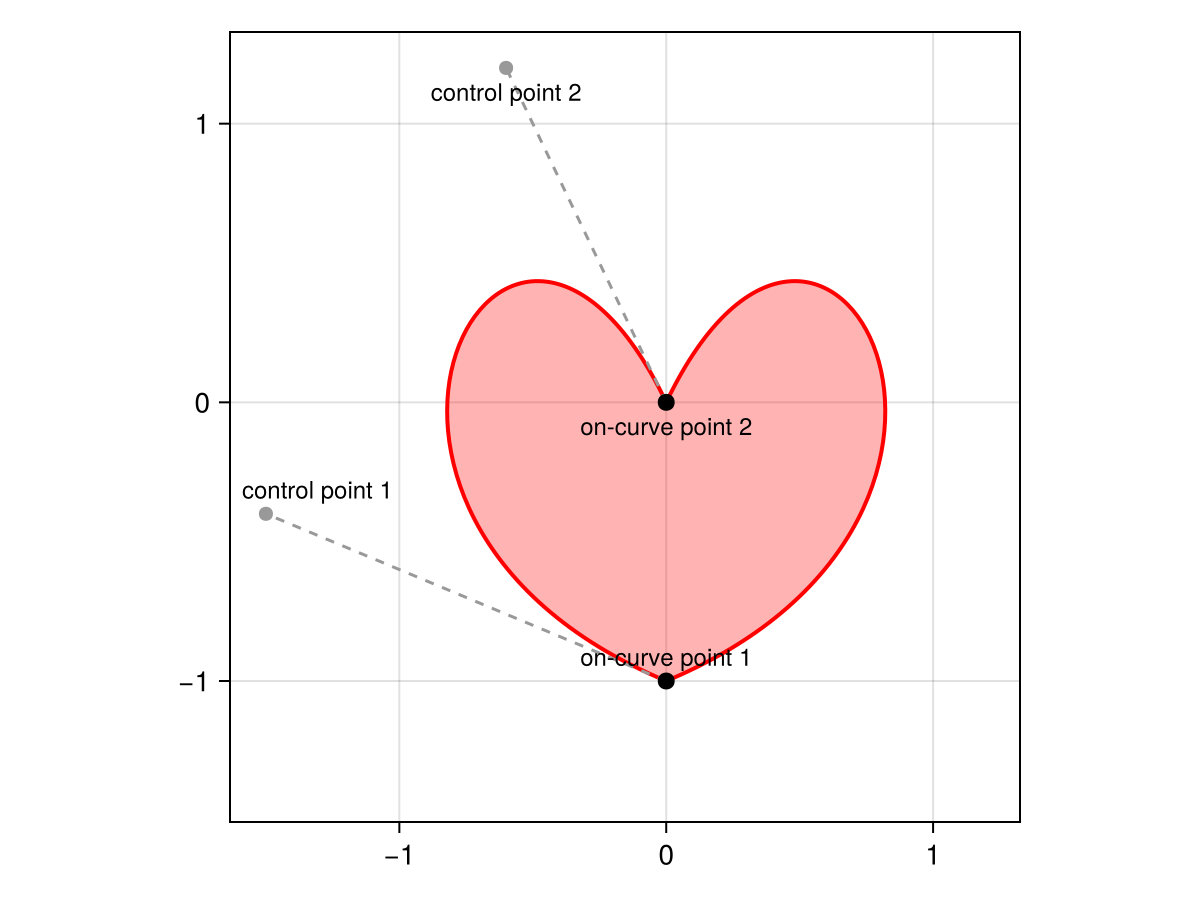
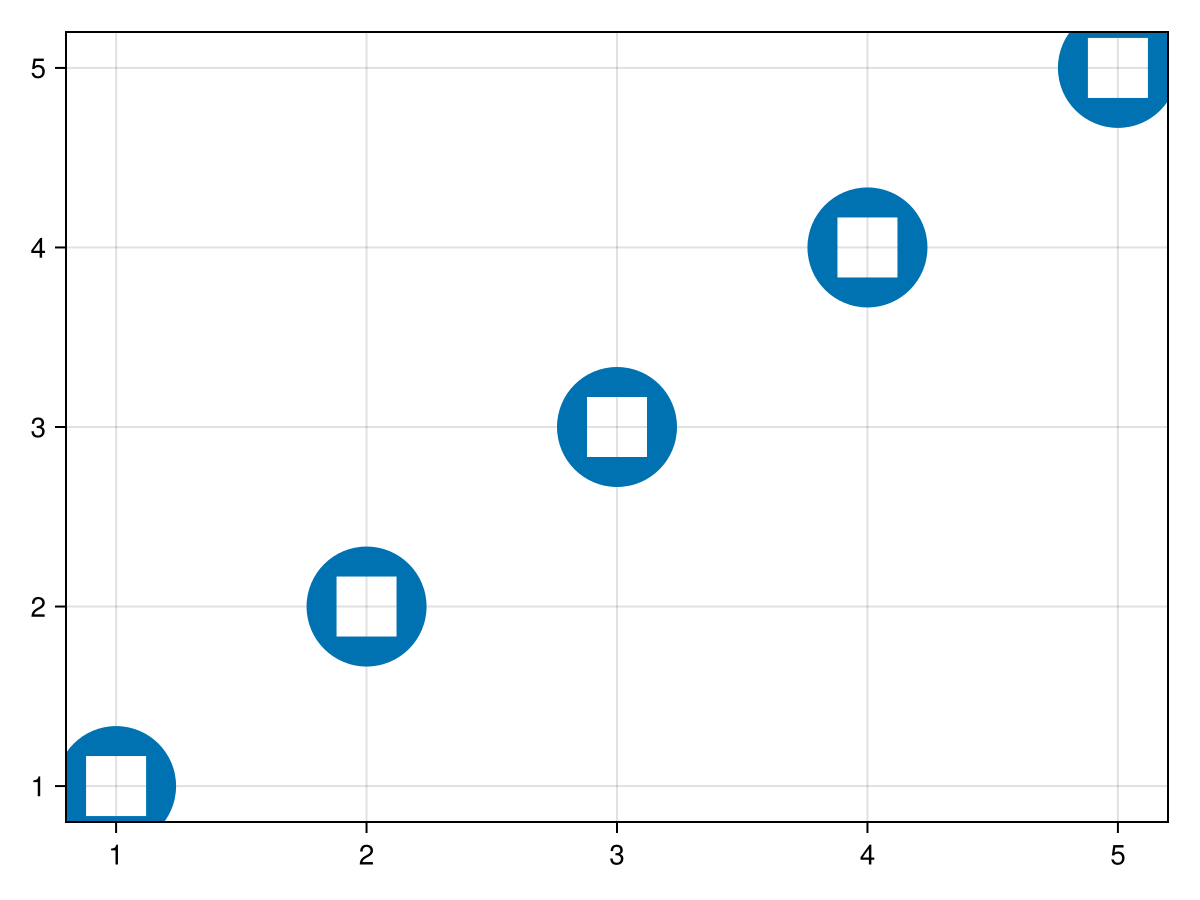
Holes
Paths can have holes, just start a new subpath with MoveTo that is inside the main path. The holes have to be in clockwise direction if the outside is in anti-clockwise direction, or vice versa. For example, a circle with a square cut out can be made by one EllipticalArc that goes anticlockwise, and a square inside which goes clockwise:
using CairoMakie
circle_with_hole = BezierPath([
    MoveTo(Point(1, 0)),
    EllipticalArc(Point(0, 0), 1, 1, 0, 0, 2pi),
    MoveTo(Point(0.5, 0.5)),
    LineTo(Point(0.5, -0.5)),
    LineTo(Point(-0.5, -0.5)),
    LineTo(Point(-0.5, 0.5)),
    ClosePath(),
])

scatter(1:5,
    marker = circle_with_hole,
    markersize = 30,
)
Construction from svg path strings
You can also create a bezier path from an svg path specification string. You can automatically resize the path and flip the y- and x-axes (svgs usually have a coordinate system where y increases downwards) with the keywords fit, flipy, and flipx. By default, the bounding box for the fitted path is a square of width 1 centered on zero. You can pass a different bounding Rect with the bbox keyword argument. By default, the aspect of the path is left intact, and if it's not matching the new bounding box, the path is centered so it fits inside. Set keep_aspect = false to squeeze the path into the bounding box, disregarding its original aspect ratio.
Here's an example with an svg string that contains the bat symbol:
using CairoMakie
batsymbol_string = "M96.84 141.998c-4.947-23.457-20.359-32.211-25.862-13.887-11.822-22.963-37.961-16.135-22.041 6.289-3.005-1.295-5.872-2.682-8.538-4.191-8.646-5.318-15.259-11.314-19.774-17.586-3.237-5.07-4.994-10.541-4.994-16.229 0-19.774 21.115-36.758 50.861-43.694.446-.078.909-.154 1.372-.231-22.657 30.039 9.386 50.985 15.258 24.645l2.528-24.367 5.086 6.52H103.205l5.07-6.52 2.543 24.367c5.842 26.278 37.746 5.502 15.414-24.429 29.777 6.951 50.891 23.936 50.891 43.709 0 15.136-12.406 28.651-31.609 37.267 14.842-21.822-10.867-28.266-22.549-5.549-5.502-18.325-21.147-9.341-26.125 13.886z"

batsymbol = BezierPath(batsymbol_string, fit = true, flipy = true)

scatter(1:10, marker = batsymbol, markersize = 50, color = :black)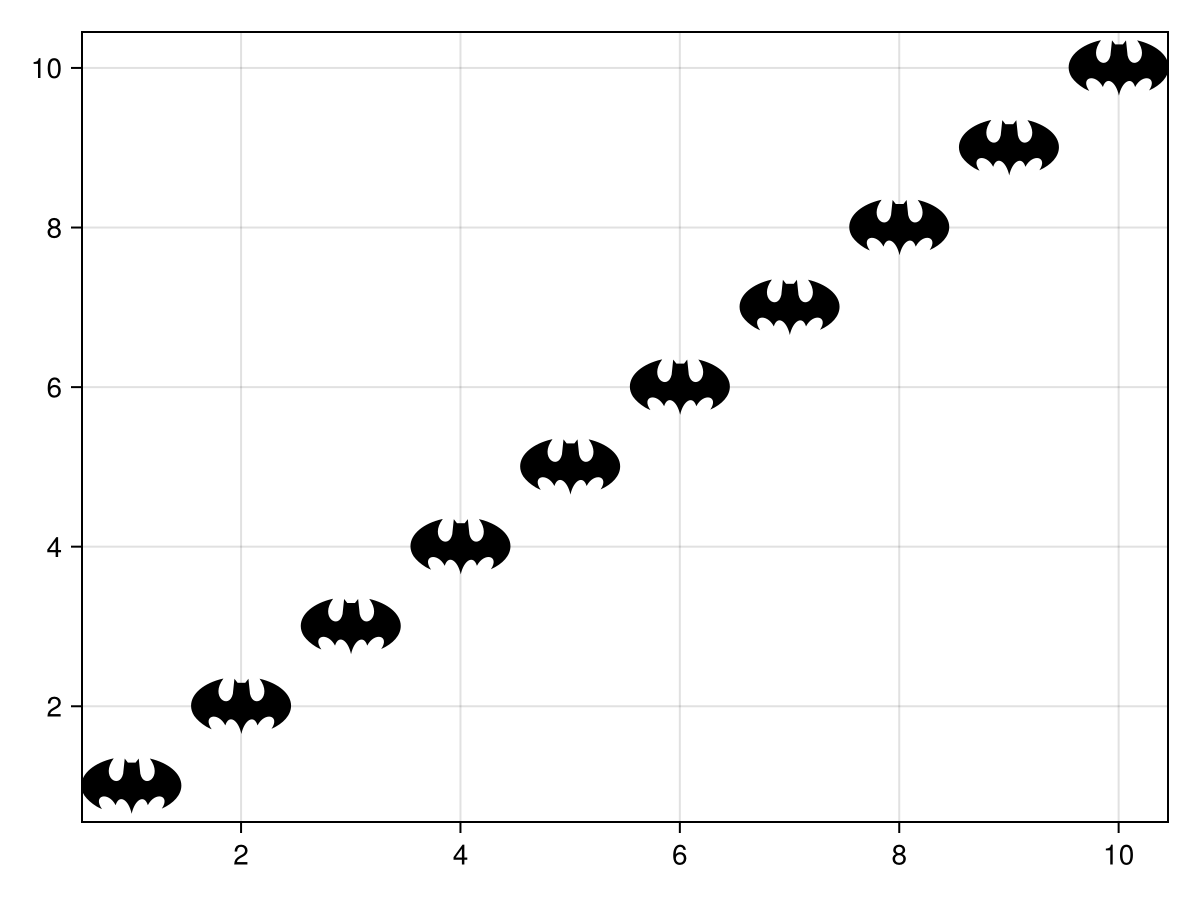
Polygon markers
One can also use GeometryBasics.Polgyon as a marker. A polygon always needs one vector of points which forms the outline. It can also take an optional vector of vectors of points, each of which forms a hole in the outlined shape.
In this example, a small circle is cut out of a larger circle:
using CairoMakie
using GeometryBasics
p_big = decompose(Point2f, Circle(Point2f(0), 1))
p_small = decompose(Point2f, Circle(Point2f(0), 0.5))
scatter(1:4, fill(0, 4), marker=Polygon(p_big, [p_small]), markersize=100, color=1:4, axis=(limits=(0, 5, -1, 1),))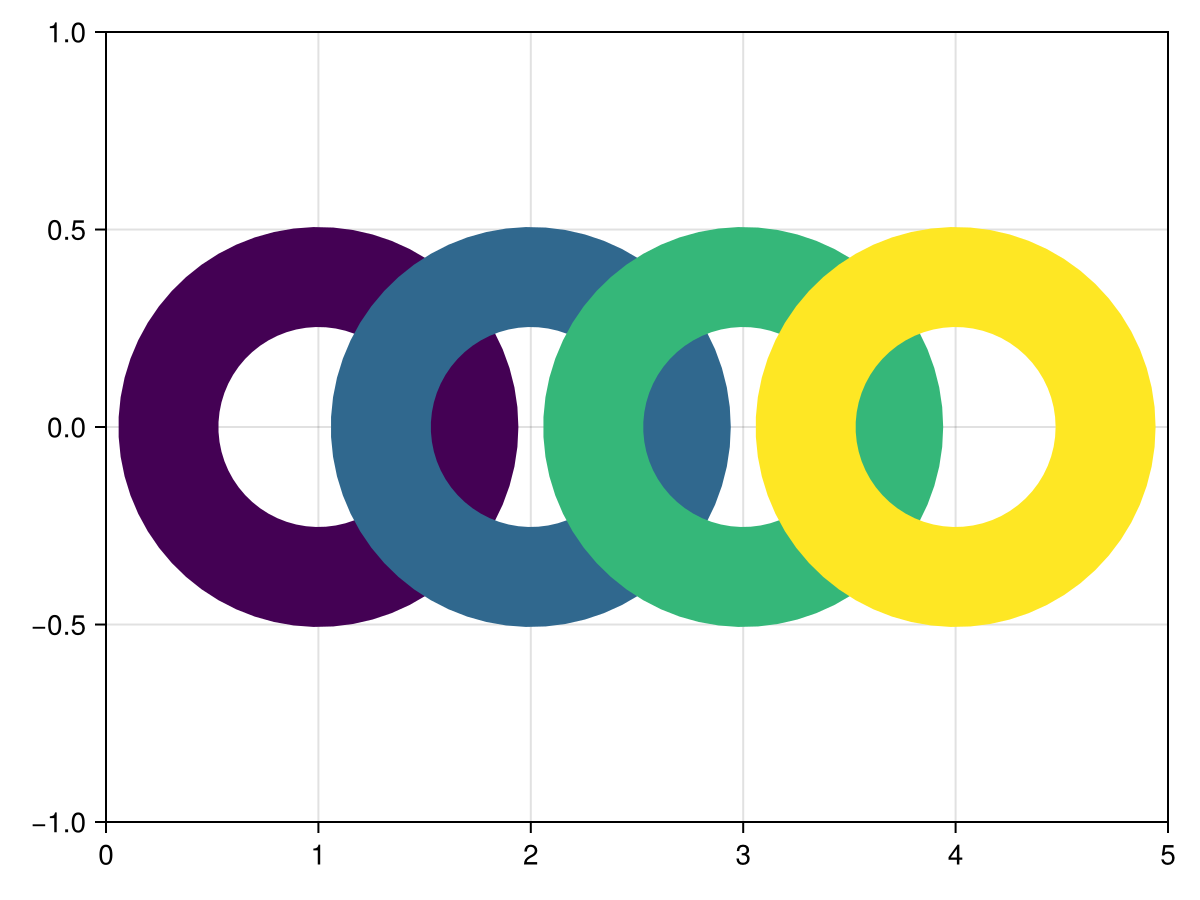
Vec markersize
You can scale x and y dimension of markers separately by passing a Vec.
using CairoMakie
f = Figure()
ax = Axis(f[1, 1])

scales = range(0.5, 1.5, length = 10)

for (i, sx) in enumerate(scales)
    for (j, sy) in enumerate(scales)
        scatter!(ax, Point2f(i, j),
            marker = '✈',
            markersize = 30 .* Vec2f(sx, sy),
            color = :black)
    end
end

f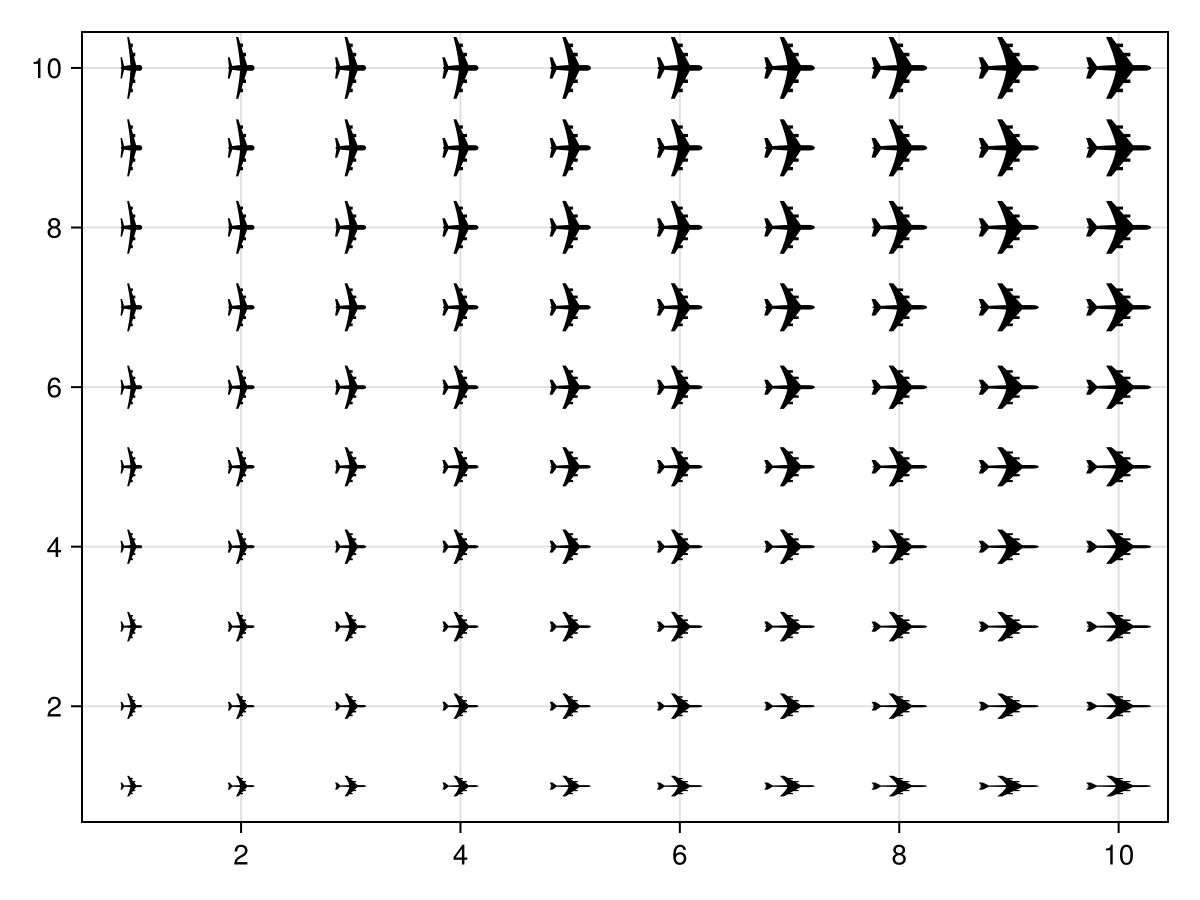
Marker space
By default marker sizes are given in pixel units. You can change this by adjusting markerspace. For example, you can have a marker scaled in data units by setting markerspace = :data.
using CairoMakie
f = Figure()
ax = Axis(f[1, 1])
limits!(ax, -10, 10, -10, 10)

scatter!(ax, Point2f(0, 0), markersize = 20, markerspace = :data,
    marker = '✈', label = "markerspace = :data")
scatter!(ax, Point2f(0, 0), markersize = 20, markerspace = :pixel,
    marker = '✈', label = "markerspace = :pixel")

axislegend(ax)

f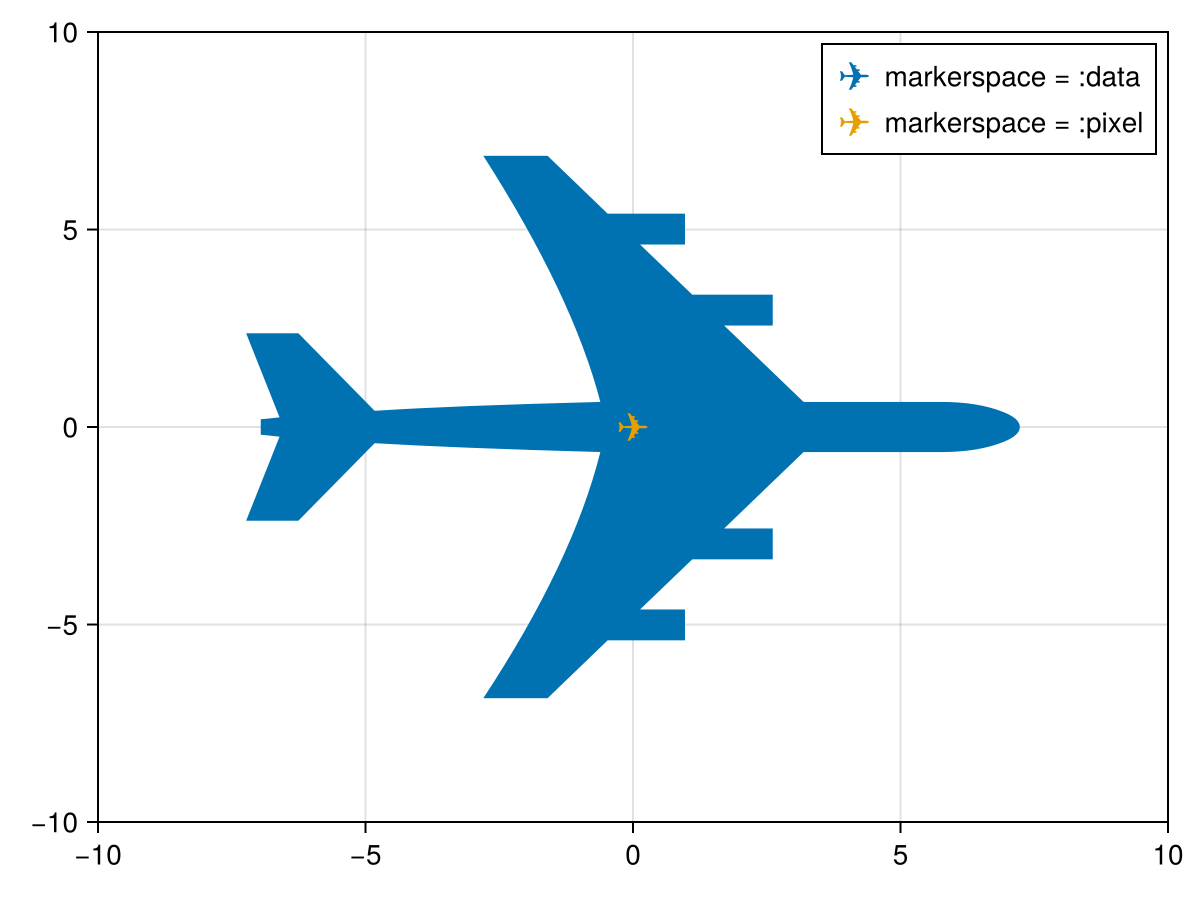
Airport locations example
using CairoMakie
using DelimitedFiles


a = readdlm(assetpath("airportlocations.csv"))

scatter(a[1:50:end, :], marker = '✈',
    markersize = 20, color = :black)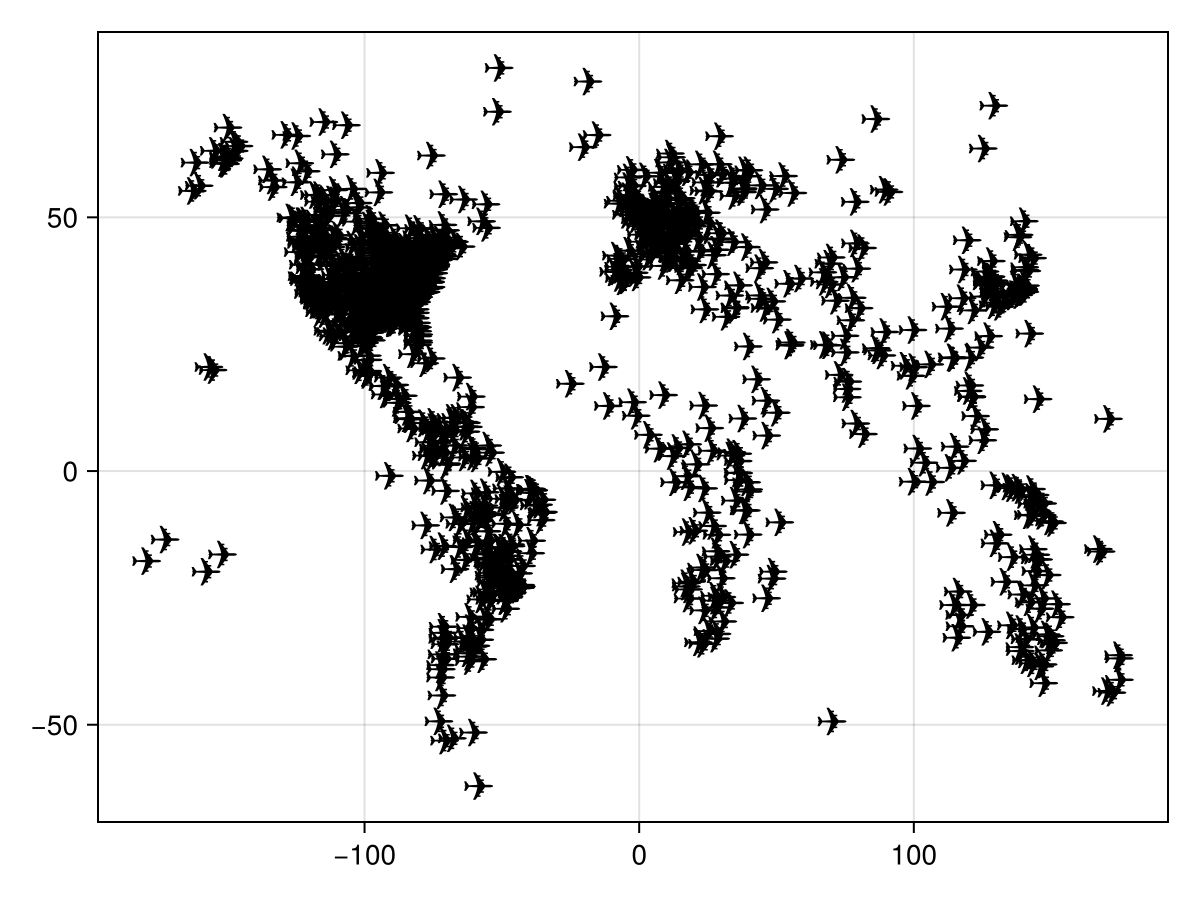
Dealing with outline artifacts in GLMakie
In GLMakie 3D scatter plots can generate outline artifacts depending on the order markers are rendered in. Currently there are a few ways to mitigate this problem, but they all come at a cost:
fxaa = truewill disable the native anti-aliasing of scatter markers and use fxaa instead. This results in less detailed markers, especially for thin markers like characters.transparency = truewill disable depth testing to a degree, resulting in all markers being rendered without artifacts. However with this markers always have some level of transparencyoverdraw = truewill disable depth testing entirely (read and write) for the plot, removing artifacts. This will however change the z-order of markers and allow plots rendered later to show up on top of the scatter plotdepthsorting = truewill sort markers by depth before rendering to fix the issue. This only works within a plot call, so when other plots are involved the issue may reappear.
using GLMakie
ps = rand(Point3f, 500)
cs = rand(500)
f = Figure(size = (900, 650))
Label(f[1, 1], "base", tellwidth = false)
scatter(f[2, 1], ps, color = cs, markersize = 20, fxaa = false)
Label(f[1, 2], "fxaa = true", tellwidth = false)
scatter(f[2, 2], ps, color = cs, markersize = 20, fxaa = true)

Label(f[3, 1], "transparency = true", tellwidth = false)
scatter(f[4, 1], ps, color = cs, markersize = 20, transparency = true)
Label(f[3, 2], "overdraw = true", tellwidth = false)
scatter(f[4, 2], ps, color = cs, markersize = 20, overdraw = true)

Label(f[1, 3], "depthsorting = true", tellwidth = false)
scatter(f[2, 3], ps, color = cs, markersize = 20, depthsorting = true)
Label(f[3, 3], "depthsorting = true", tellwidth = false)
scatter(f[4, 3], ps, color = cs, markersize = 20, depthsorting = true)
mesh!(Rect3f(Point3f(0), Vec3f(0.9, 0.9, 0.9)), color = :orange)
f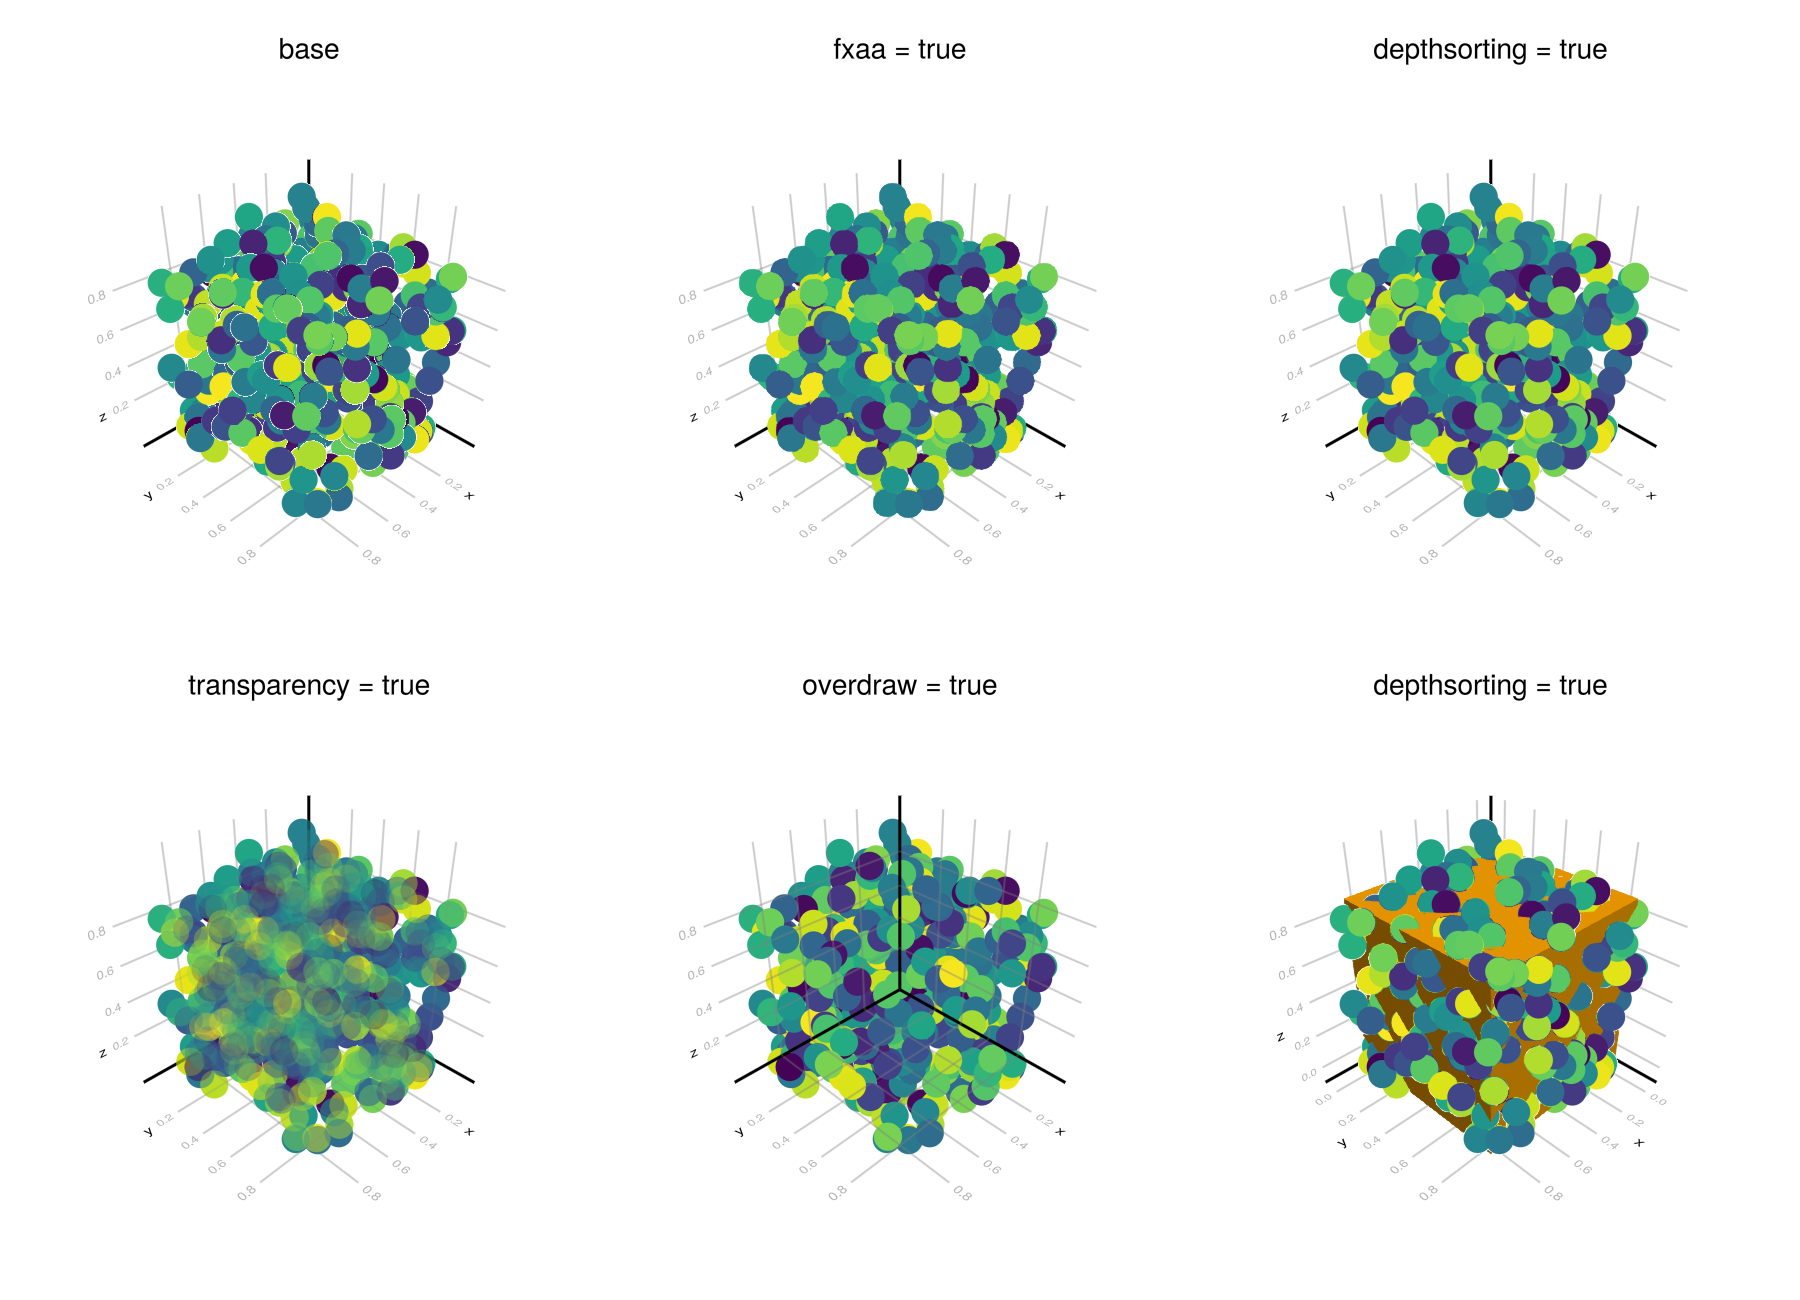
Attributes
alpha
Defaults to 1.0
The alpha value of the colormap or color attribute. Multiple alphas like in plot(alpha=0.2, color=(:red, 0.5)), will get multiplied.
clip_planes
Defaults to @inherit clip_planes automatic
Clip planes offer a way to do clipping in 3D space. You can set a Vector of up to 8 Plane3f planes here, behind which plots will be clipped (i.e. become invisible). By default clip planes are inherited from the parent plot or scene. You can remove parent clip_planes by passing Plane3f[].
color
Defaults to @inherit markercolor
Sets the color of the marker. If no color is set, multiple calls to scatter! will cycle through the axis color palette.
using CairoMakie
fig = Figure()
kwargs = (; markersize = 30, axis = (; limits = (0, 4, 0, 4)))
scatter(fig[1, 1], 1:3; kwargs..., color = :tomato)
scatter(fig[1, 2], 1:3; kwargs..., color = [RGBf(1, 0, 0), RGBf(0, 1, 0), RGBf(0, 0, 1)])
scatter(fig[2, 1], 1:3; kwargs..., color = [10, 20, 30])
scatter(fig[2, 2], 1:3; kwargs..., color = [10, 20, 30], colormap = :plasma)
fig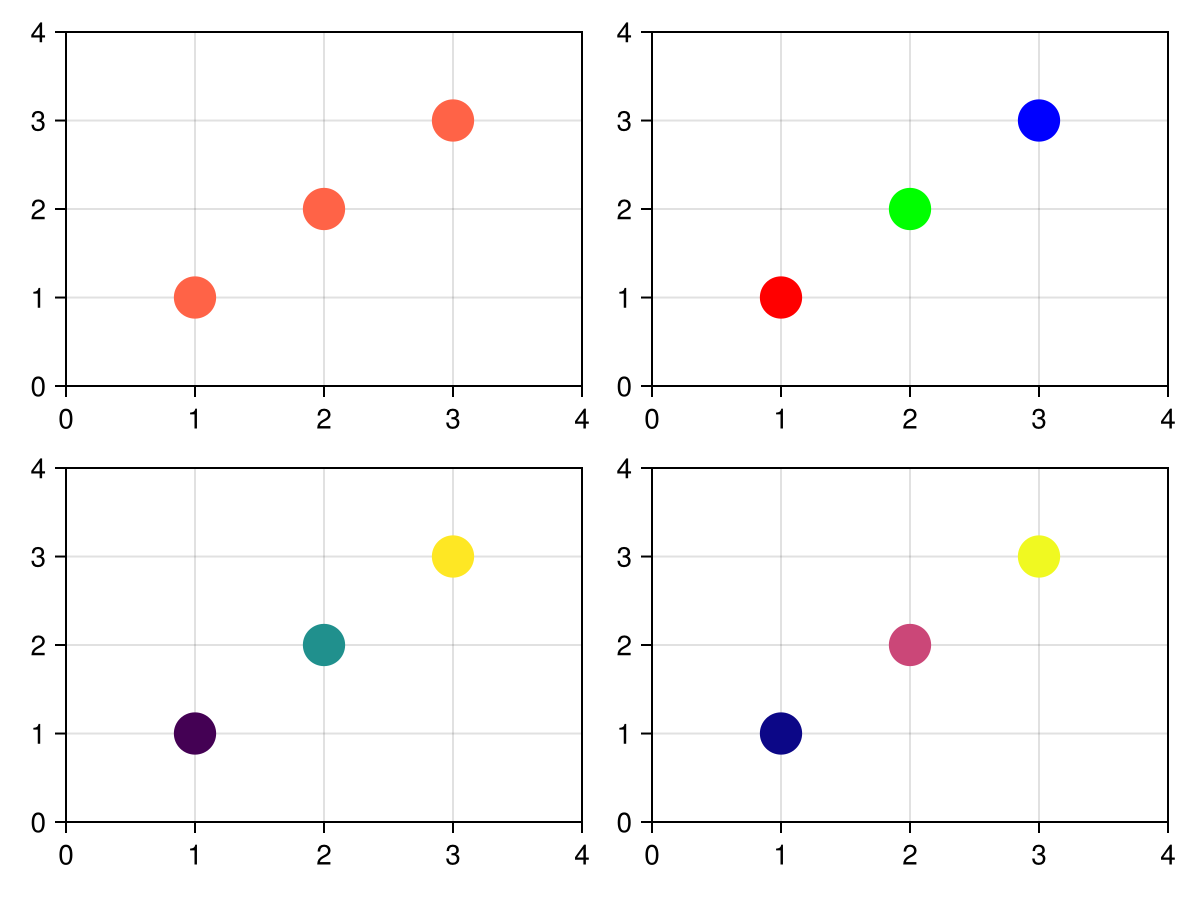
colormap
Defaults to @inherit colormap :viridis
Sets the colormap that is sampled for numeric colors. PlotUtils.cgrad(...), Makie.Reverse(any_colormap) can be used as well, or any symbol from ColorBrewer or PlotUtils. To see all available color gradients, you can call Makie.available_gradients().
using CairoMakie
fig = Figure()
kwargs = (; markersize = 30, axis = (; limits = (0, 6, 0, 6)))
scatter(fig[1, 1], 1:5; kwargs..., color = 1:5, colormap = :viridis)
scatter(fig[1, 2], 1:5; kwargs..., color = 1:5, colormap = :plasma)
scatter(fig[2, 1], 1:5; kwargs..., color = 1:5, colormap = Reverse(:viridis))
scatter(fig[2, 2], 1:5; kwargs..., color = 1:5, colormap = [:tomato, :slategray2])
fig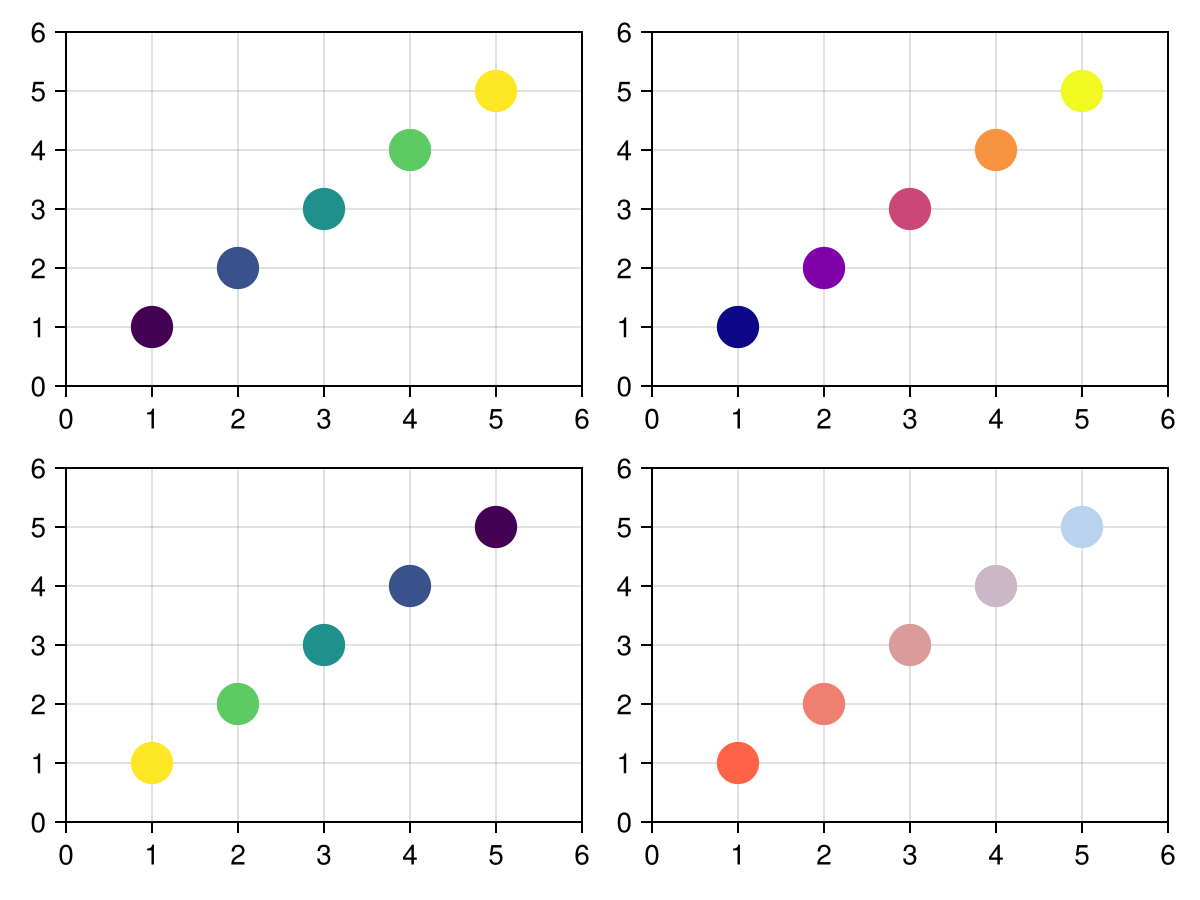
colorrange
Defaults to automatic
The values representing the start and end points of colormap.
colorscale
Defaults to identity
The color transform function. Can be any function, but only works well together with Colorbar for identity, log, log2, log10, sqrt, logit, Makie.pseudolog10, Makie.Symlog10, Makie.AsinhScale, Makie.SinhScale, Makie.LogScale, Makie.LuptonAsinhScale, and Makie.PowerScale.
cycle
Defaults to [:color]
Sets which attributes to cycle when creating multiple plots. The values to cycle through are defined by the parent Theme. Multiple cycled attributes can be set by passing a vector. Elements can
directly refer to a cycled attribute, e.g.
:colormap a cycled attribute to a palette attribute, e.g.
:linecolor => :colormap multiple cycled attributes to a palette attribute, e.g.
[:linecolor, :markercolor] => :color
depth_shift
Defaults to 0.0
Adjusts the depth value of a plot after all other transformations, i.e. in clip space, where -1 <= depth <= 1. This only applies to GLMakie and WGLMakie and can be used to adjust render order (like a tunable overdraw).
depthsorting
Defaults to false
Enables depth-sorting of markers which can improve border artifacts. Currently supported in GLMakie only.
distancefield
Defaults to nothing
Optional distancefield used for e.g. font and bezier path rendering. Will get set automatically.
font
Defaults to "default"
Sets the font to be used for character markers
fxaa
Defaults to false
Adjusts whether the plot is rendered with fxaa (fast approximate anti-aliasing, GLMakie only). Note that some plots implement a better native anti-aliasing solution (scatter, text, lines). For them fxaa = true generally lowers quality. Plots that show smoothly interpolated data (e.g. image, surface) may also degrade in quality as fxaa = true can cause blurring.
glowcolor
Defaults to (:black, 0.0)
Sets the color of the glow effect around the marker.
glowwidth
Defaults to 0.0
Sets the size of a glow effect around the marker.
highclip
Defaults to automatic
The color for any value above the colorrange.
inspectable
Defaults to @inherit inspectable
Sets whether this plot should be seen by DataInspector. The default depends on the theme of the parent scene.
inspector_clear
Defaults to automatic
Sets a callback function (inspector, plot) -> ... for cleaning up custom indicators in DataInspector.
inspector_hover
Defaults to automatic
Sets a callback function (inspector, plot, index) -> ... which replaces the default show_data methods.
inspector_label
Defaults to automatic
Sets a callback function (plot, index, position) -> string which replaces the default label generated by DataInspector.
lowclip
Defaults to automatic
The color for any value below the colorrange.
marker
Defaults to @inherit marker
Sets the scatter marker.
marker_offset
Defaults to Vec3f(0)
The offset of the marker from the given position in markerspace units. An offset of 0 corresponds to a centered marker.
using CairoMakie
fig = Figure()
scatter(fig[1, 1], [Point2f(0) for _ in 1:5]; marker = Circle, markersize = 30,
    marker_offset = [(0, 0), (-50, 0), (0, -50), (50, 0), (0, 50)],
    color = [:black, :blue, :green, :red, :orange])
scatter(fig[1, 2], [Point3f(0) for _ in 1:7]; marker = :ltriangle, markersize = 0.2, markerspace = :data,
    marker_offset = Vec3f[(0, 0, 0), (-1, 0, 0), (0, -1, 0), (1, 0, 0), (0, 1, 0), (0, 0, -1), (0, 0, 1)],
    color = [:black, :blue, :green, :red, :orange, :cyan, :purple])
fig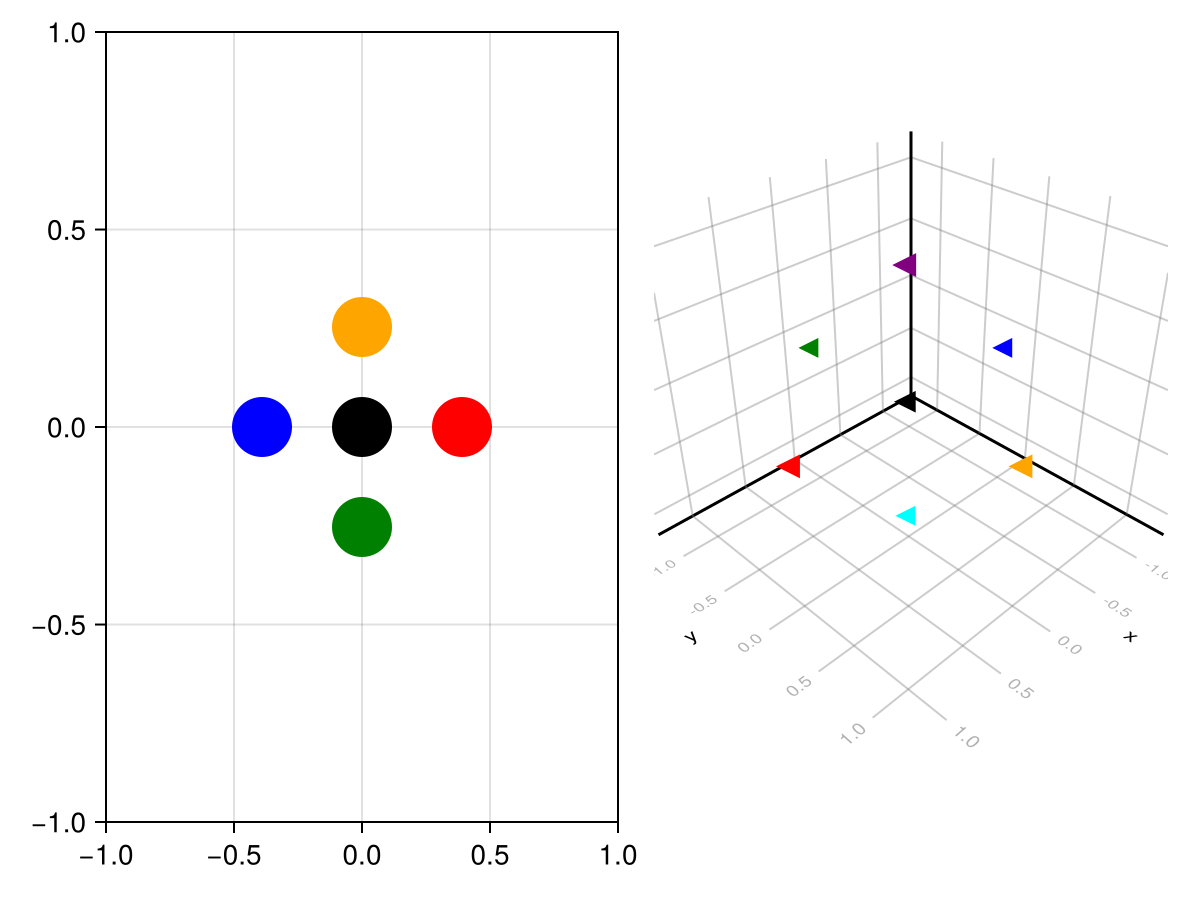
markersize
Defaults to @inherit markersize
Sets the size of the marker by scaling it relative to its base size which can differ for each marker. A Real scales x and y dimensions by the same amount. A Vec or Tuple with two elements scales x and y separately. An array of either scales each marker separately. Humans perceive the area of a marker as its size which grows quadratically with markersize, so multiplying markersize by 2 results in a marker that is 4 times as large, visually.
using CairoMakie
fig = Figure()
kwargs = (; marker = Rect, axis = (; limits = (0, 4, 0, 4)))
scatter(fig[1, 1], 1:3; kwargs..., markersize = 30)
scatter(fig[1, 2], 1:3; kwargs..., markersize = (30, 20))
scatter(fig[2, 1], 1:3; kwargs..., markersize = [10, 20, 30])
scatter(fig[2, 2], 1:3; kwargs..., markersize = [(10, 20), (20, 30), (40, 30)])
fig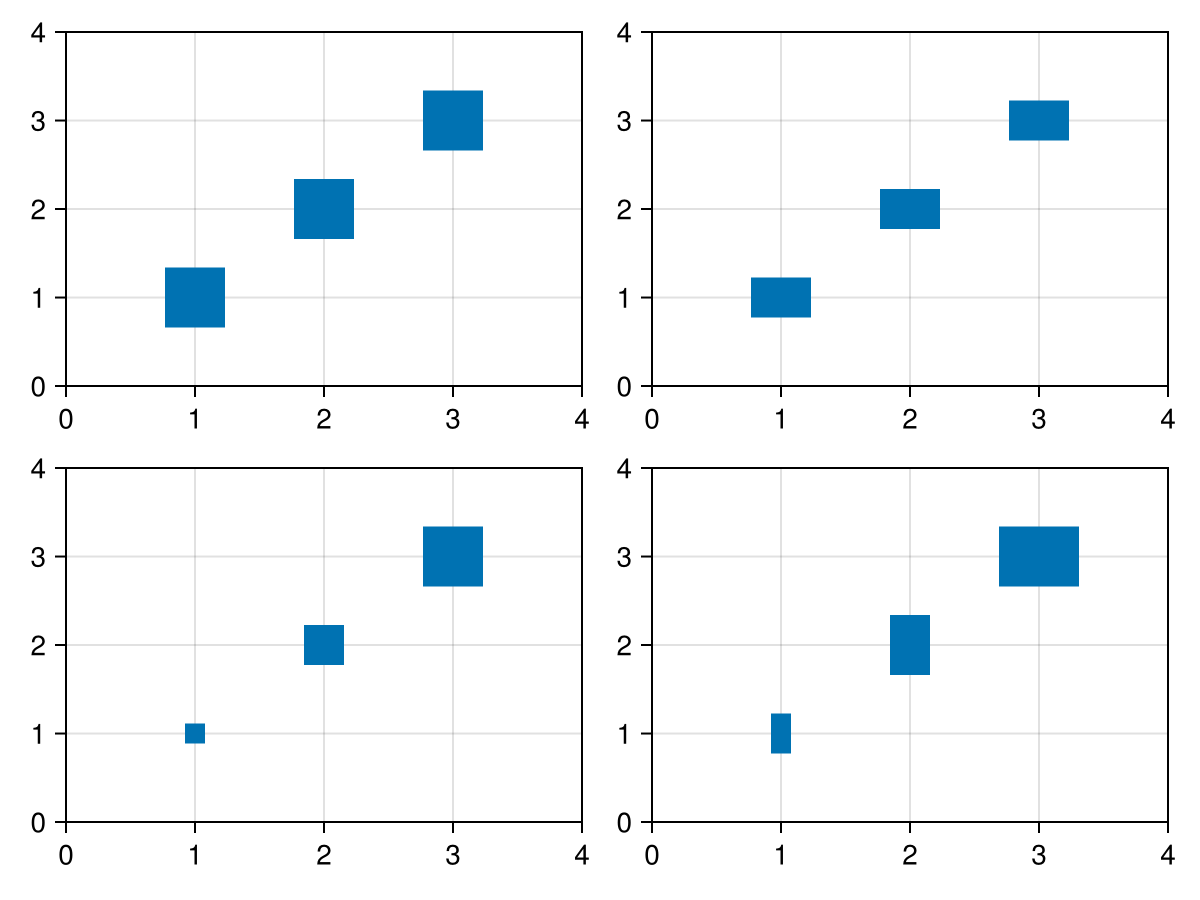
markerspace
Defaults to :pixel
Sets the space in which markersize is given. See Makie.spaces() for possible inputs
model
Defaults to automatic
Sets a model matrix for the plot. This overrides adjustments made with translate!, rotate! and scale!.
nan_color
Defaults to :transparent
The color for NaN values.
overdraw
Defaults to false
Controls if the plot will draw over other plots. This specifically means ignoring depth checks in GL backends
rotation
Defaults to Billboard()
Sets the rotation of the marker. A Billboard rotation is always around the depth axis.
using CairoMakie
fig = Figure()
kwargs = (; marker = :utriangle, markersize = 30, axis = (; limits = (0, 4, 0, 4)))
scatter(fig[1, 1], 1:3; kwargs...)
scatter(fig[1, 2], 1:3; kwargs..., rotation = deg2rad(45))
scatter(fig[1, 3], 1:3; kwargs..., rotation = deg2rad.([0, 45, 90]))
fig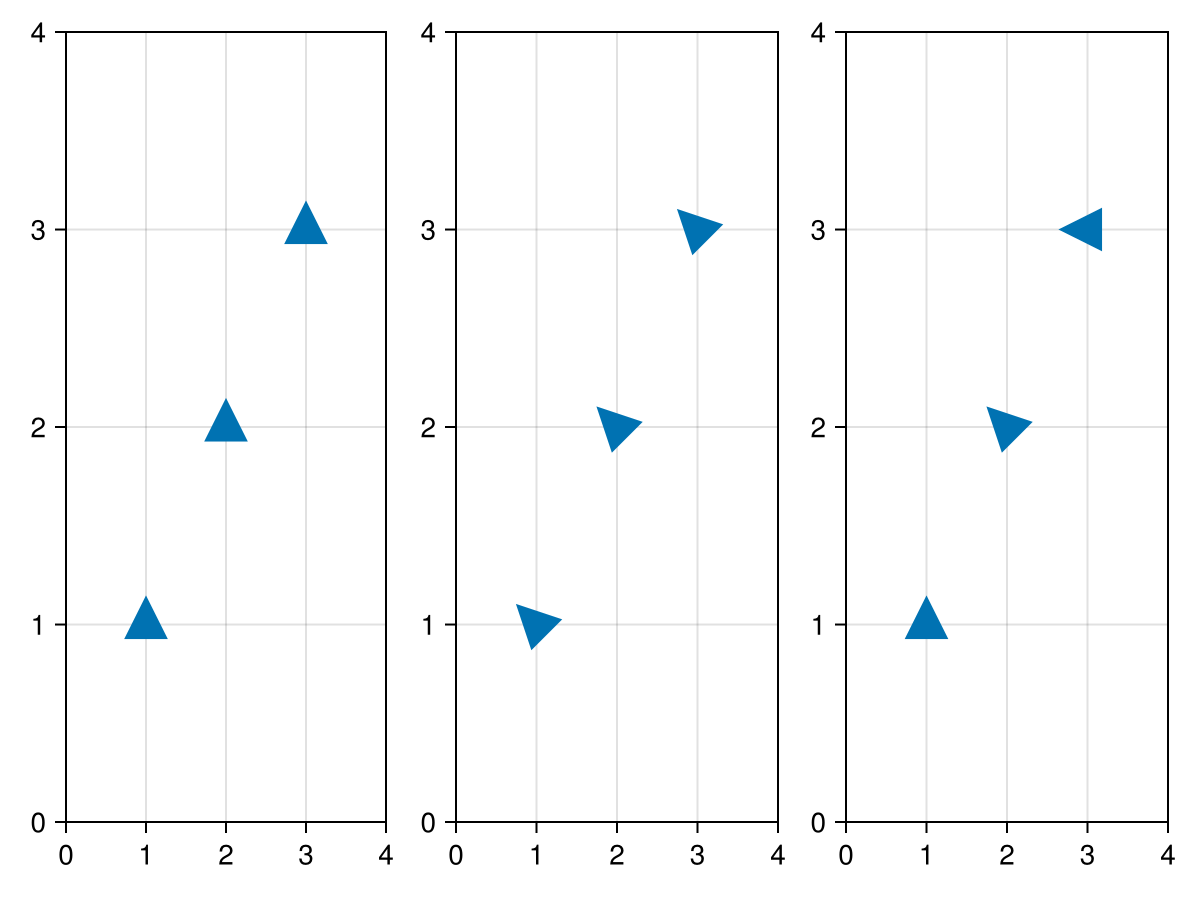
space
Defaults to :data
Sets the transformation space for box encompassing the plot. See Makie.spaces() for possible inputs.
ssao
Defaults to false
Adjusts whether the plot is rendered with ssao (screen space ambient occlusion). Note that this only makes sense in 3D plots and is only applicable with fxaa = true.
strokecolor
Defaults to @inherit markerstrokecolor
Sets the color of the outline around a marker.
using CairoMakie
fig = Figure()
kwargs = (; markersize = 30, strokewidth = 3)
scatter(fig[1, 1], 1:3; kwargs..., strokecolor = :tomato)
scatter(fig[1, 2], 1:3; kwargs..., strokecolor = [RGBf(1, 0, 0), RGBf(0, 1, 0), RGBf(0, 0, 1)])
fig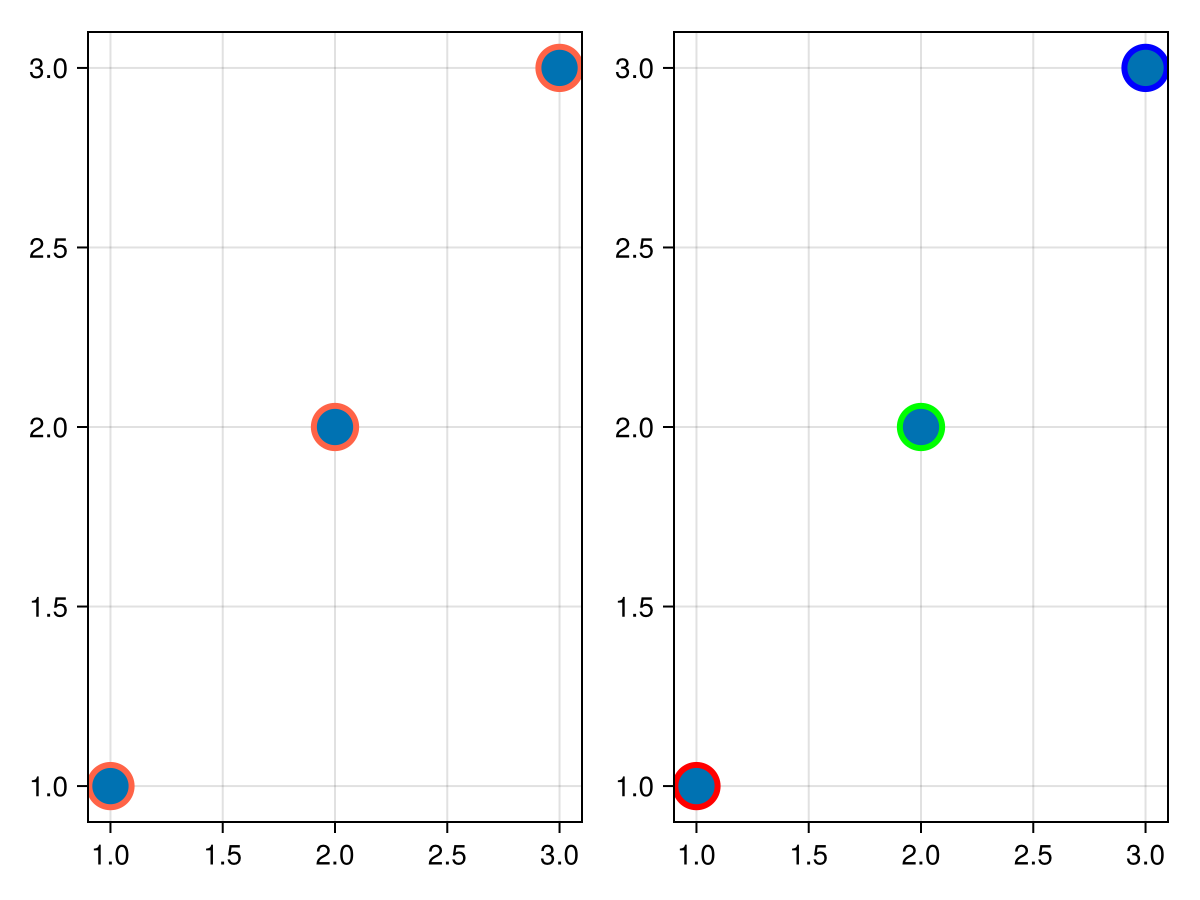
strokewidth
Defaults to @inherit markerstrokewidth
Sets the width of the outline around a marker.
using CairoMakie
fig = Figure()
kwargs = (; markersize = 30, strokecolor = :tomato)
scatter(fig[1, 1], 1:3; kwargs..., strokewidth = 3)
scatter(fig[1, 2], 1:3; kwargs..., strokewidth = [0, 3, 6])
fig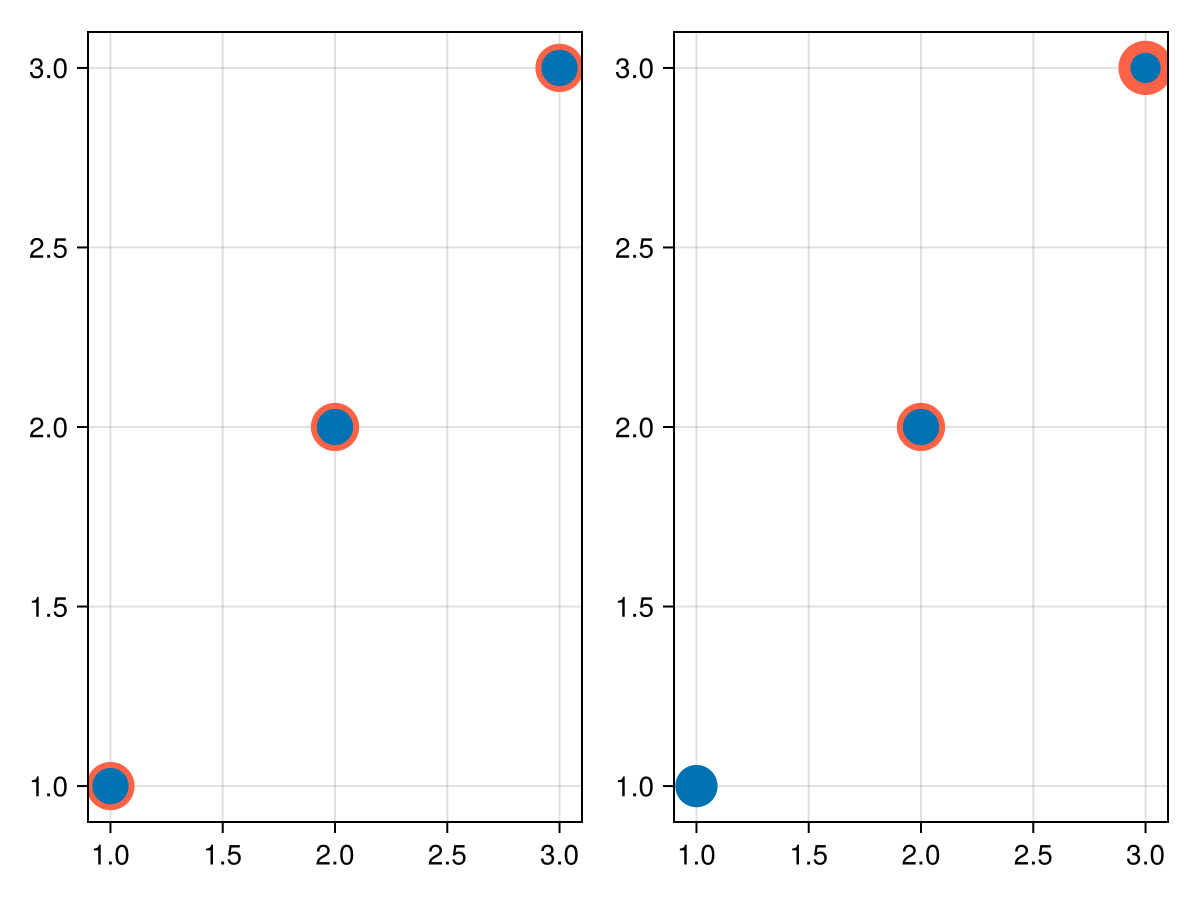
transform_marker
Defaults to false
Controls whether the model matrix (without translation) applies to the marker itself, rather than just the positions. (If this is true, scale! and rotate! will affect the marker.
transformation
Defaults to :automatic
Controls the inheritance or directly sets the transformations of a plot. Transformations include the transform function and model matrix as generated by translate!(...), scale!(...) and rotate!(...). They can be set directly by passing a Transformation() object or inherited from the parent plot or scene. Inheritance options include:
:automatic: Inherit transformations if the parent and childspaceis compatible:inherit: Inherit transformations:inherit_model: Inherit only model transformations:inherit_transform_func: Inherit only the transform function:nothing: Inherit neither, fully disconnecting the child's transformations from the parent
Another option is to pass arguments to the transform!() function which then get applied to the plot. For example transformation = (:xz, 1.0) which rotates the xy plane to the xz plane and translates by 1.0. For this inheritance defaults to :automatic but can also be set through e.g. (:nothing, (:xz, 1.0)).
transparency
Defaults to false
Adjusts how the plot deals with transparency. In GLMakie transparency = true results in using Order Independent Transparency.
visible
Defaults to true
Controls whether the plot gets rendered or not.