hexbin
Makie.hexbin Function
hexbin(xs, ys; kwargs...)Plots a heatmap with hexagonal bins for the observations xs and ys.
Plot type
The plot type alias for the hexbin function is Hexbin.
Examples
Setting the number of bins
Setting bins to an integer sets the number of bins to this value for both x and y. The minimum number of bins in one dimension is 2.
using CairoMakie
using Random
Random.seed!(1234)

f = Figure(size = (800, 800))

x = rand(300)
y = rand(300)

for i in 2:5
    ax = Axis(f[fldmod1(i-1, 2)...], title = "bins = $i", aspect = DataAspect())
    hexbin!(ax, x, y, bins = i)
    wireframe!(ax, Rect2f(Point2f.(x, y)), color = :red)
    scatter!(ax, x, y, color = :red, markersize = 5)
end

f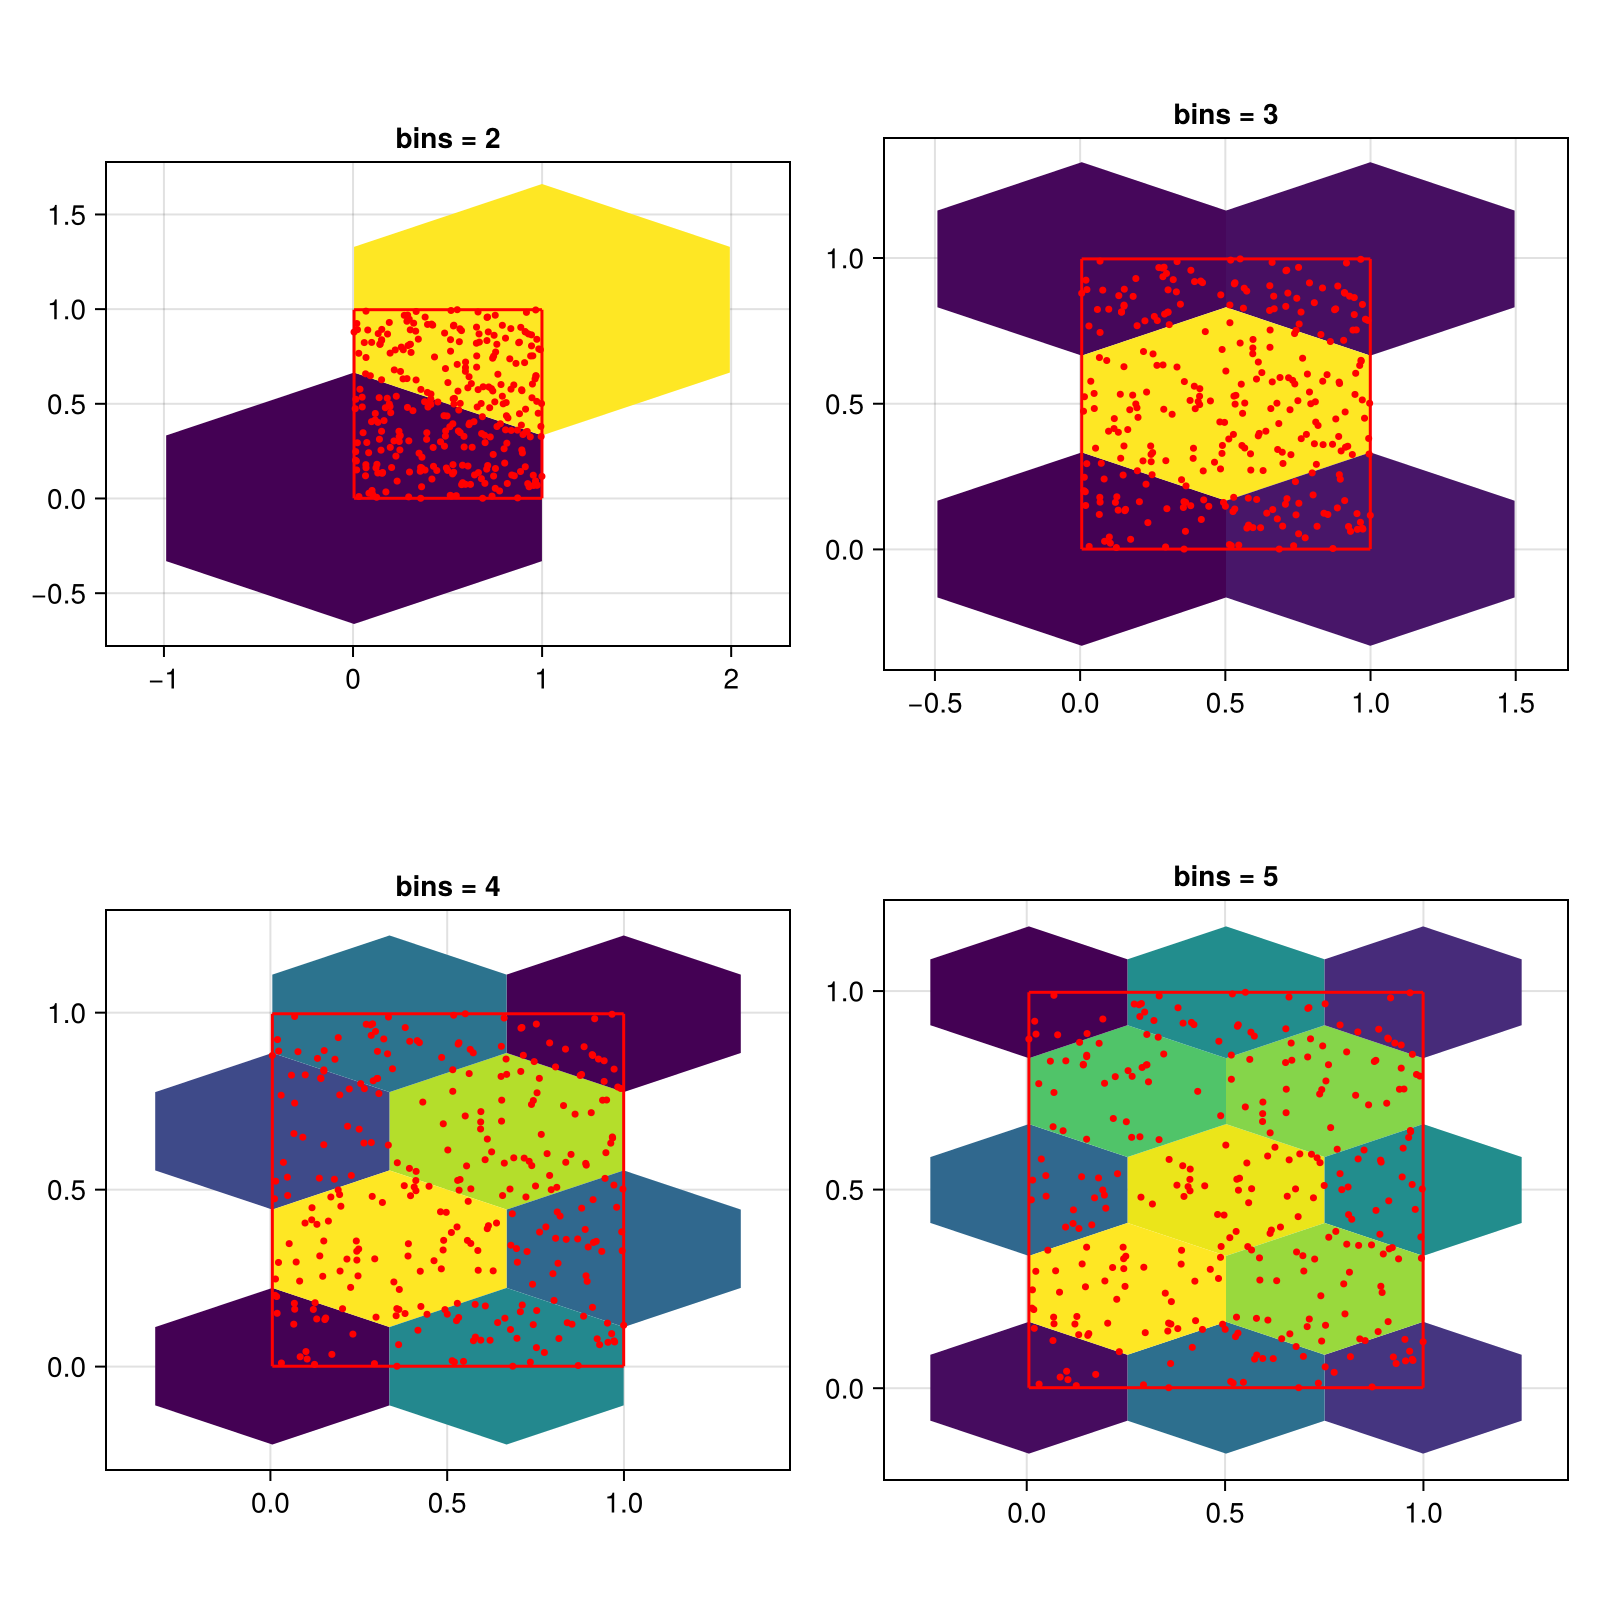
You can also pass a tuple of integers to control x and y separately.
using CairoMakie
using Random
Random.seed!(1234)

f = Figure(size = (800, 800))

x = rand(300)
y = rand(300)

for i in 2:5
    ax = Axis(f[fldmod1(i-1, 2)...], title = "bins = (3, $i)", aspect = DataAspect())
    hexbin!(ax, x, y, bins = (3, i))
    wireframe!(ax, Rect2f(Point2f.(x, y)), color = :red)
    scatter!(ax, x, y, color = :red, markersize = 5)
end

f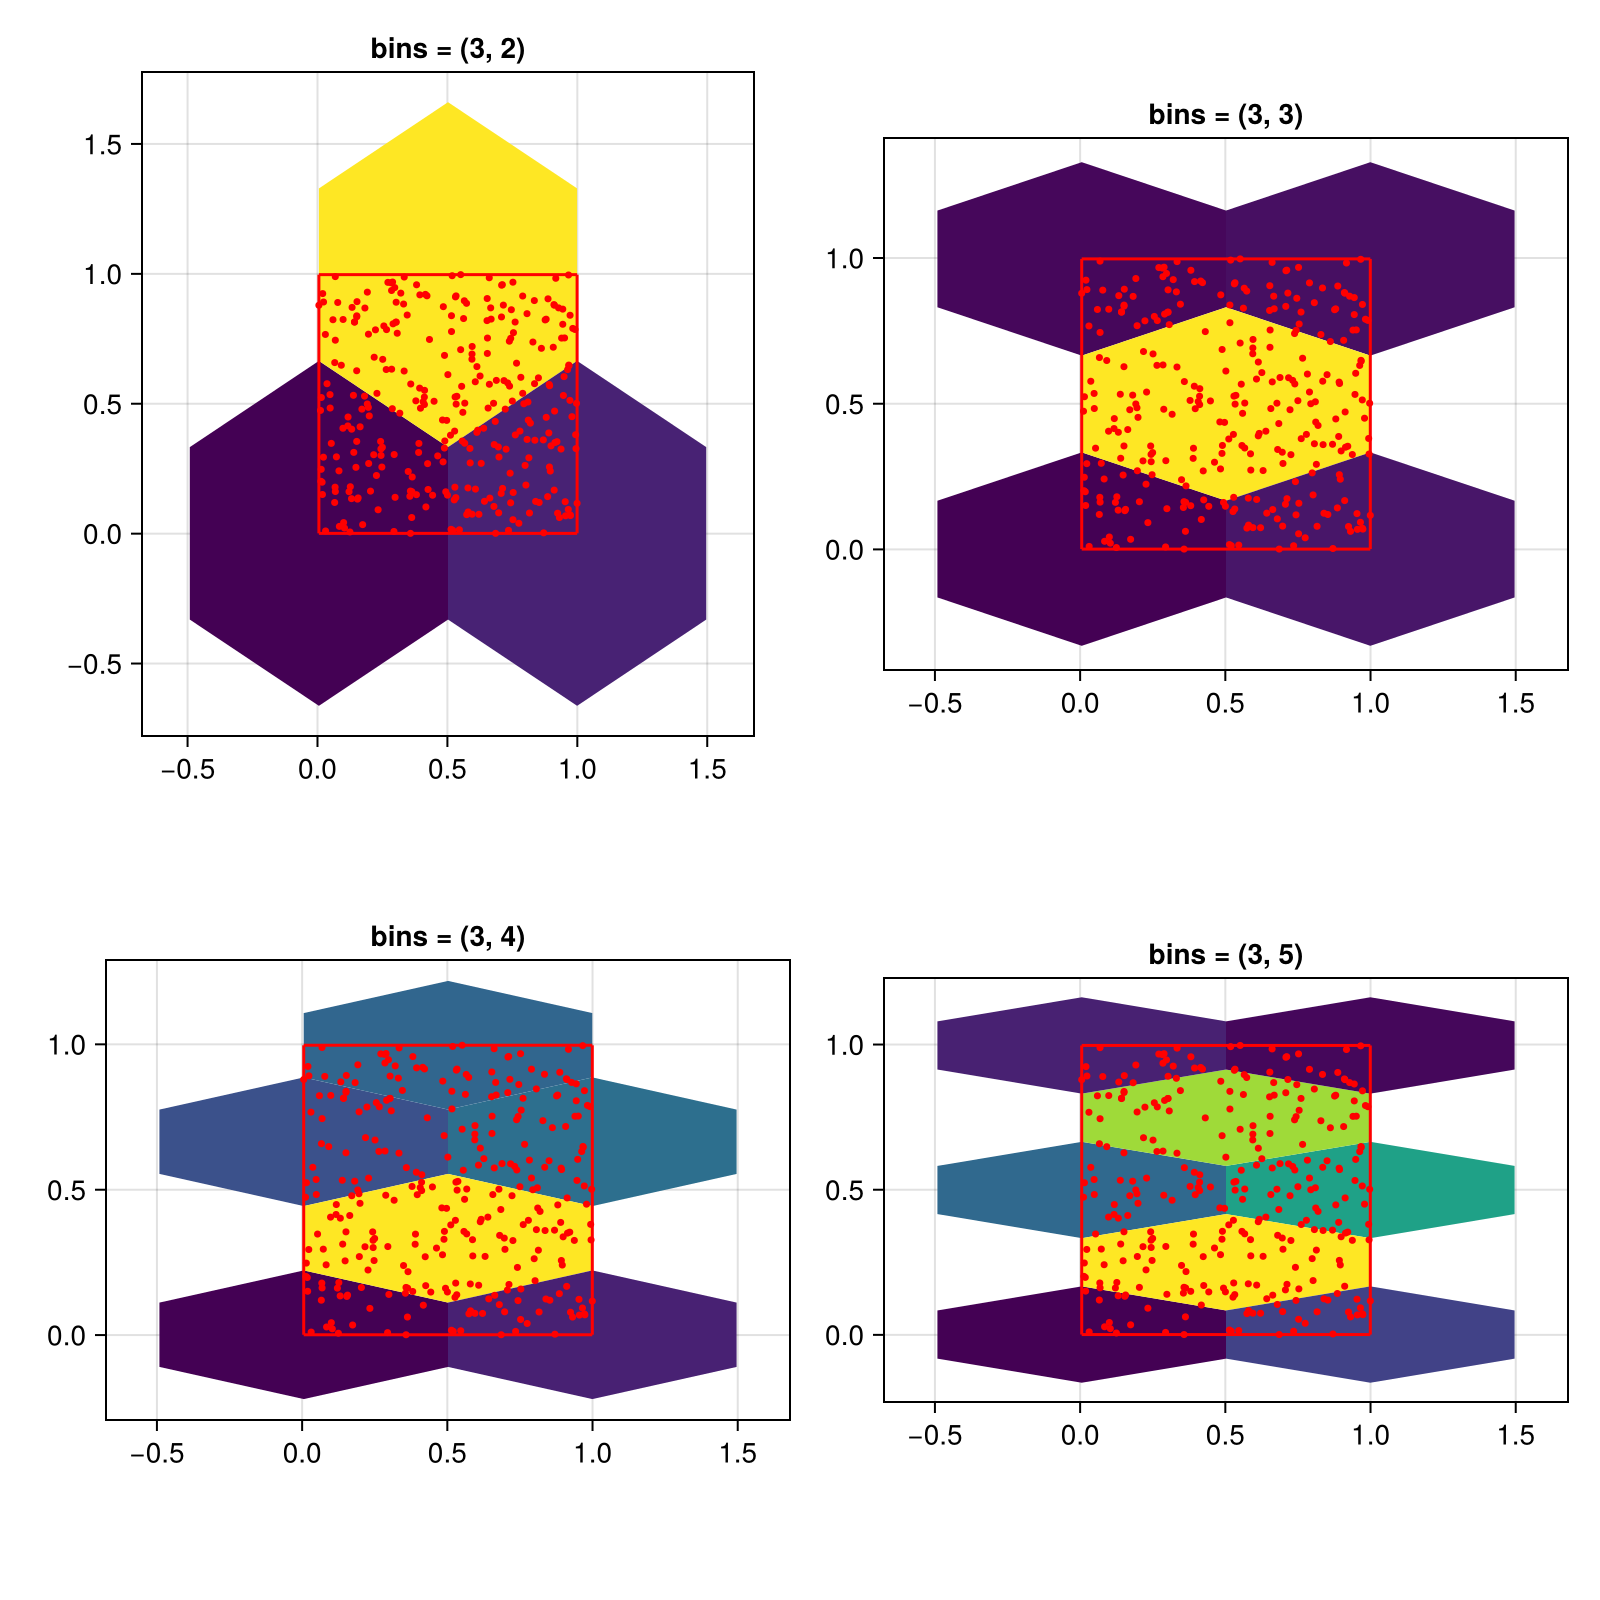
Setting the size of cells
You can also control the cell size directly by setting the cellsize keyword. In this case, the bins setting is ignored.
The height of a hexagon is larger than its width. This is why setting the same size for x and y will result in uneven hexagons.
using CairoMakie
using Random
Random.seed!(1234)

f = Figure(size = (800, 800))

x = rand(300)
y = rand(300)

for (i, cellsize) in enumerate([0.1, 0.15, 0.2, 0.25])
    ax = Axis(f[fldmod1(i, 2)...], title = "cellsize = ($cellsize, $cellsize)", aspect = DataAspect())
    hexbin!(ax, x, y, cellsize = (cellsize, cellsize))
    wireframe!(ax, Rect2f(Point2f.(x, y)), color = :red)
    scatter!(ax, x, y, color = :red, markersize = 5)
end

f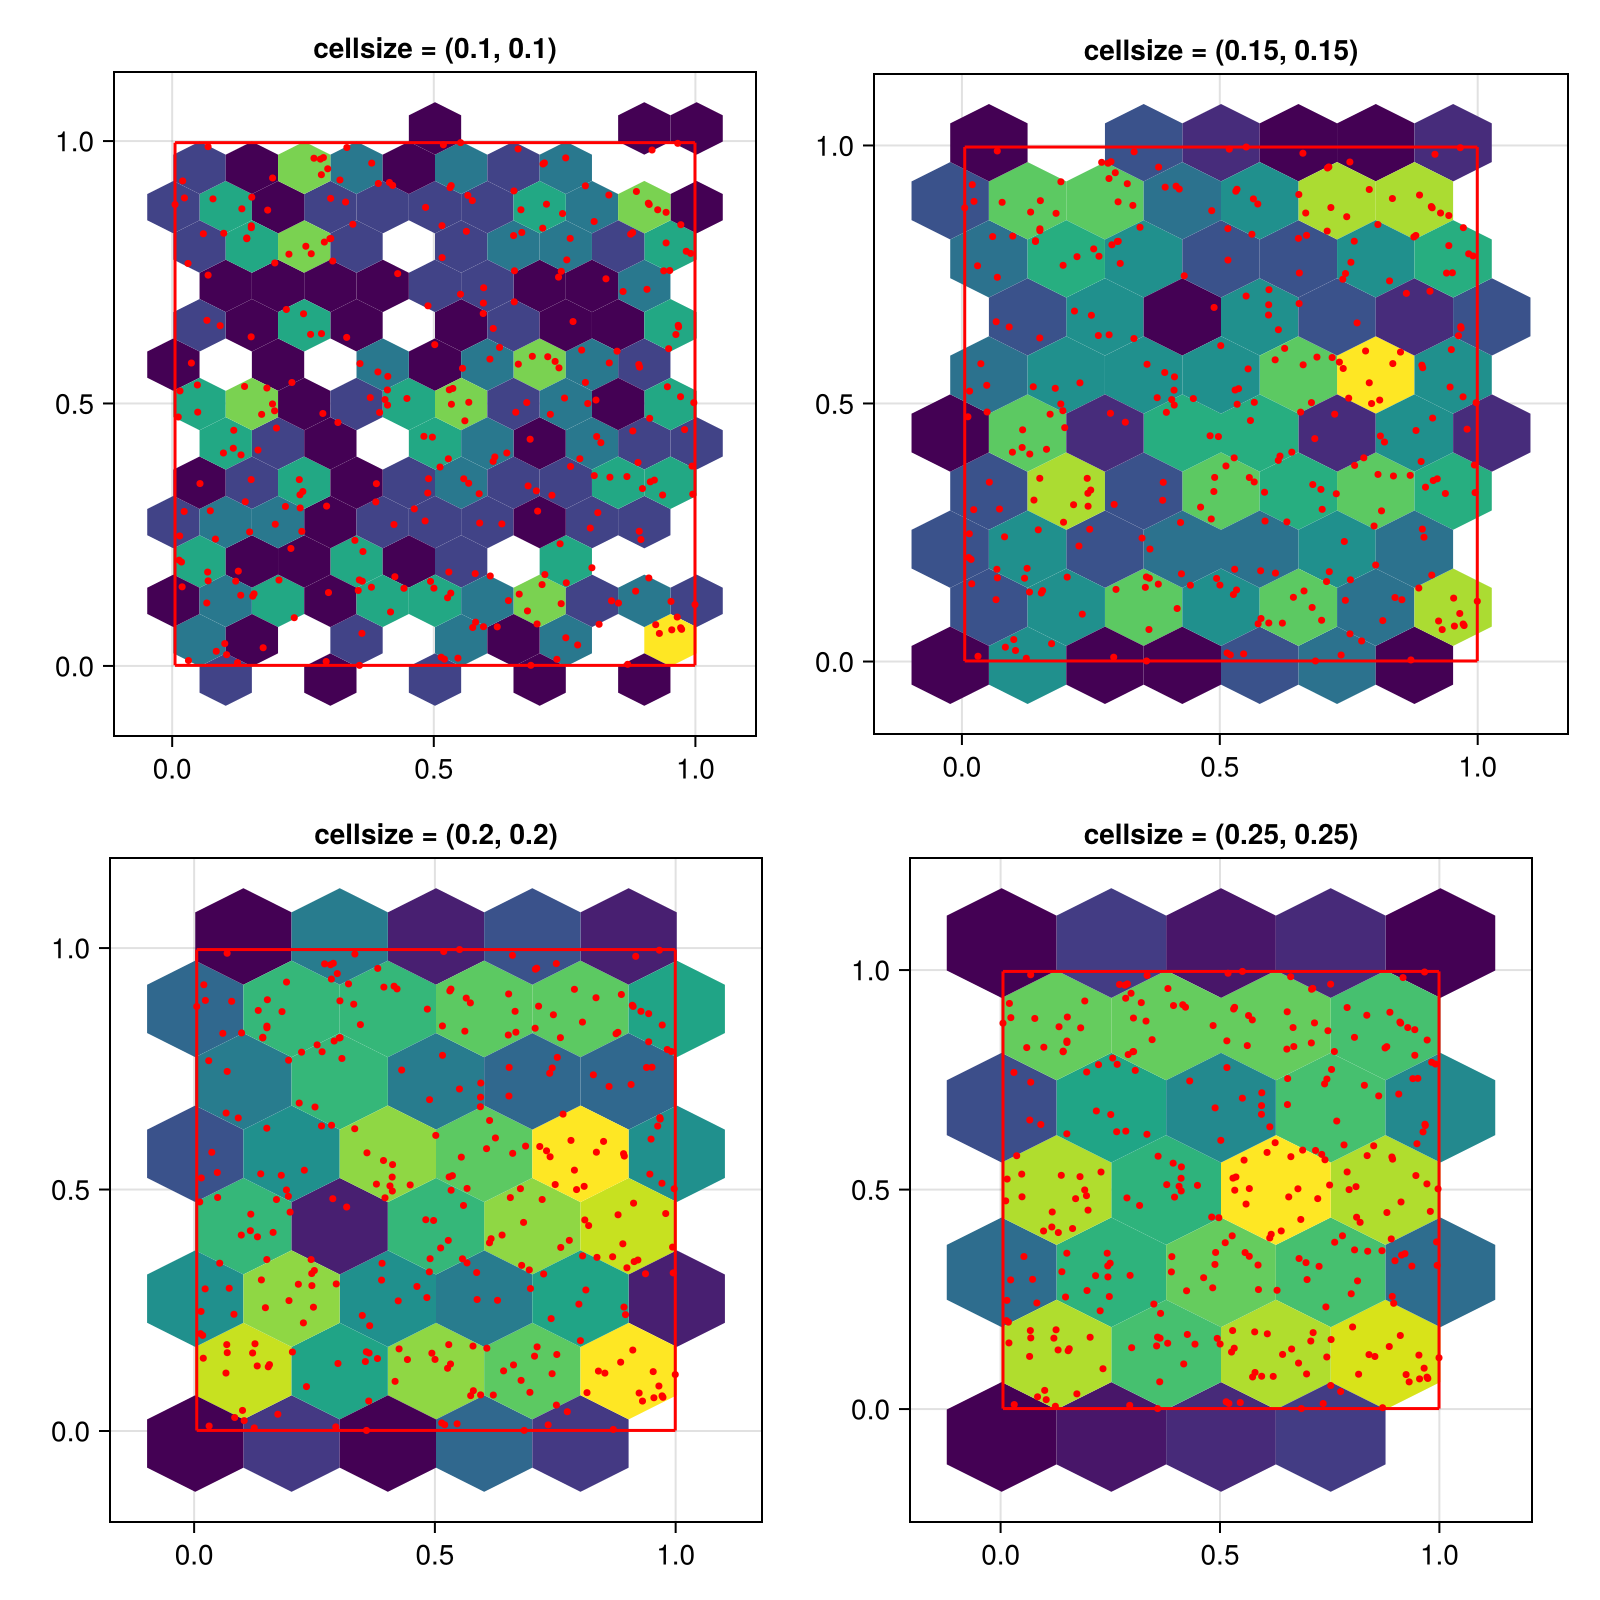
To get evenly sized hexagons, set the cell size to a single number. This number defines the cell width, the height will be computed as 2 * step_x / sqrt(3). Note that the visual appearance of the hexagons will only be even if the x and y axis have the same scaling, which is why we use aspect = DataAspect() in these examples.
using CairoMakie
using Random
Random.seed!(1234)

f = Figure(size = (800, 800))

x = rand(300)
y = rand(300)

for (i, cellsize) in enumerate([0.1, 0.15, 0.2, 0.25])
    ax = Axis(f[fldmod1(i, 2)...], title = "cellsize = $cellsize", aspect = DataAspect())
    hexbin!(ax, x, y, cellsize = cellsize)
    wireframe!(ax, Rect2f(Point2f.(x, y)), color = :red)
    scatter!(ax, x, y, color = :red, markersize = 5)
end

f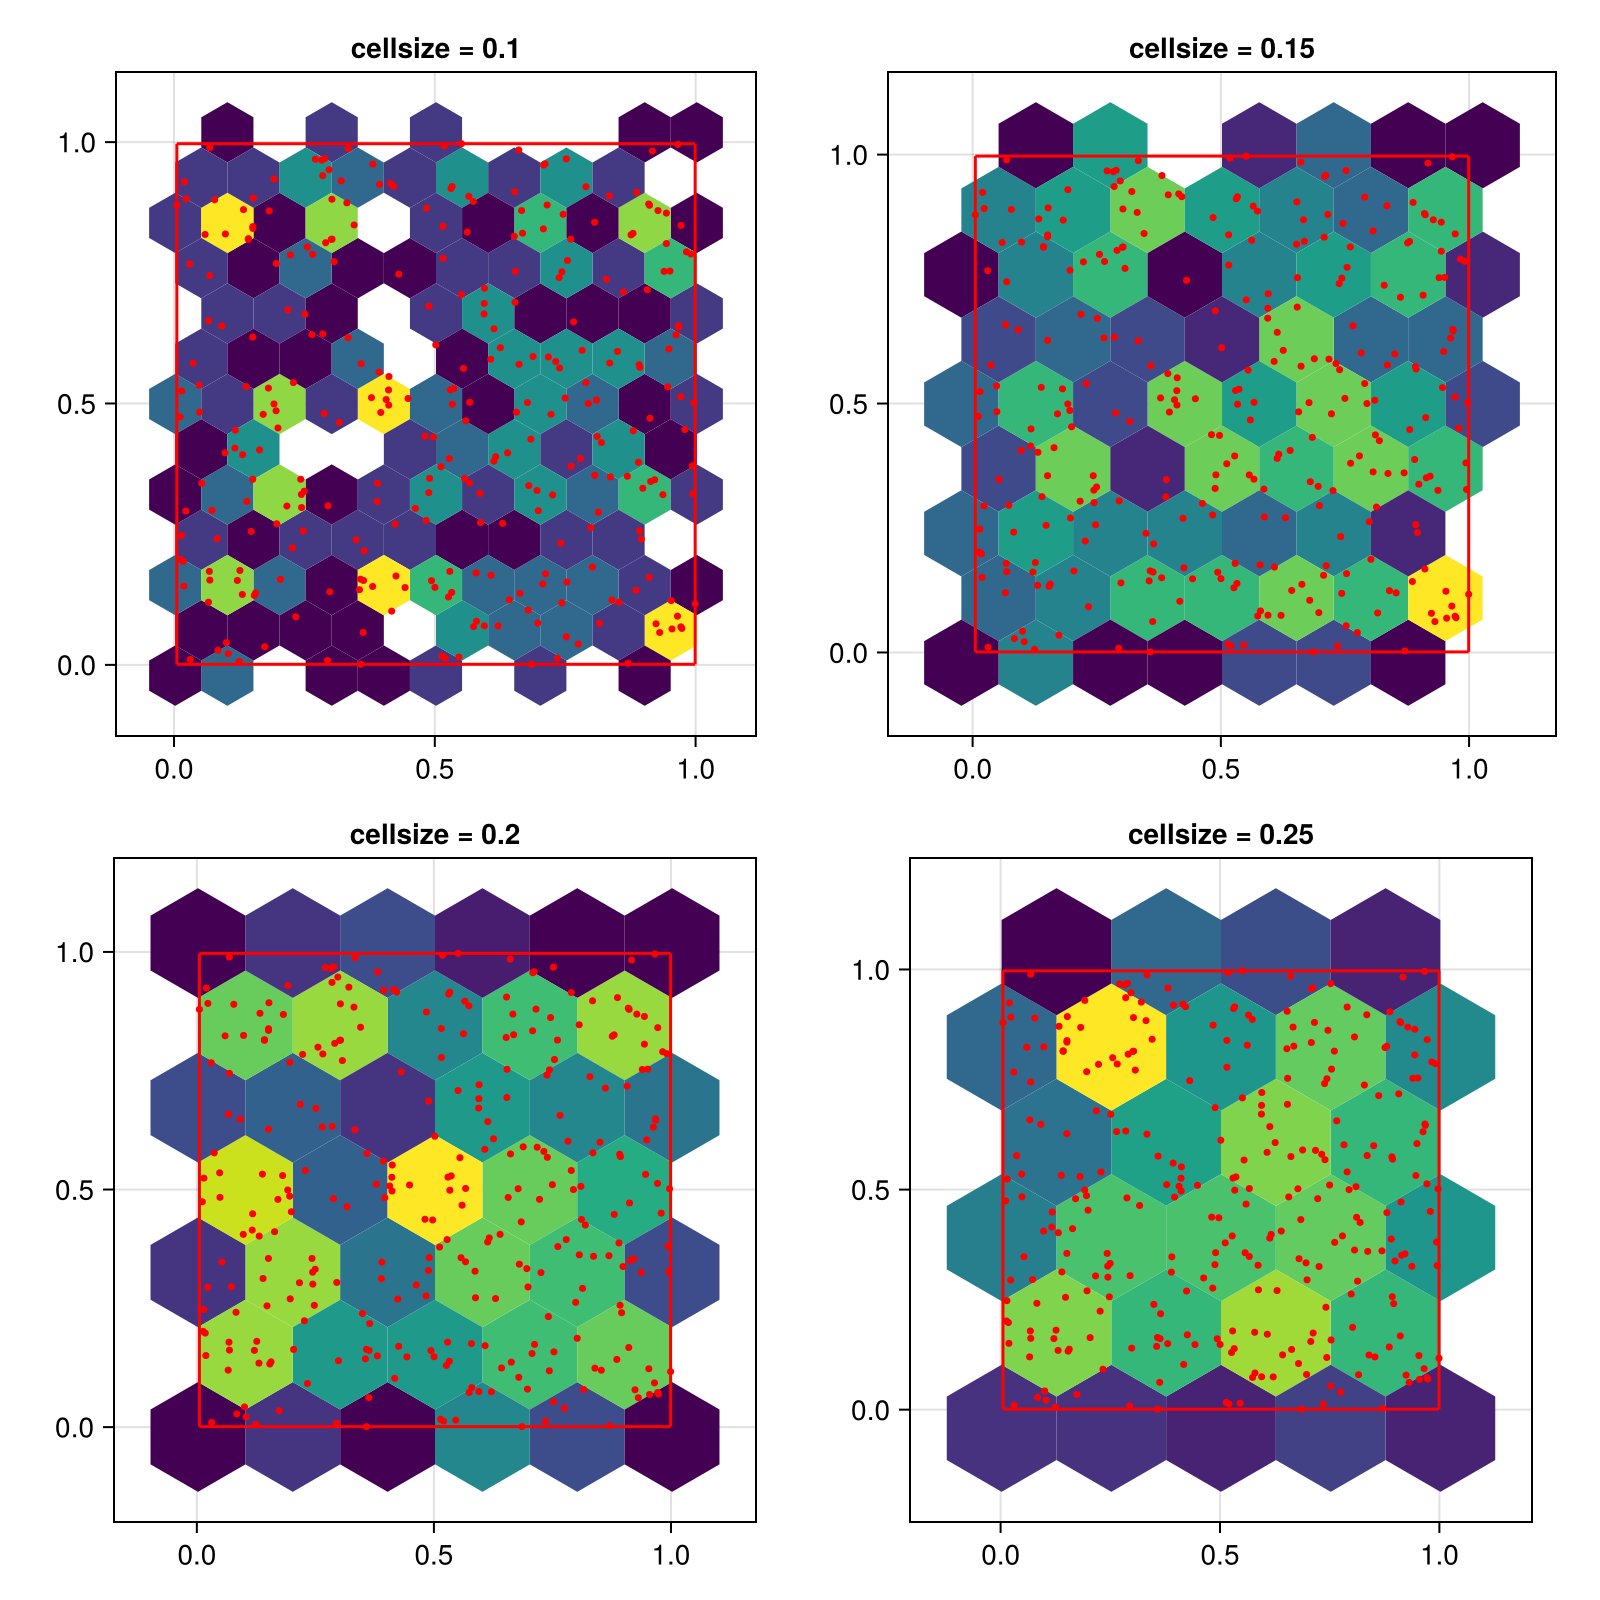
Hiding hexagons with low counts
All hexagons with a count lower than threshold will be removed:
using CairoMakie
using Random
Random.seed!(1234)

f = Figure(size = (800, 800))

x = randn(100000)
y = randn(100000)

for (i, threshold) in enumerate([1, 10, 100, 500])
    ax = Axis(f[fldmod1(i, 2)...], title = "threshold = $threshold", aspect = DataAspect())
    hexbin!(ax, x, y, cellsize = 0.4, threshold = threshold)
end
f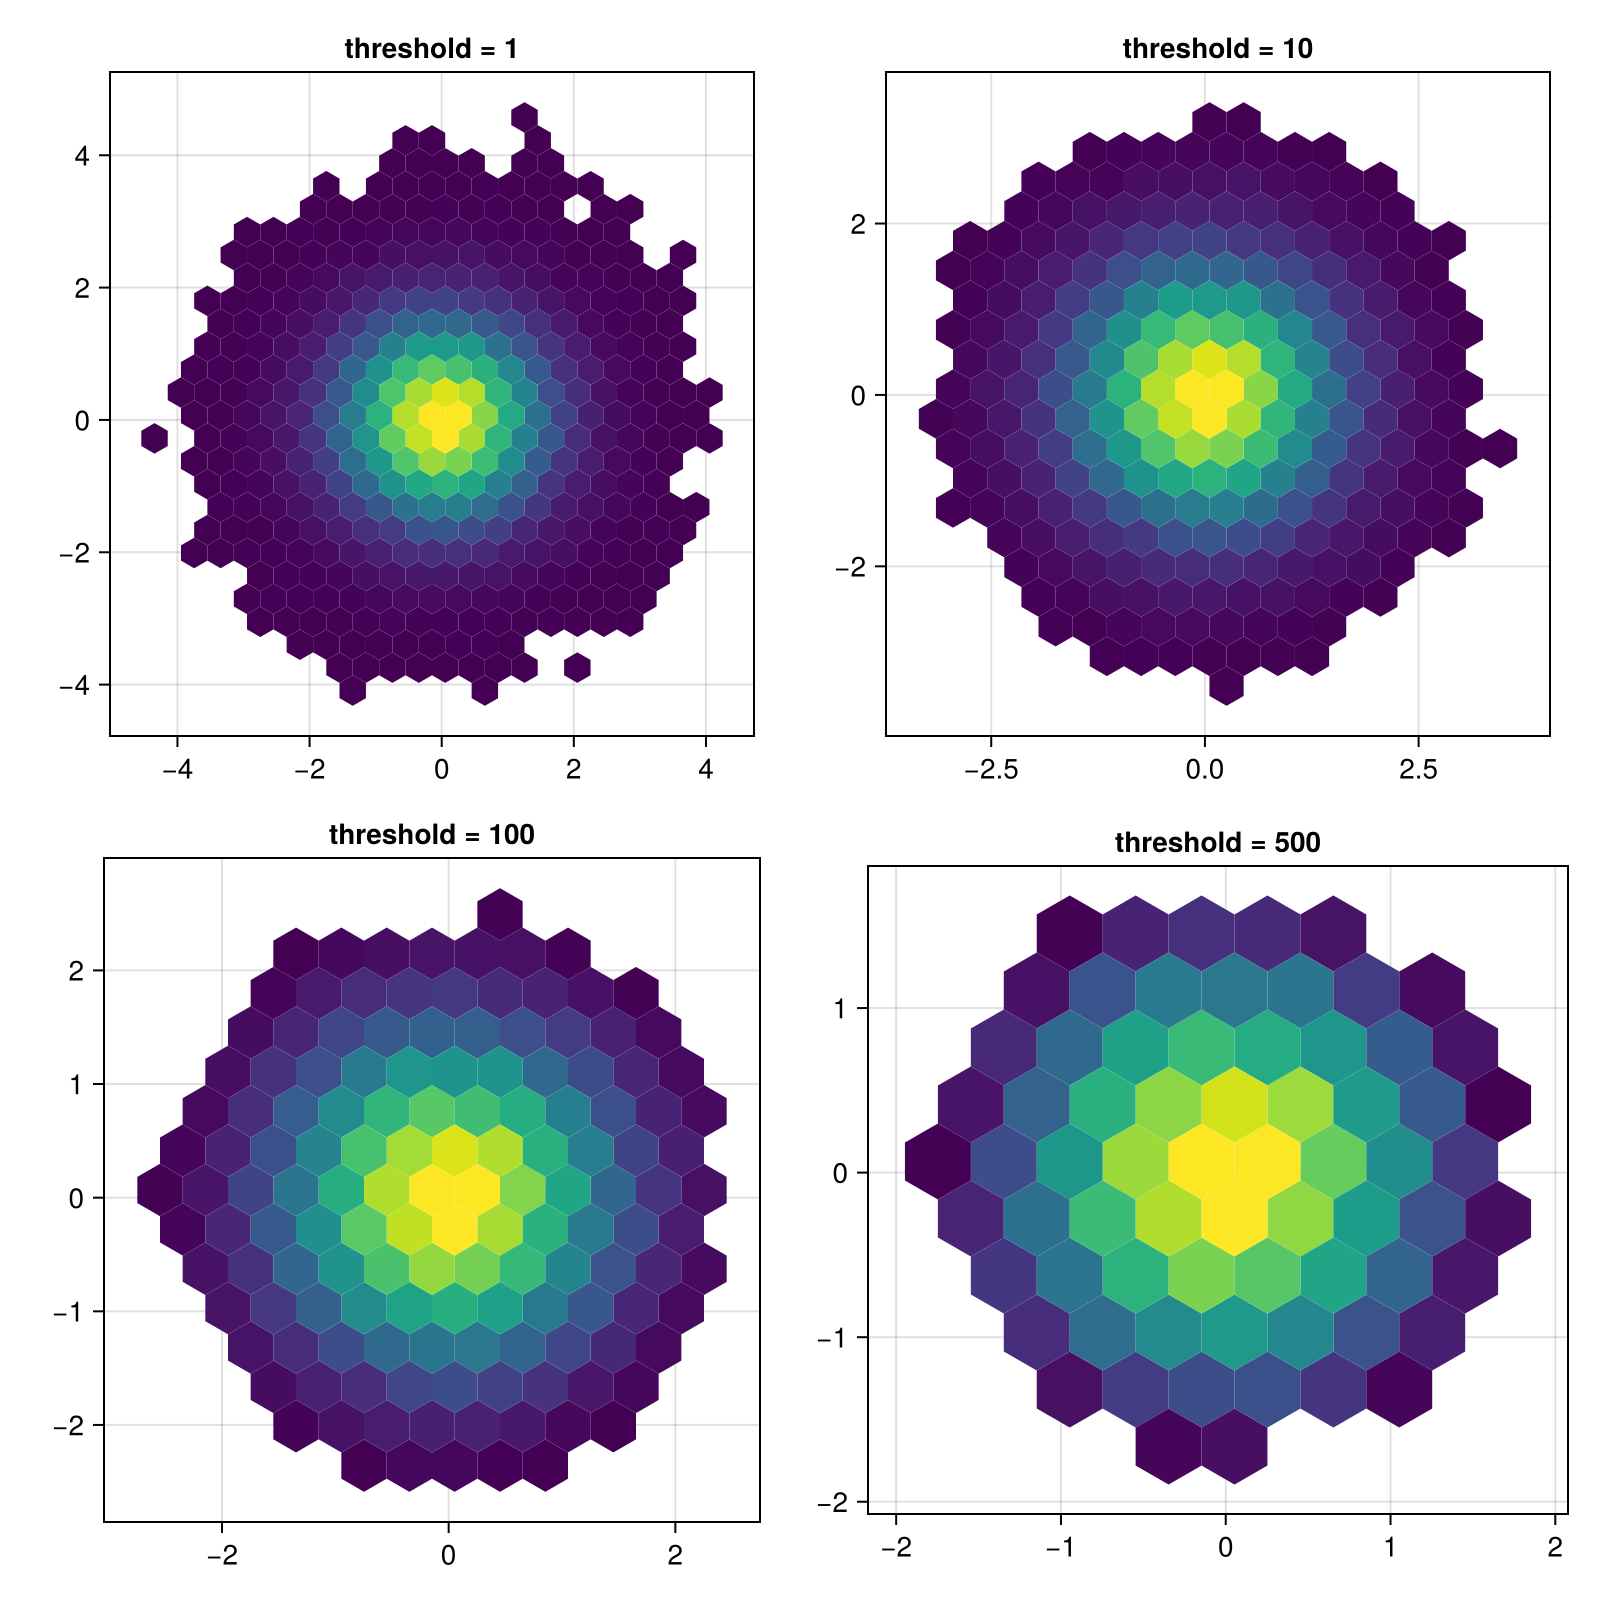
Changing the scale of the number of observations in a bin
You can pass a scale function to via the colorscale keyword, which will be applied to the bin counts before plotting.
using CairoMakie
using Random
Random.seed!(1234)

x = randn(100000)
y = randn(100000)

f = Figure()
hexbin(f[1, 1], x, y, bins = 40,
    axis = (aspect = DataAspect(), title = "colorscale = identity"))
hexbin(f[1, 2], x, y, bins = 40, colorscale=log10,
    axis = (aspect = DataAspect(), title = "colorscale = log10"))
f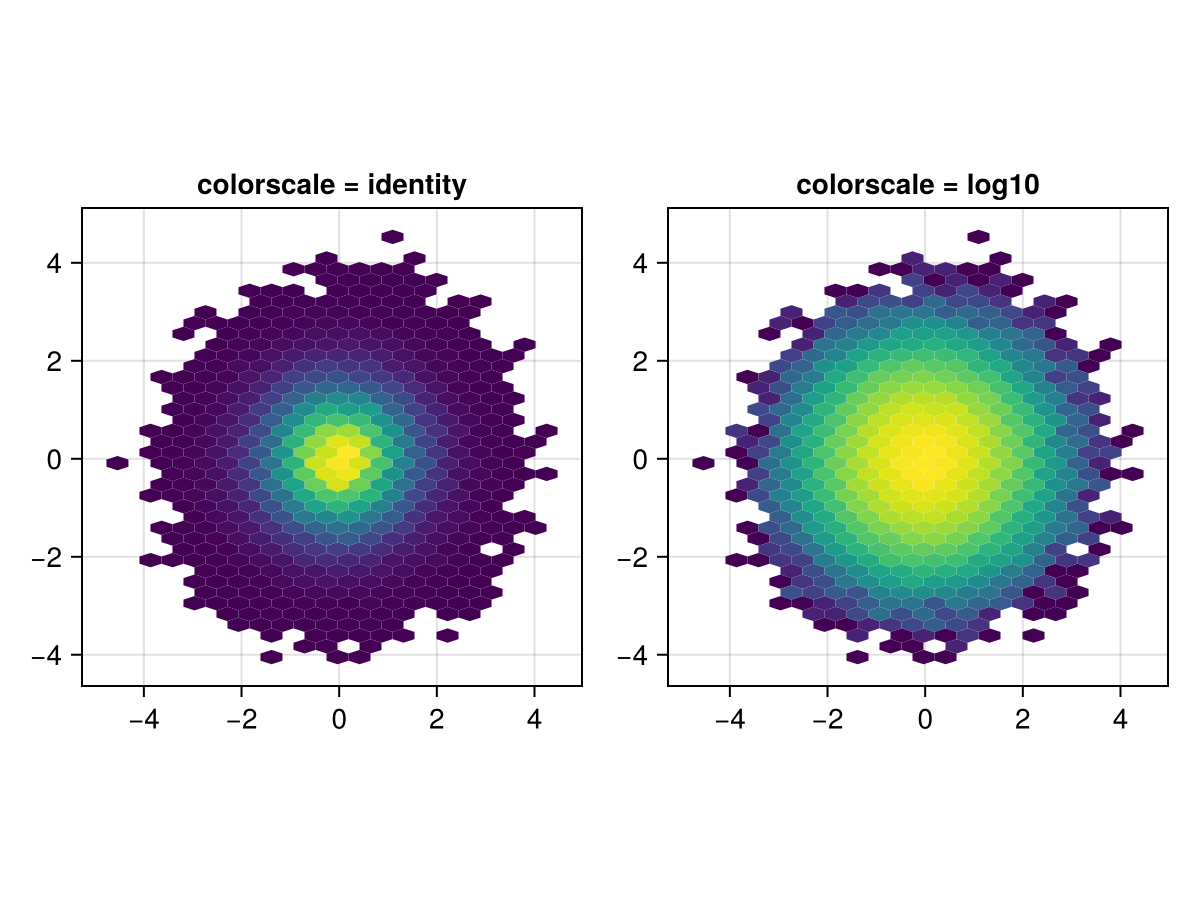
Showing zero count hexagons
By setting threshold = 0, all hexagons that fit into the limits of the input data are shown. In this example, we add a transparent color to the start of the colormap and stroke each hexagon so the empty hexagons are visible but not too distracting.
using CairoMakie
using DelimitedFiles


a = map(Point2f, eachrow(readdlm(assetpath("airportlocations.csv"))))

f, ax, hb = hexbin(a,
    cellsize = 6,
    axis = (; aspect = DataAspect()),
    threshold = 0,
    colormap = [Makie.to_color(:transparent); Makie.to_colormap(:viridis)],
    strokewidth = 0.5,
    strokecolor = :gray50,
    colorscale = Makie.pseudolog10)

tightlimits!(ax)

Colorbar(f[1, 2], hb,
    label = "Number of airports",
    height = Relative(0.5)
)
f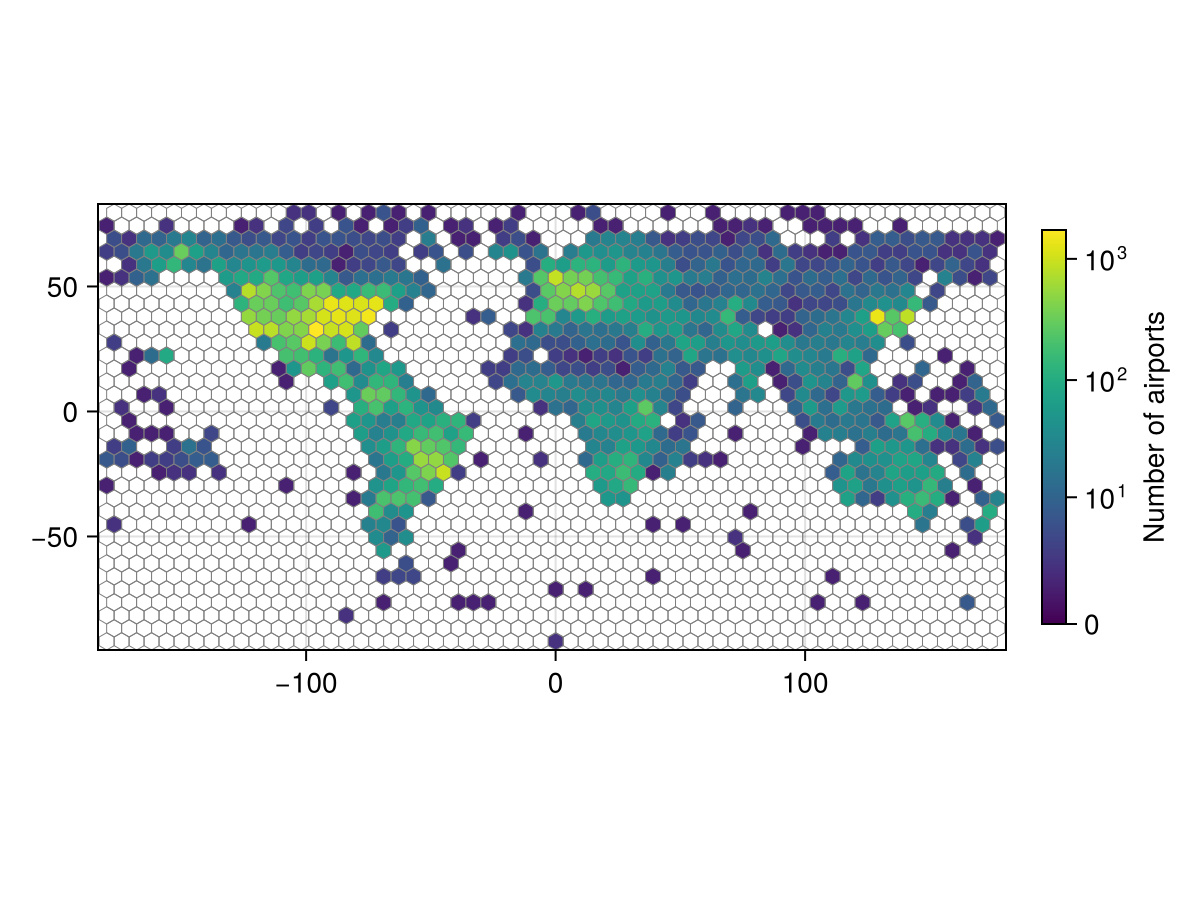
Applying weights to observations
using CairoMakie

using Random
Random.seed!(1234)

f = Figure(size = (800, 800))

x = 1:100
y = 1:100
points = vec(Point2f.(x, y'))

weights = [nothing, rand(length(points)), Makie.StatsBase.eweights(length(points), 0.005), Makie.StatsBase.weights(randn(length(points)))]
weight_labels = ["No weights", "Vector{<: Real}", "Exponential weights (StatsBase.eweights)", "StatesBase.weights(randn(...))"]

for (i, (weight, title)) in enumerate(zip(weights, weight_labels))
    ax = Axis(f[fldmod1(i, 2)...], title = title, aspect = DataAspect())
    hexbin!(ax, points; weights = weight)
    autolimits!(ax)
end

f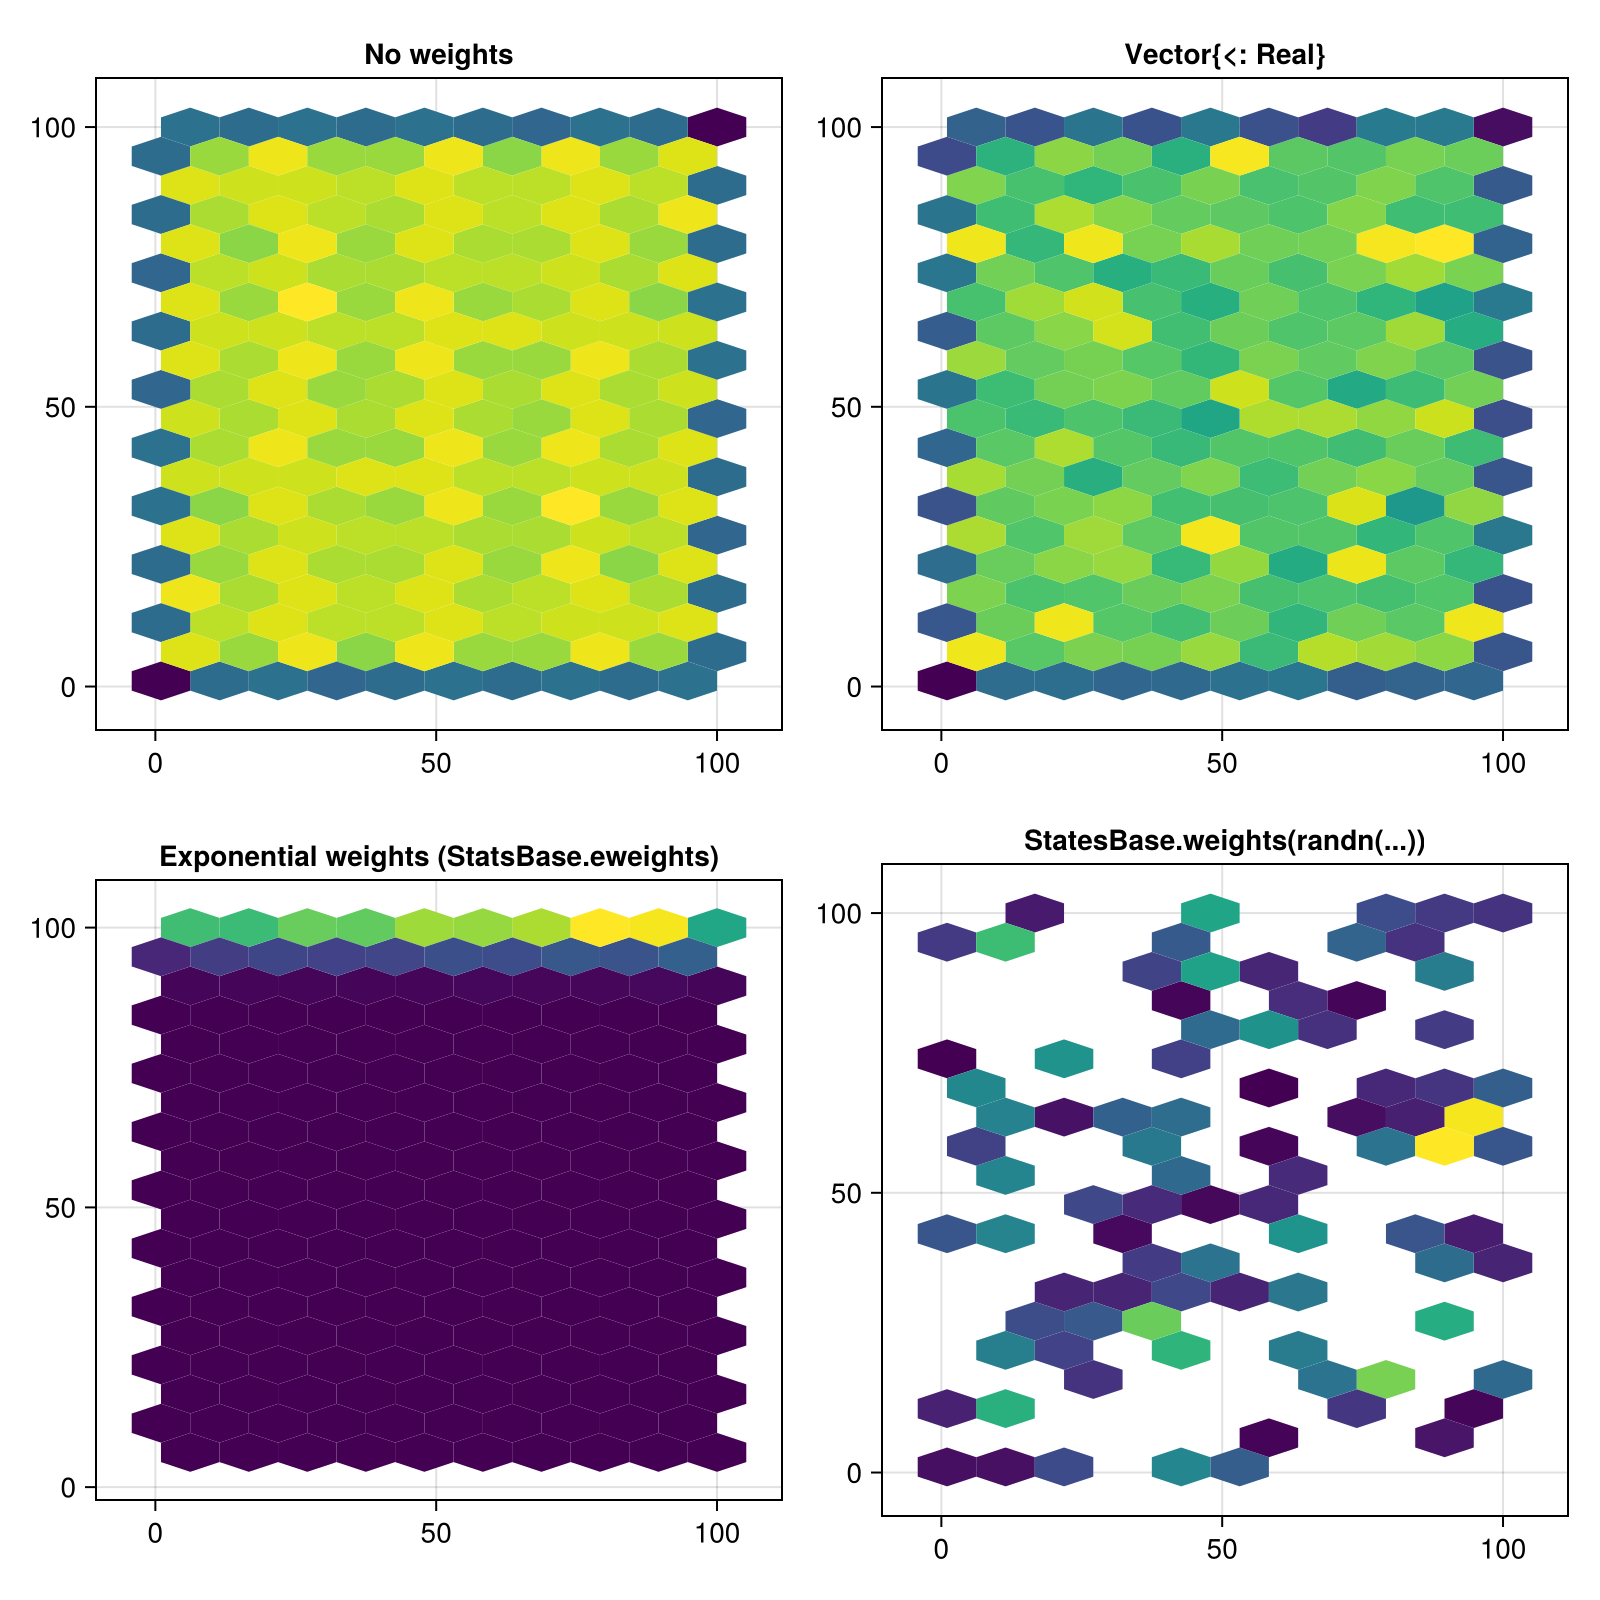
Attributes
alpha
Defaults to 1.0
The alpha value of the colormap or color attribute. Multiple alphas like in plot(alpha=0.2, color=(:red, 0.5)), will get multiplied.
bins
Defaults to 20
Sets the number of bins in the x and y direction. They can be set separately with a tuple or together with an integer.
cellsize
Defaults to nothing
Sets the size of hexagons. The width and height can be set separately with a tuple or together with a real number.
clip_planes
Defaults to @inherit clip_planes automatic
Clip planes offer a way to do clipping in 3D space. You can set a Vector of up to 8 Plane3f planes here, behind which plots will be clipped (i.e. become invisible). By default clip planes are inherited from the parent plot or scene. You can remove parent clip_planes by passing Plane3f[].
colormap
Defaults to @inherit colormap :viridis
Sets the colormap that is sampled for numeric colors. PlotUtils.cgrad(...), Makie.Reverse(any_colormap) can be used as well, or any symbol from ColorBrewer or PlotUtils. To see all available color gradients, you can call Makie.available_gradients().
colorrange
Defaults to automatic
The values representing the start and end points of colormap.
colorscale
Defaults to identity
The color transform function. Can be any function, but only works well together with Colorbar for identity, log, log2, log10, sqrt, logit, Makie.pseudolog10, Makie.Symlog10, Makie.AsinhScale, Makie.SinhScale, Makie.LogScale, Makie.LuptonAsinhScale, and Makie.PowerScale.
depth_shift
Defaults to 0.0
Adjusts the depth value of a plot after all other transformations, i.e. in clip space, where -1 <= depth <= 1. This only applies to GLMakie and WGLMakie and can be used to adjust render order (like a tunable overdraw).
fxaa
Defaults to false
Adjusts whether the plot is rendered with fxaa (fast approximate anti-aliasing, GLMakie only). Note that some plots implement a better native anti-aliasing solution (scatter, text, lines). For them fxaa = true generally lowers quality. Plots that show smoothly interpolated data (e.g. image, surface) may also degrade in quality as fxaa = true can cause blurring.
highclip
Defaults to automatic
The color for any value above the colorrange.
inspectable
Defaults to @inherit inspectable
Sets whether this plot should be seen by DataInspector. The default depends on the theme of the parent scene.
inspector_clear
Defaults to automatic
Sets a callback function (inspector, plot) -> ... for cleaning up custom indicators in DataInspector.
inspector_hover
Defaults to automatic
Sets a callback function (inspector, plot, index) -> ... which replaces the default show_data methods.
inspector_label
Defaults to automatic
Sets a callback function (plot, index, position) -> string which replaces the default label generated by DataInspector.
lowclip
Defaults to automatic
The color for any value below the colorrange.
model
Defaults to automatic
Sets a model matrix for the plot. This overrides adjustments made with translate!, rotate! and scale!.
nan_color
Defaults to :transparent
The color for NaN values.
overdraw
Defaults to false
Controls if the plot will draw over other plots. This specifically means ignoring depth checks in GL backends
space
Defaults to :data
Sets the transformation space for box encompassing the plot. See Makie.spaces() for possible inputs.
ssao
Defaults to false
Adjusts whether the plot is rendered with ssao (screen space ambient occlusion). Note that this only makes sense in 3D plots and is only applicable with fxaa = true.
strokecolor
Defaults to :black
Sets the color of hexagon outlines. Requires strokewidth > 0.
strokewidth
Defaults to 0
Sets the width of hexagon outlines.
threshold
Defaults to 1
The minimal number of observations in the bin for it to be shown. If 0, all zero-count hexagons fitting into the data limits will be shown.
transformation
Defaults to :automatic
Controls the inheritance or directly sets the transformations of a plot. Transformations include the transform function and model matrix as generated by translate!(...), scale!(...) and rotate!(...). They can be set directly by passing a Transformation() object or inherited from the parent plot or scene. Inheritance options include:
:automatic: Inherit transformations if the parent and childspaceis compatible:inherit: Inherit transformations:inherit_model: Inherit only model transformations:inherit_transform_func: Inherit only the transform function:nothing: Inherit neither, fully disconnecting the child's transformations from the parent
Another option is to pass arguments to the transform!() function which then get applied to the plot. For example transformation = (:xz, 1.0) which rotates the xy plane to the xz plane and translates by 1.0. For this inheritance defaults to :automatic but can also be set through e.g. (:nothing, (:xz, 1.0)).
transparency
Defaults to false
Adjusts how the plot deals with transparency. In GLMakie transparency = true results in using Order Independent Transparency.
visible
Defaults to true
Controls whether the plot gets rendered or not.
weights
Defaults to nothing
Weights for each observation. Can be nothing (each observation carries weight 1), any AbstractVector{<: Real} or any StatsBase.AbstractWeights.