Aspect ratios and automatic figure sizes
A very common problem in plotting is dealing with aspect ratios and other ways to precisely control figures.
For example, many plots need square axes. If you have looked at the documentation of Axis, you might know that it has an aspect attribute that can control the aspect ratio of the axis box. This aspect is not concerned with what the data limits are, it's just about the relative visual length of the axes.
Let's look at one common example, a square axis with a colorbar next to it:
using CairoMakie
set_theme!(backgroundcolor = :gray90)

f = Figure(size = (800, 500))
ax = Axis(f[1, 1], aspect = 1)
Colorbar(f[1, 2])
f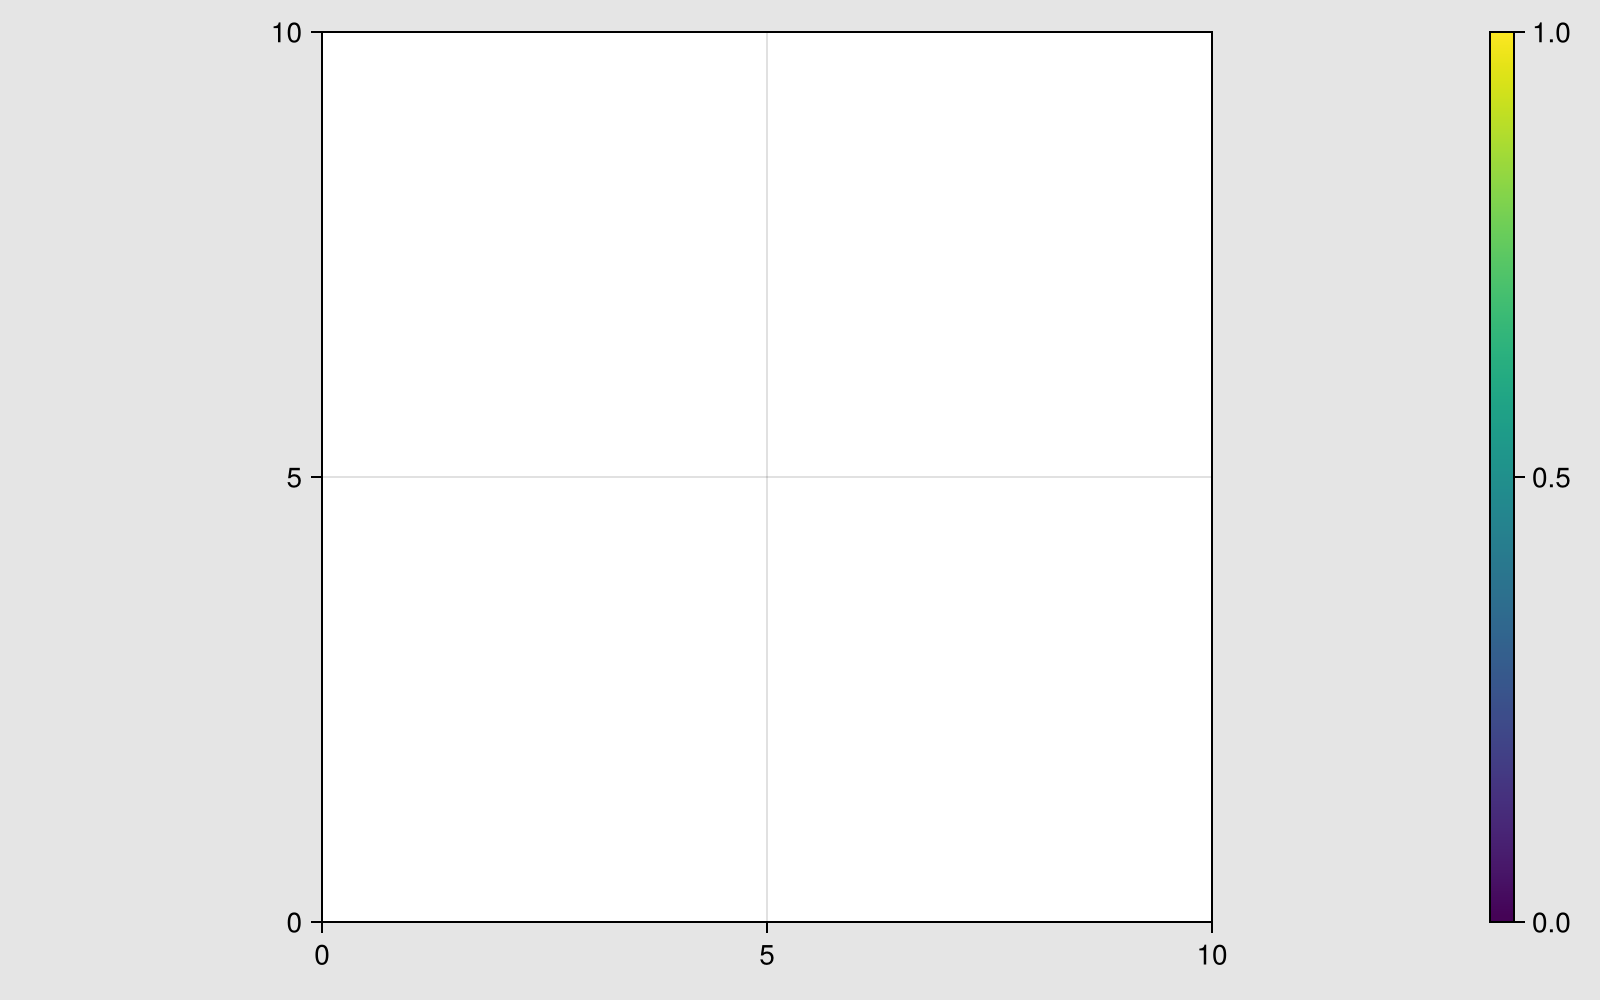
As you can see, the axis is square, but there's also a large gap between it and the colorbar. Why is that?
We can visualize the reason by adding a Box to the same cell where the axis is:
Box(f[1, 1], color = (:red, 0.2), strokewidth = 0)
f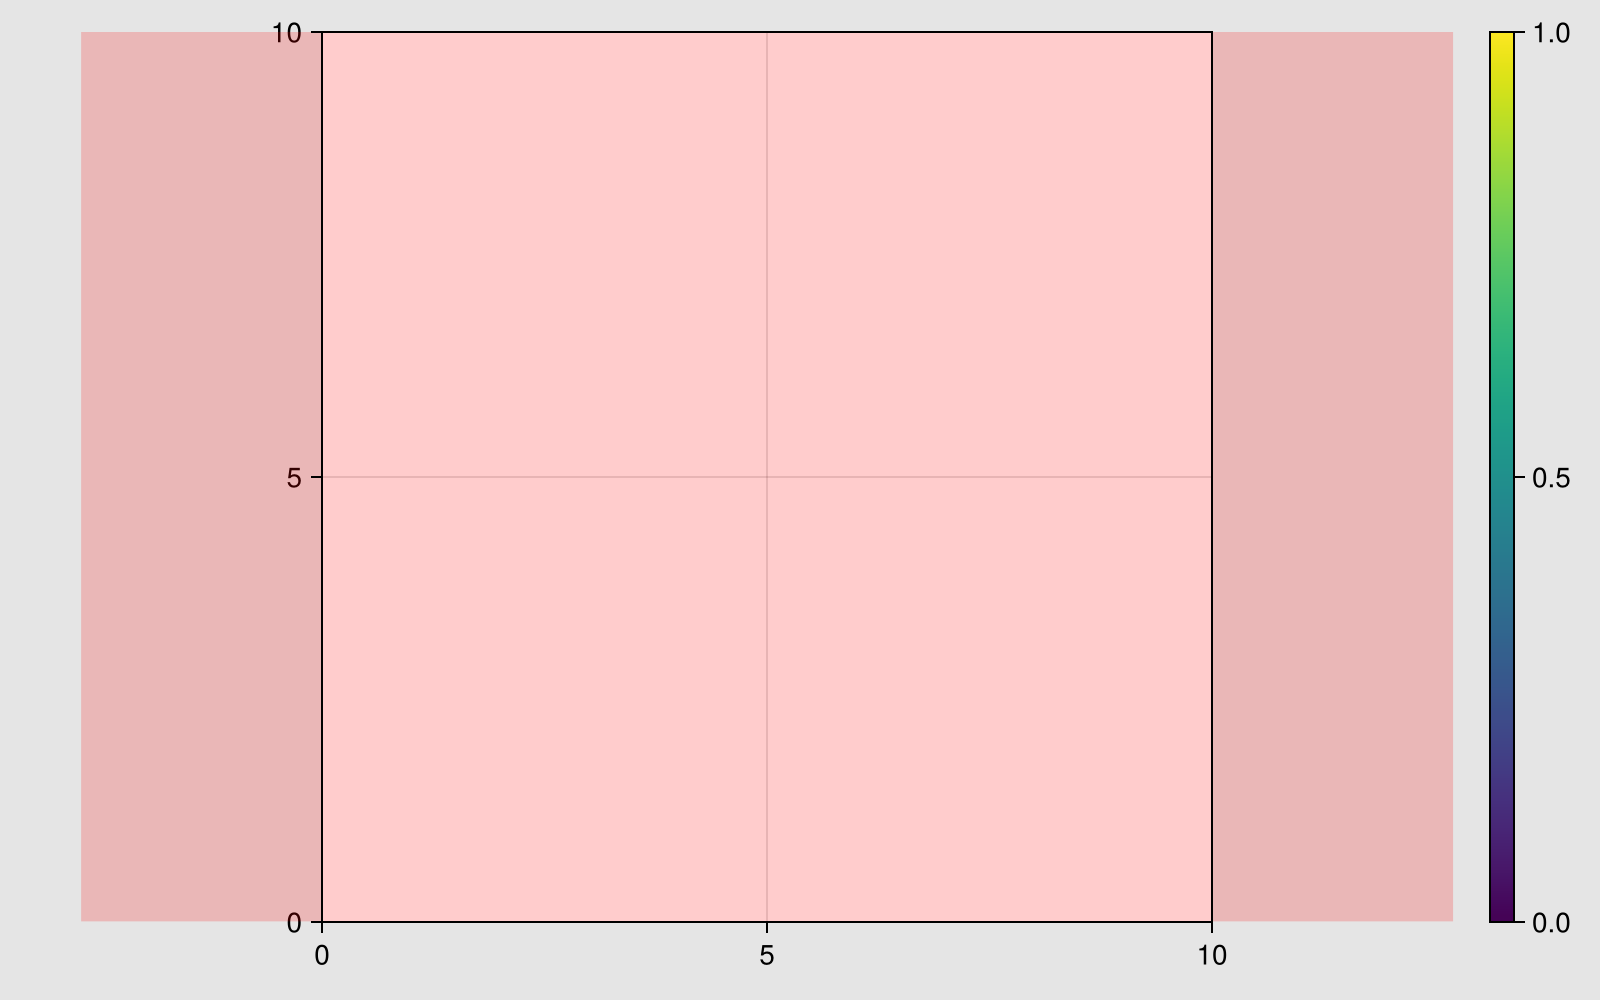
The red area of the box extends out into the whitespace left by the Axis. This demonstrates what the aspect keyword is actually doing. It reduces the size of the Axis, such that the chosen aspect ratio is achieved. It doesn't tell the layout that the Axis lives in "please make this cell adhere to this aspect ratio". As far as the layout is concerned, the Axis has an undefined size and its layout cell can therefore have any size that the layout deems correct, based on all other content of the layout and the figure size.
Therefore, using aspect will always cause gaps, unless the layout cell where the Axis lives happens to have exactly the correct aspect ratio by chance. This means aspect should only be used if the whitespace caused by it does not matter too much.
For all other cases, there is a different approach.
We want to force the layout to keep the axis cell at a specific aspect ratio. Therefore, we have to manipulate the layout itself, not the axis.
By default, each GridLayout row and column has a size of Auto(). This means that the size can depend on fixed-size content if there is any, otherwise it expands to fill the available space. If we want to force a cell to have an aspect ratio, we need to set either its respective row or column size to Aspect.
Let's try the example from above again, but this time we force the column of the Axis to have an aspect ratio of 1.0 relative to the row of the Axis, which is row 1.
f = Figure(size = (800, 500))
ax = Axis(f[1, 1])
Colorbar(f[1, 2])
colsize!(f.layout, 1, Aspect(1, 1.0))
f
As you can see, this time the colorbar sticks close to the axis, there is no unnecessary whitespace between them. We can visualize the effect of Aspect again with a red box, that shows us the extent of the layout cell:
Box(f[1, 1], color = (:red, 0.2), strokewidth = 0)
f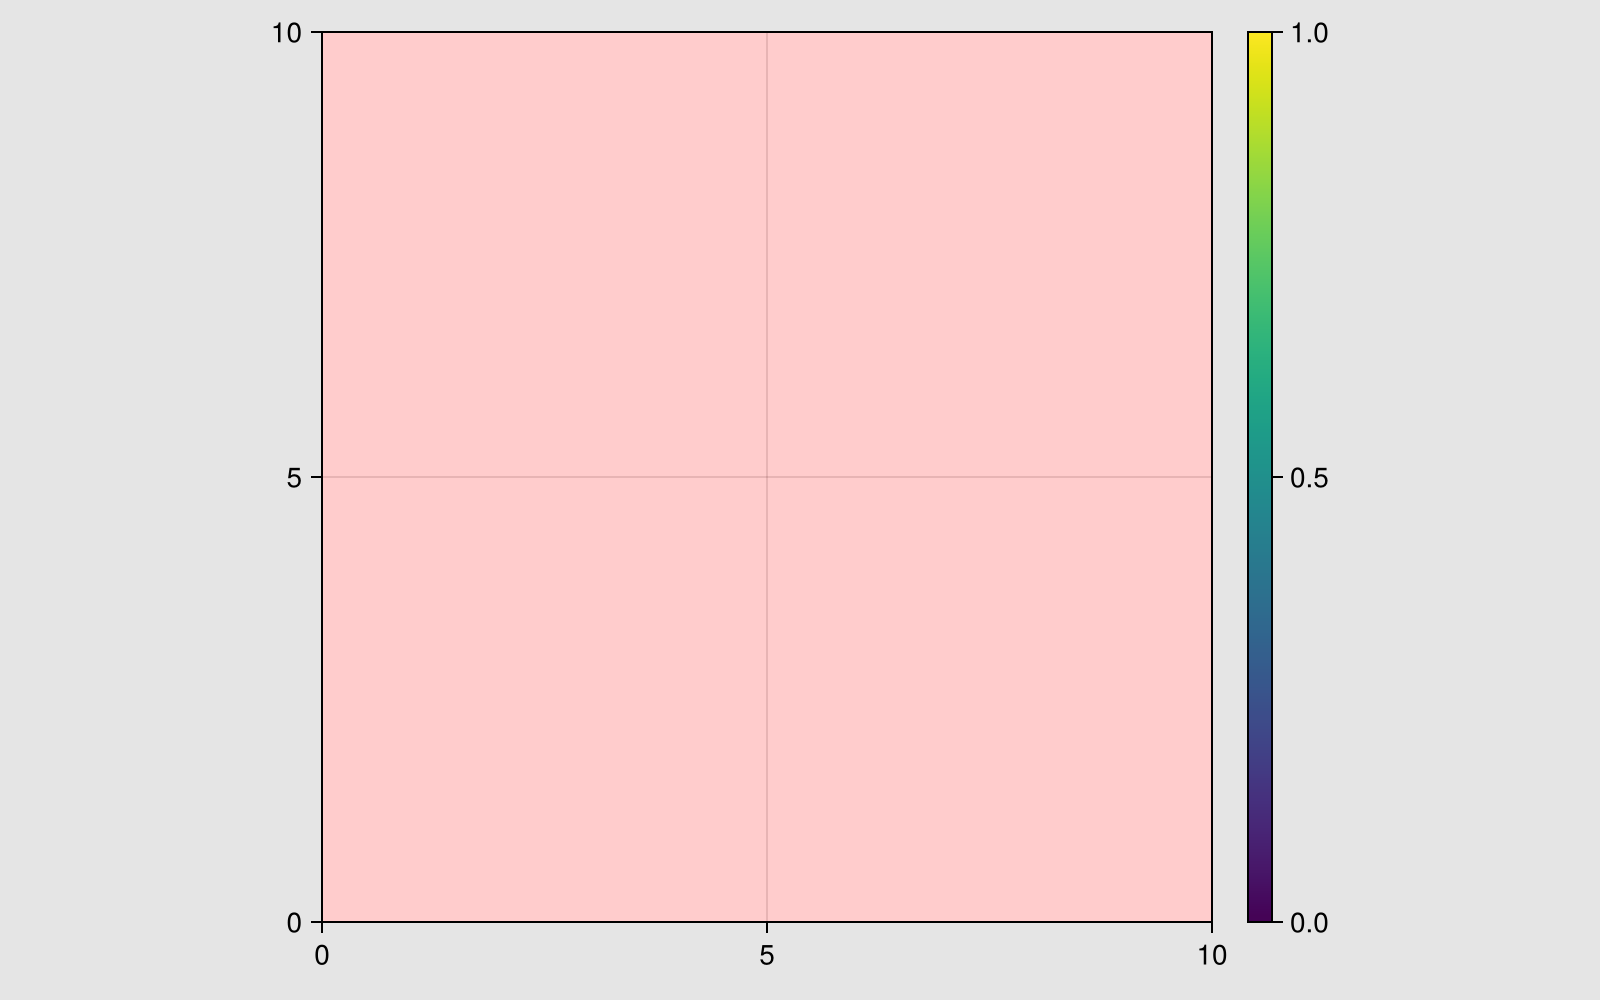
So this time the layout cell itself is square, therefore the Axis that fills it is also square. Let me just demonstrate that we can play the same game again and give the Axis an aspect that is different from the square one that the layout cell has. This will again cause unnecessary whitespace:
ax.aspect = 0.5
f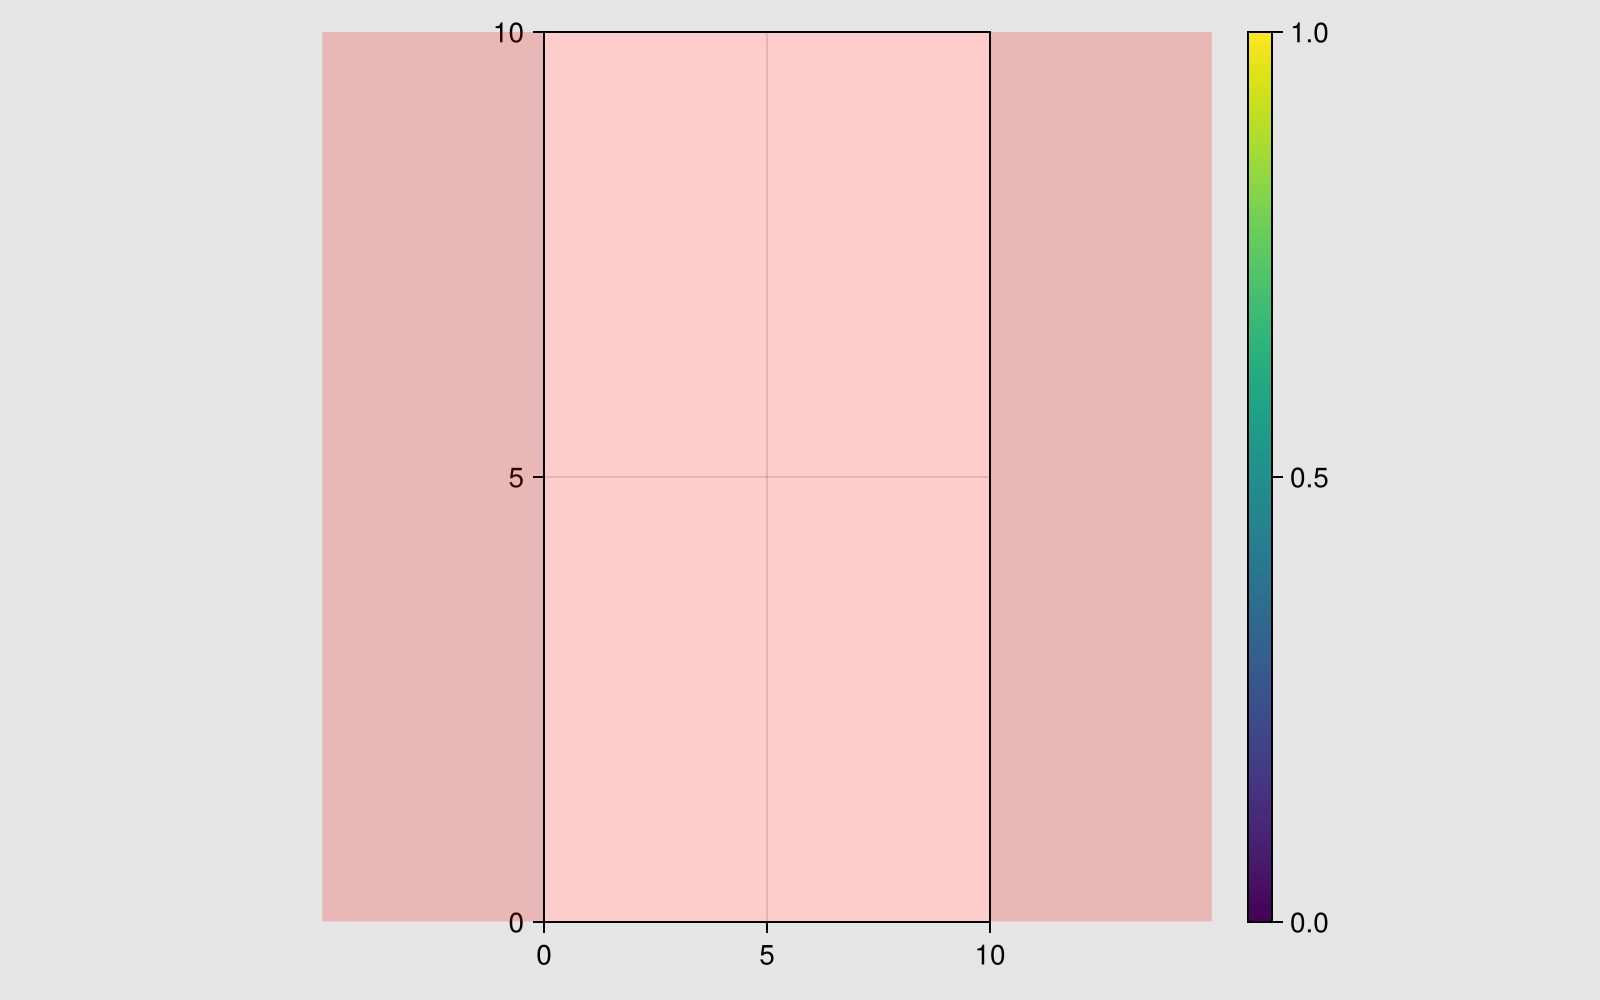
And now we change the column aspect again, to remove this gap:
colsize!(f.layout, 1, Aspect(1, 0.5))
f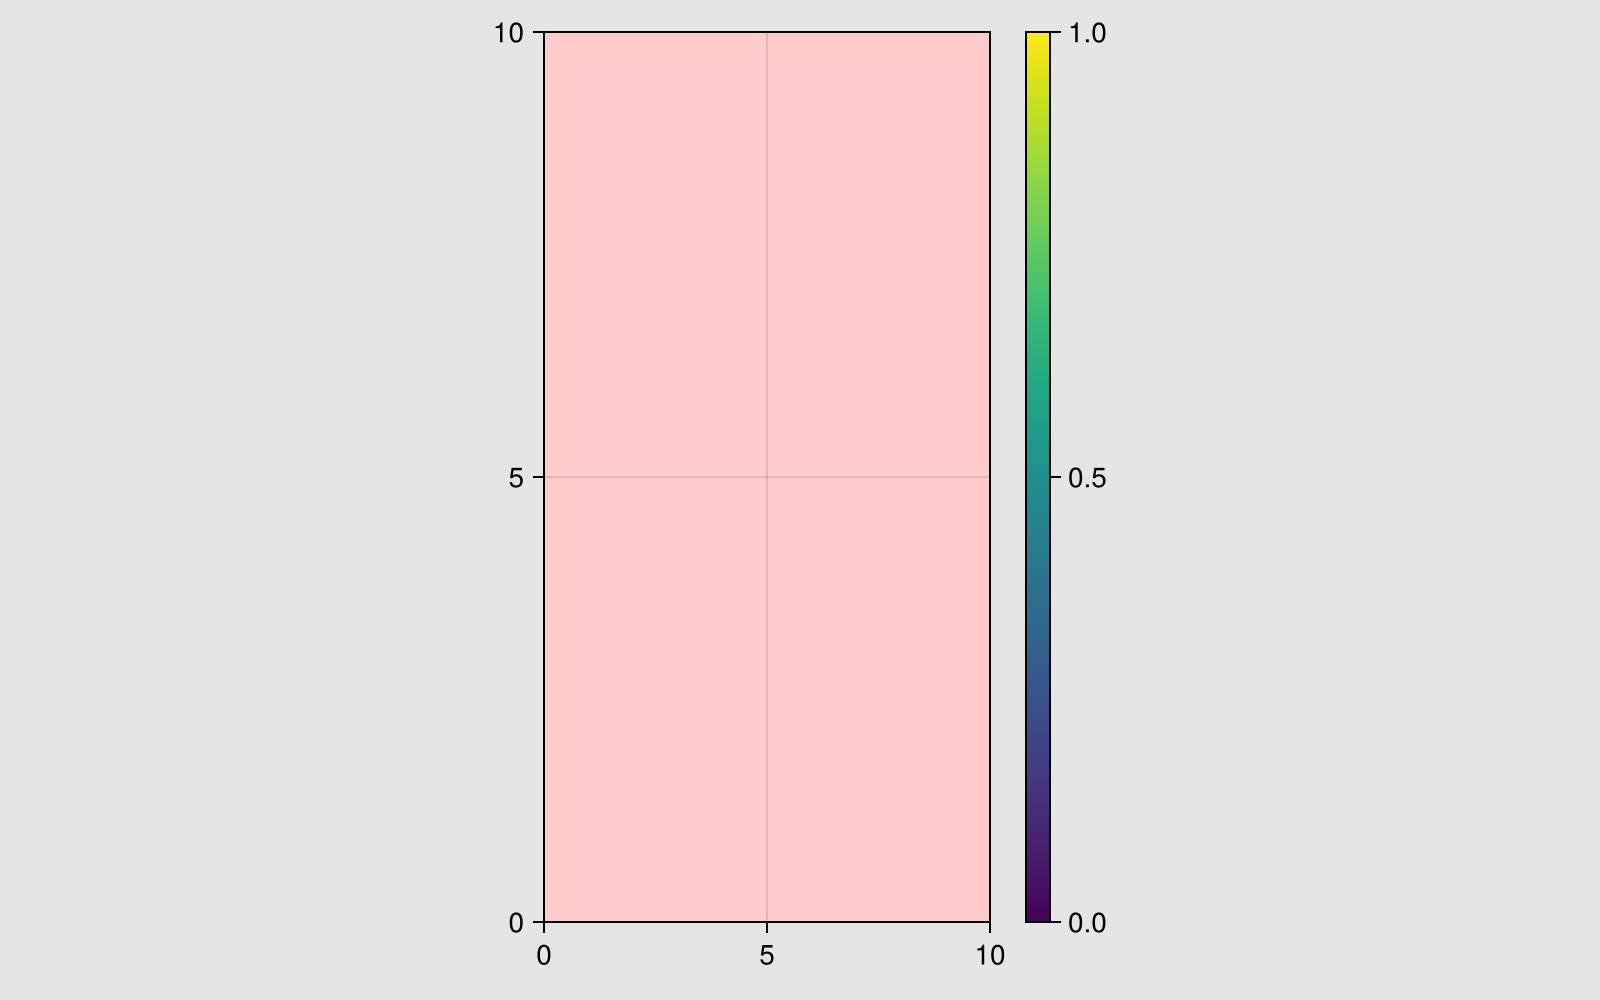
Let's return to our previous state with a square axis:
f = Figure(size = (800, 500))
ax = Axis(f[1, 1])
Colorbar(f[1, 2])
colsize!(f.layout, 1, Aspect(1, 1.0))
f
Now you might think that there is no whitespace anymore between Axis and Colorbar, but there is a lot of it to the left and the right. Why can the layout not fix this problem for us?
Well, in Makie, the layout has to operate within the confines of the figure size that we have set. It cannot just decrease the figure size if there's too little content. This is because lots of times, figures are created to fit the sizing rules of some academic journal exactly, therefore the content you plot is not allowed to mess with the figure size.
So what we have done in our example is introducing constraints to the sizes of objects in our layout, such that it's impossible to fill all the space that is theoretically available. If you think about it, it's impossible to fill this Figure with a square axis and a thin colorbar while filling the rectangular space. We need a smaller figure!
But how small should it be exactly? It would be quite difficult to eyeball this, but thankfully there's a function for this exact purpose. By calling resize_to_layout!, we can adjust the figure size to the size that the layout needs for all its content.
resize_to_layout!(f)
f
As you can see, the whitespace at the sides has been trimmed. (If the scaling looks smaller or bigger, that is just because of the display on this site, not the underlying figure size).
This technique is useful for all kinds of situations where the content should decide the figure size, and not the other way around.
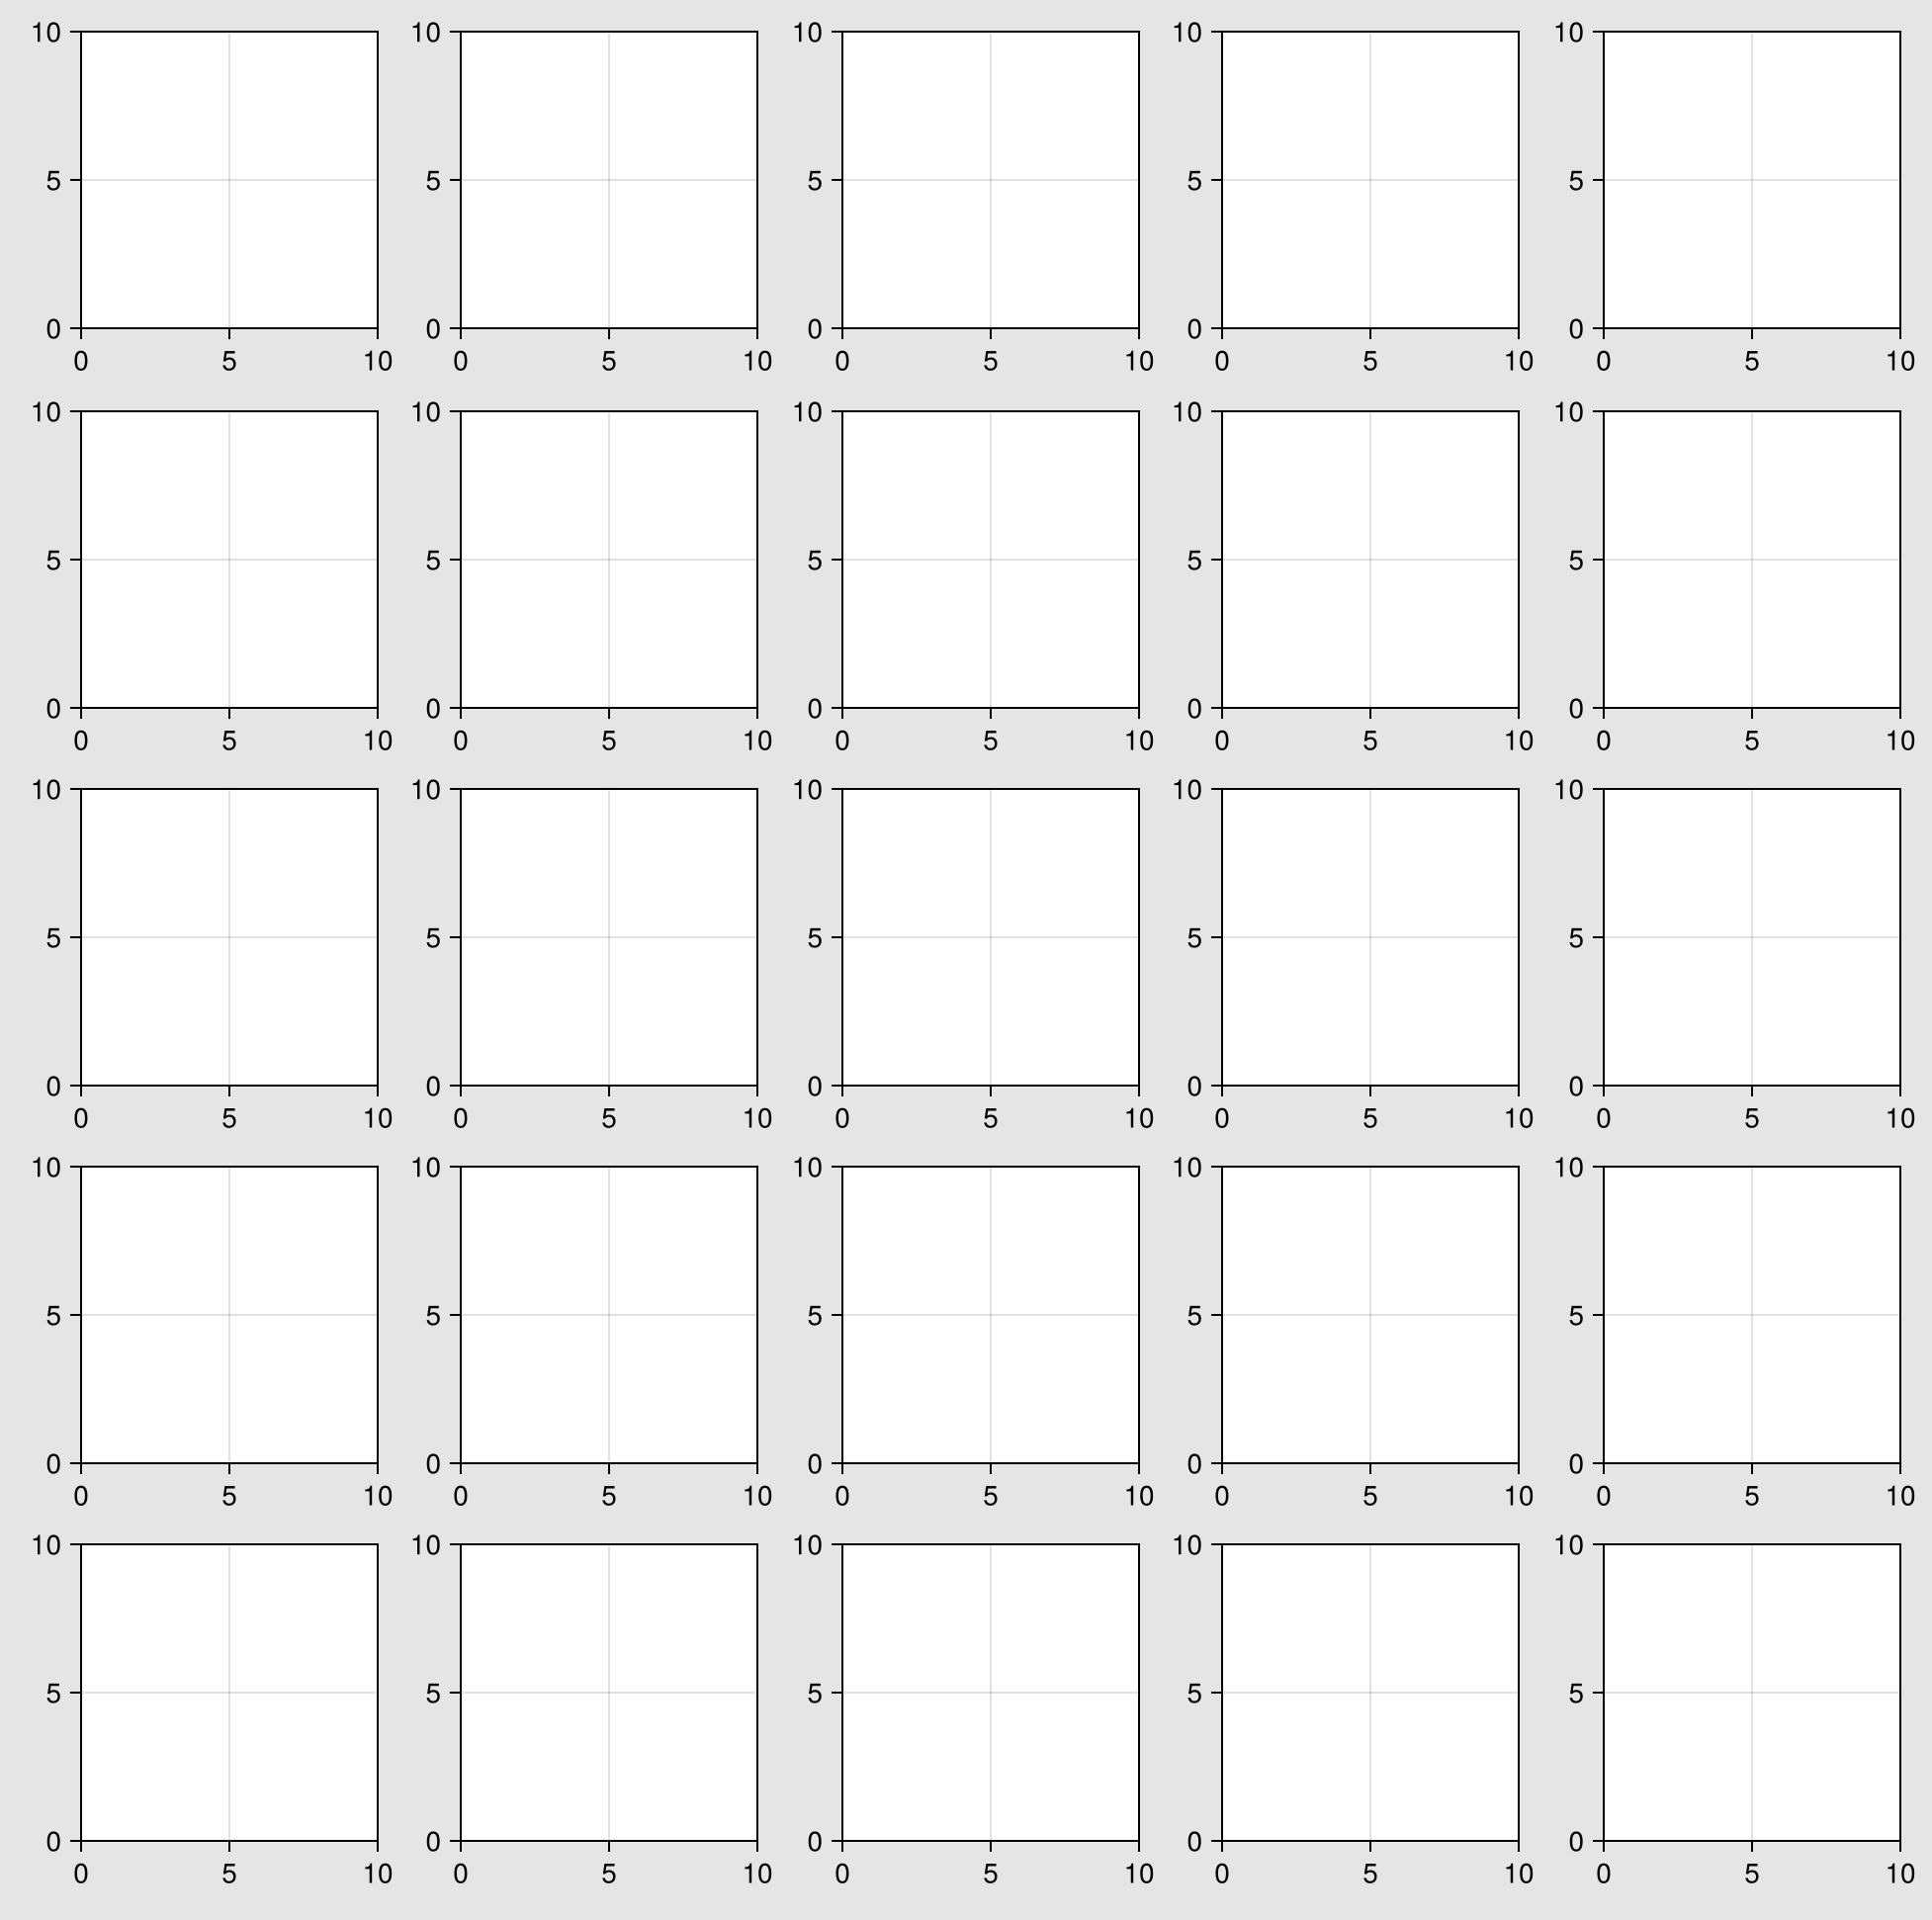
For example, let's say we have a facet plot with 25 square axes which are all of size 150 by 150. We can just make these axes with fixed widths and heights. The Auto sized columns and rows of the default layout pick up these measurements and adjust themselves accordingly.
Of course, the figure size will by default not be appropriate for such an arrangement, and the content will clip:
f = Figure()
for i in 1:5, j in 1:5
    Axis(f[i, j], width = 150, height = 150)
end
f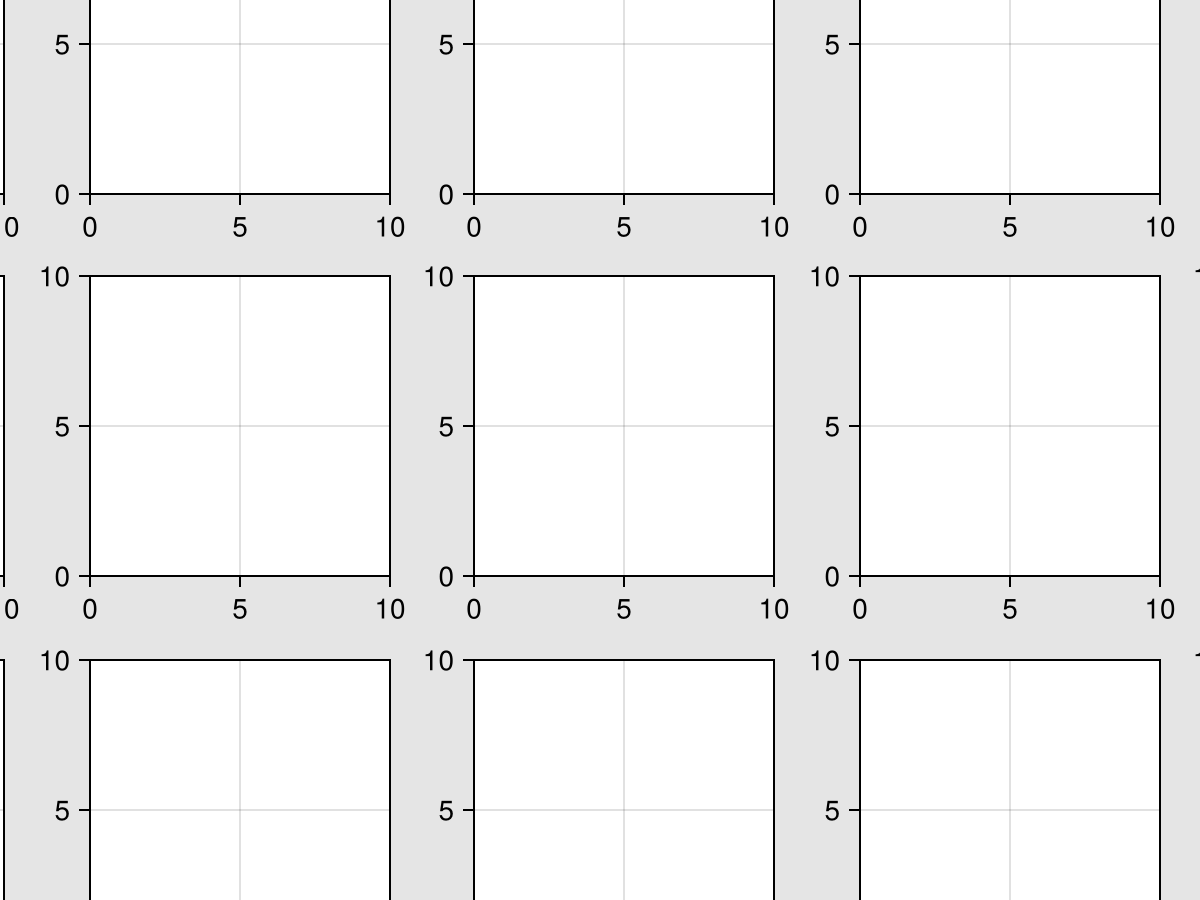
But like before we can call resize_to_layout! and the size will be corrected so no clipping occurs.
resize_to_layout!(f)
f