text
Makie.text Function
text(positions; text, kwargs...)
text(x, y; text, kwargs...)
text(x, y, z; text, kwargs...)
Plots one or multiple texts passed via the text keyword. Text uses the PointBased conversion trait.
Plot type
The plot type alias for the text function is Text.
Marker space pixel
By default, text is drawn with markerspace = :pixel, which means that the text size is interpreted in pixel space. (The space of the text position is determined by the space attribute instead.)
The boundingbox of text with markerspace = :pixel will include every data point or every text anchor point but not the text itself, because its extent depends on the current projection of the axis it is in. This also means that autolimits! might cut off your text, because the glyphs don't have a meaningful size in data coordinates (the size is independent of zoom level), and you have to take some care to manually place the text or set data limits such that it is fully visible.
You can either plot one string with one position, or a vector of strings with a vector of positions.
using CairoMakie
f = Figure()

Axis(f[1, 1], aspect = DataAspect(), backgroundcolor = :gray50)

scatter!(Point2f(0, 0))
text!(0, 0, text = "center", align = (:center, :center))

circlepoints = [(cos(a), sin(a)) for a in LinRange(0, 2pi, 16)[1:end-1]]
scatter!(circlepoints)
text!(
    circlepoints,
    text = "this is point " .* string.(1:15),
    rotation = LinRange(0, 2pi, 16)[1:end-1],
    align = (:right, :baseline),
    color = cgrad(:Spectral)[LinRange(0, 1, 15)]
)

f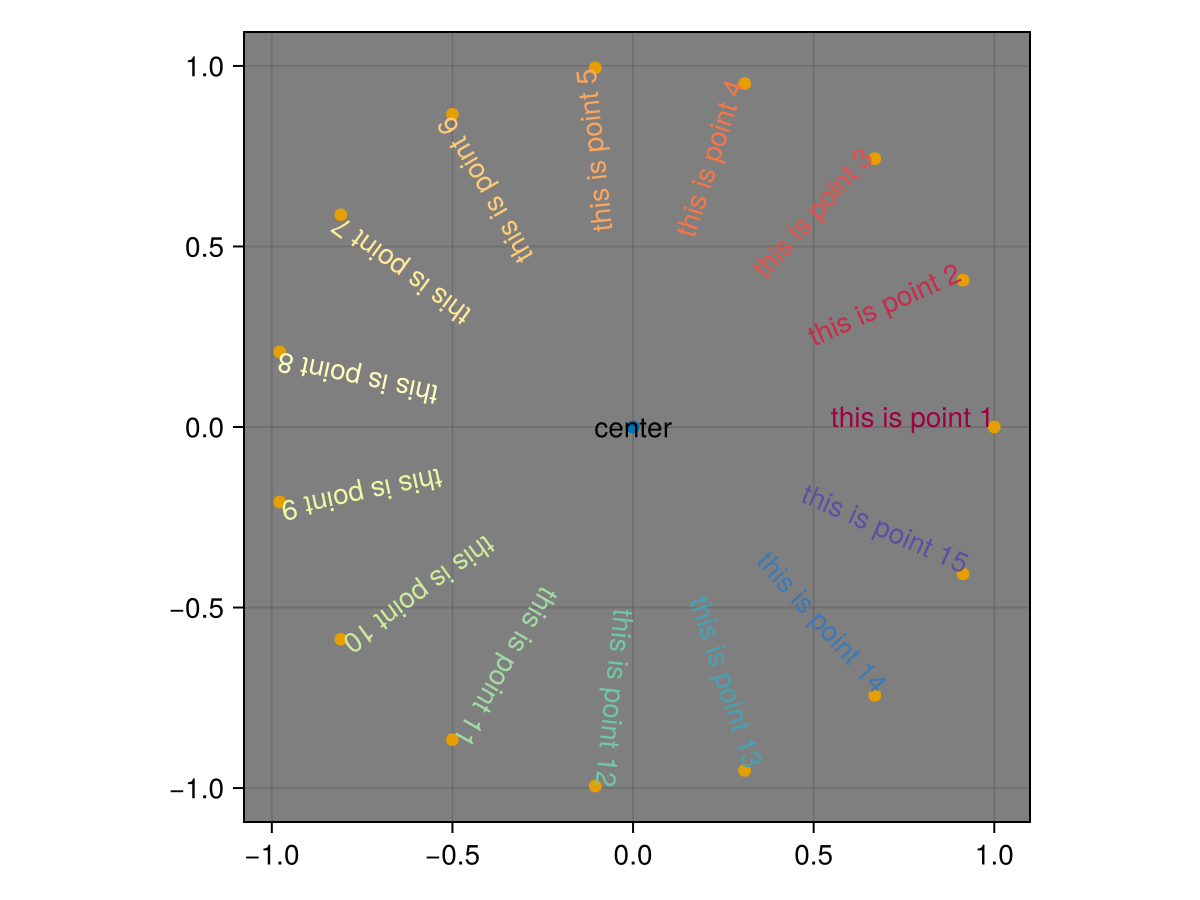
Marker space data
For text whose dimensions are meaningful in data space, set markerspace = :data. This means that the boundingbox of the text in data coordinates will include every glyph.
using CairoMakie
f = Figure()
LScene(f[1, 1])

text!(
    [Point3f(0, 0, i/2) for i in 1:7],
    text = fill("Makie", 7),
    rotation = [i / 7 * 1.5pi for i in 1:7],
    color = [cgrad(:viridis)[x] for x in LinRange(0, 1, 7)],
    align = (:left, :baseline),
    fontsize = 1,
    markerspace = :data
)

f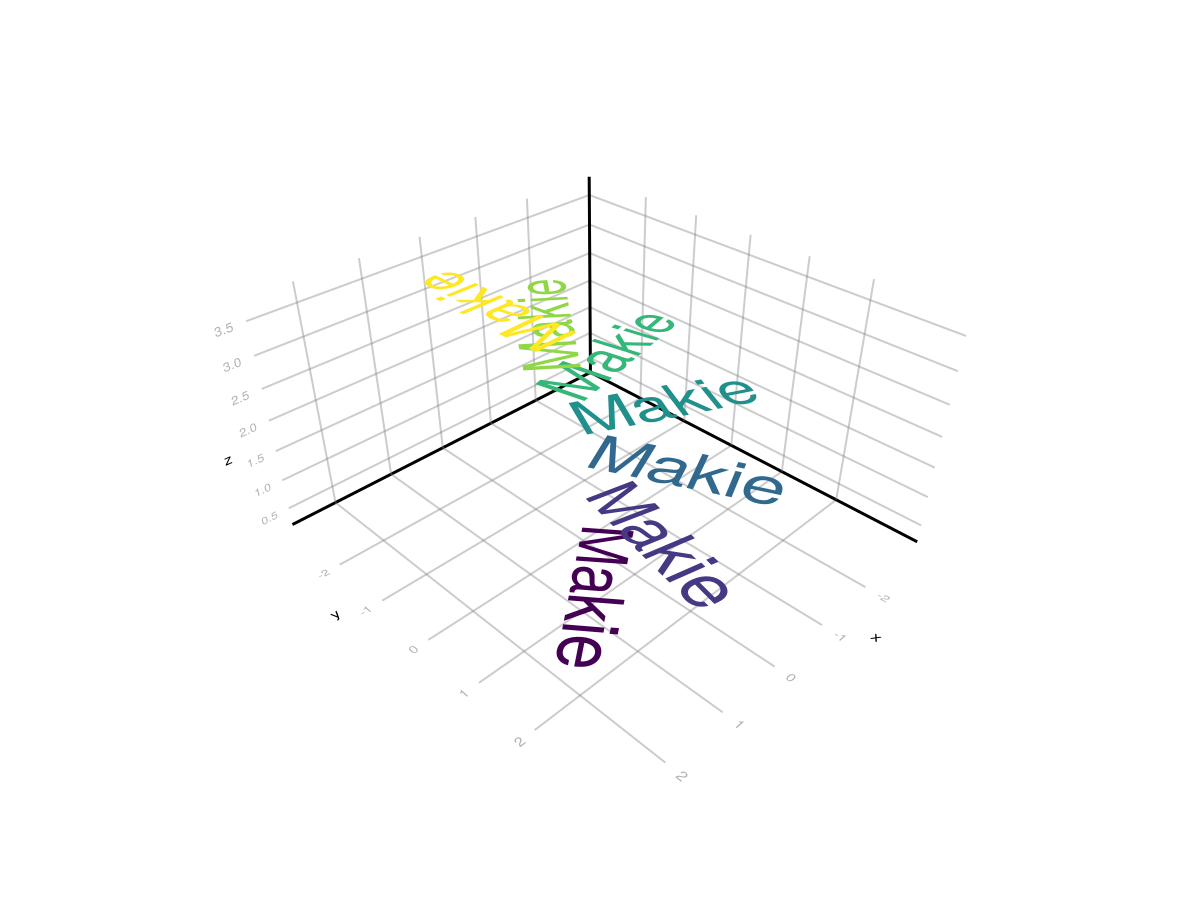
Alignment
Text can be aligned with the horizontal alignments :left, :center, :right and the vertical alignments :bottom, :baseline, :center, :top.
using CairoMakie
aligns = [(h, v) for v in [:bottom, :baseline, :center, :top]
                 for h in [:left, :center, :right]]
x = repeat(1:3, 4)
y = repeat(1:4, inner = 3)
scatter(x, y)
text!(x, y, text = string.(aligns), align = aligns)
current_figure()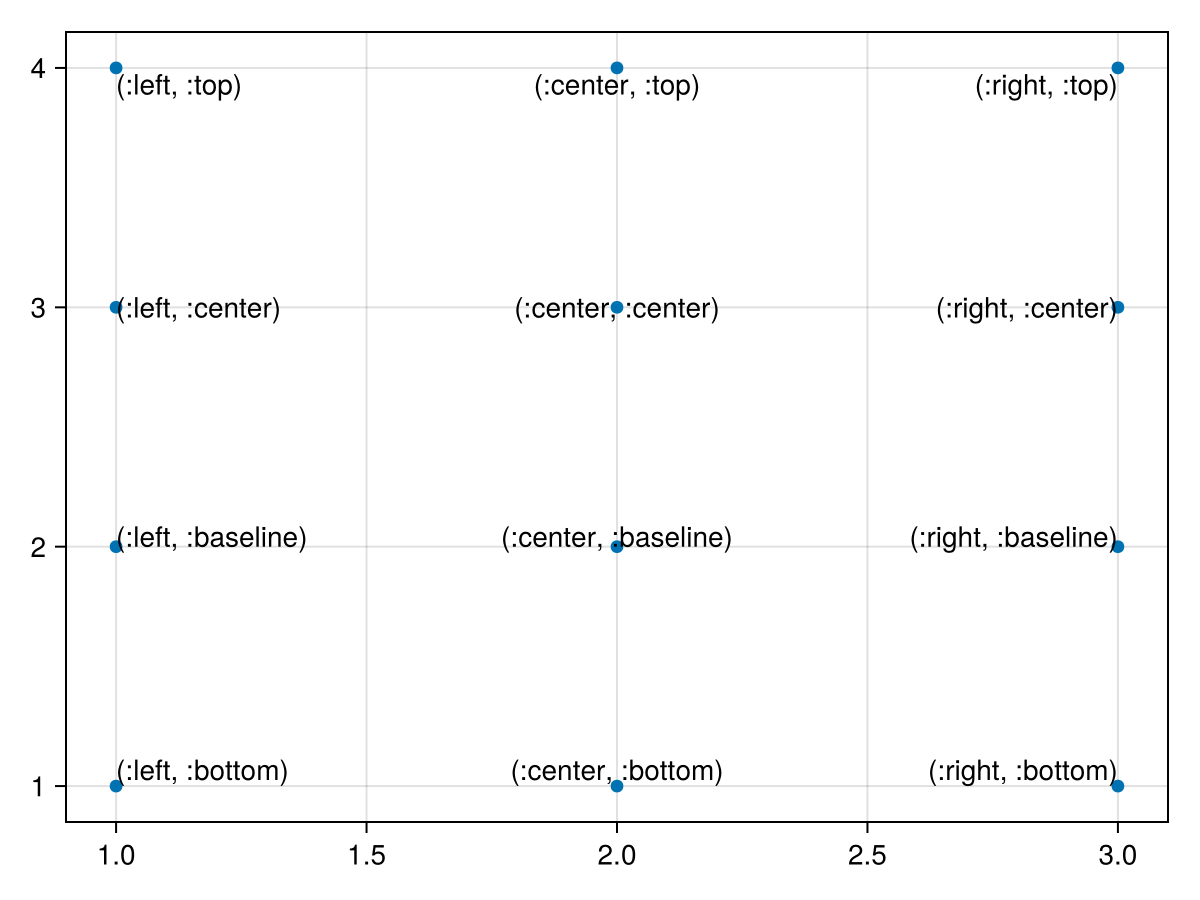
Justification
By default, justification of multiline text follows alignment. Text that is left aligned is also left justified. You can override this with the justification attribute.
using CairoMakie
scene = Scene(camera = campixel!, size = (800, 800))

points = [Point(x, y) .* 200 for x in 1:3 for y in 1:3]
scatter!(scene, points, marker = :circle, markersize = 10px)

symbols = (:left, :center, :right)

for ((justification, halign), point) in zip(Iterators.product(symbols, symbols), points)

    t = text!(scene,
        point,
        text = "a\nshort\nparagraph",
        color = (:black, 0.5),
        align = (halign, :center),
        justification = justification)

    bb = boundingbox(t, :pixel)
    wireframe!(scene, bb, color = (:red, 0.2))
end

for (p, al) in zip(points[3:3:end], (:left, :center, :right))
    text!(scene, p .+ (0, 80), text = "align :" * string(al),
        align = (:center, :baseline))
end

for (p, al) in zip(points[7:9], (:left, :center, :right))
    text!(scene, p .+ (80, 0), text = "justification\n:" * string(al),
        align = (:center, :top), rotation = pi/2)
end

scene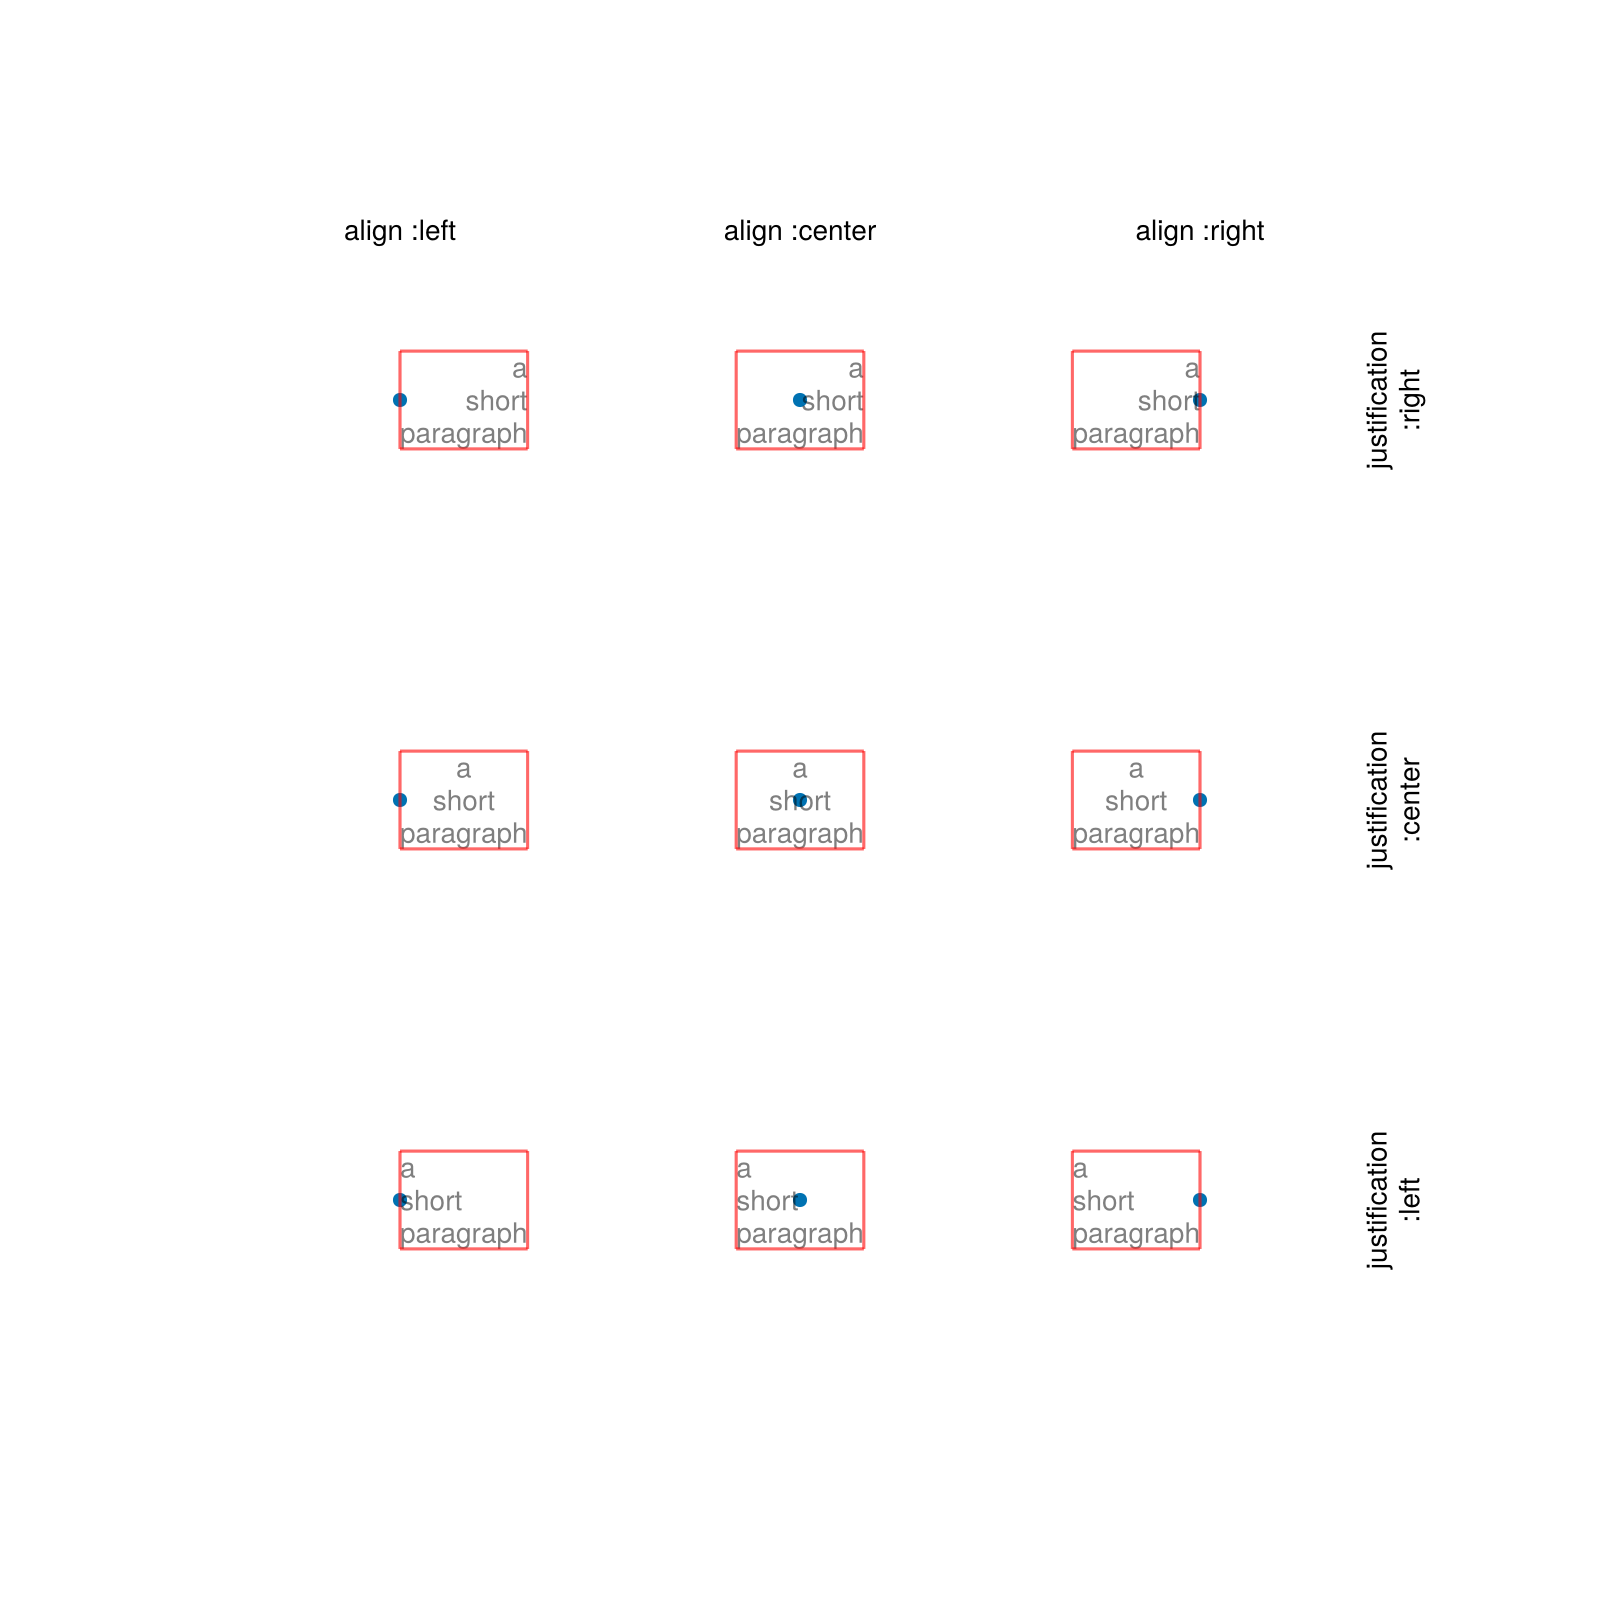
Offset
The offset attribute can be used to shift text away from its position. This is especially useful with space = :pixel, for example to place text together with barplots. You can specify the end of the barplots in data coordinates, and then offset the text a little bit to the left.
using CairoMakie
f = Figure()

horsepower = [52, 78, 80, 112, 140]
cars = ["Kia", "Mini", "Honda", "Mercedes", "Ferrari"]

ax = Axis(f[1, 1], xlabel = "horse power")
tightlimits!(ax, Left())
hideydecorations!(ax)

barplot!(horsepower, direction = :x)
text!(Point.(horsepower, 1:5), text = cars, align = (:right, :center),
    offset = (-20, 0), color = :white)

f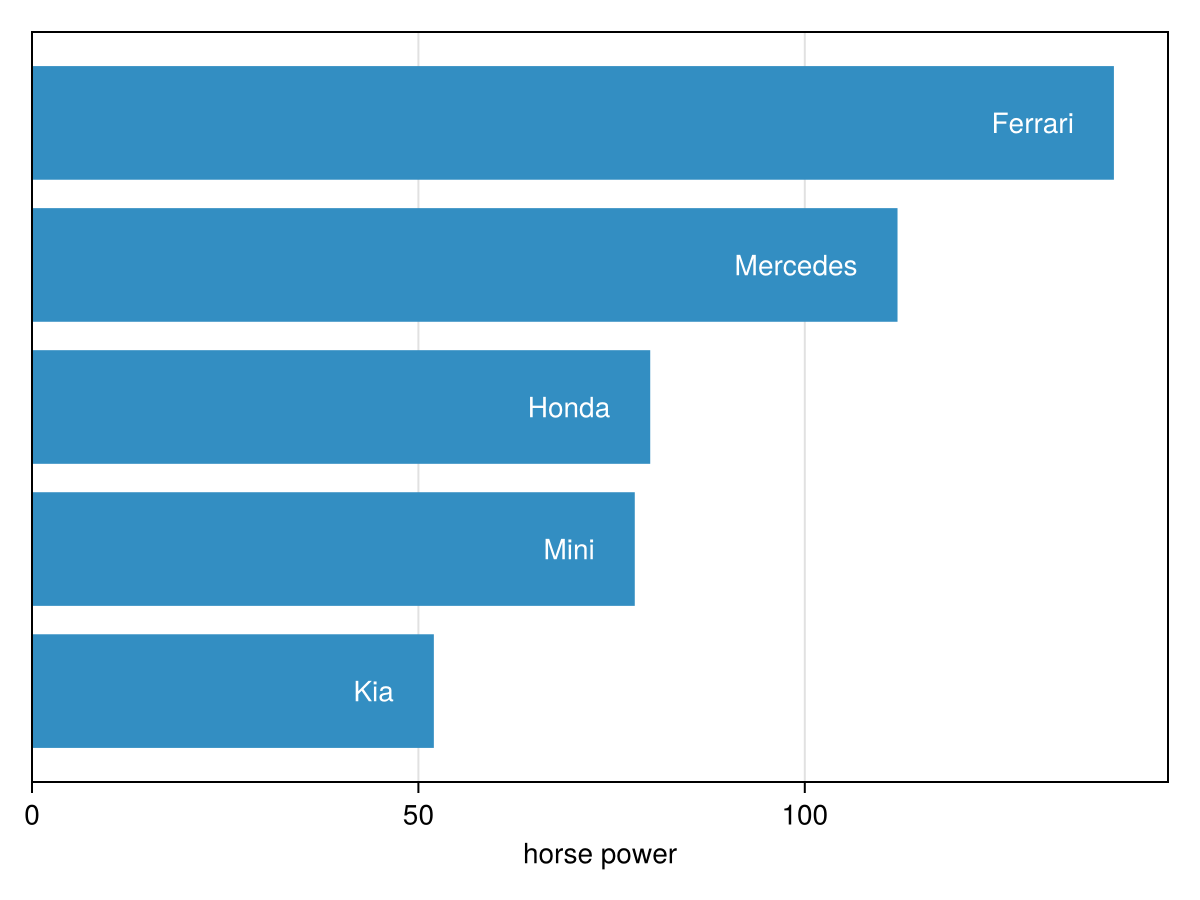
Relative space
The default setting of text is space = :data, which means the final position depends on the axis limits and scaling. However, it can be useful to place text relative to the axis itself, independent of scaling. With space = :relative, the position (0, 0) refers to the lower left corner and (1, 1) the upper right of the Scene that a plot object is in (for an Axis that is equivalent to the plotting area, which is implemented using a Scene).
A common scenario is to place labels within axes:
using CairoMakie
f = Figure()

ax1 = Axis(f[1, 1], limits = (1, 2, 3, 4))
ax2 = Axis(f[1, 2], width = 300, limits = (5, 6, 7, 8))
ax3 = Axis(f[2, 1:2], limits = (9, 10, 11, 12))

for (ax, label) in zip([ax1, ax2, ax3], ["A", "B", "C"])
    text!(
        ax, 0, 1,
        text = label,
        font = :bold,
        align = (:left, :top),
        offset = (4, -2),
        space = :relative,
        fontsize = 24
    )
end

f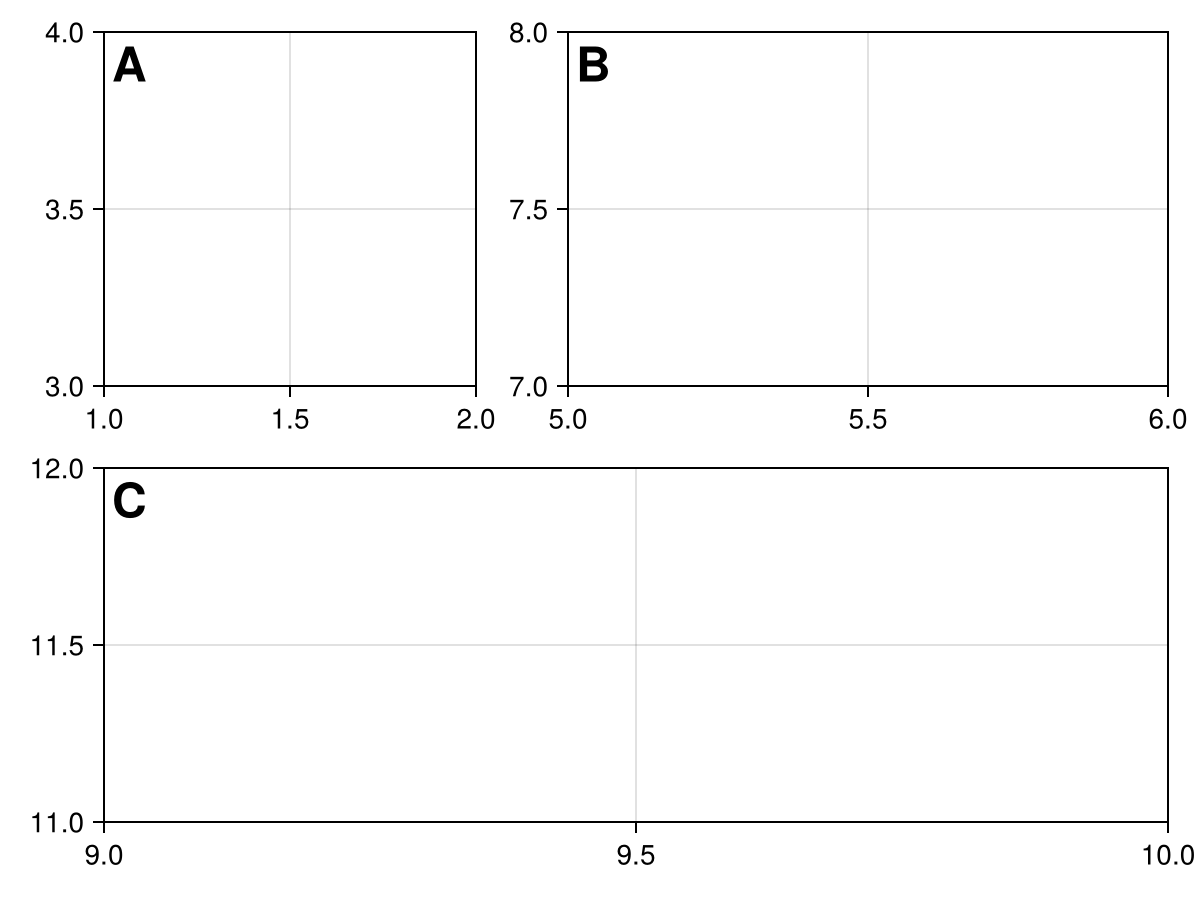
MathTeX
Makie can render LaTeX strings from the LaTeXStrings.jl package using MathTeXEngine.jl.
using CairoMakie
lines(0.5..20, x -> sin(x) / sqrt(x), color = :black)
text!(7, 0.38, text = L"\frac{\sin(x)}{\sqrt{x}}", color = :black)
current_figure()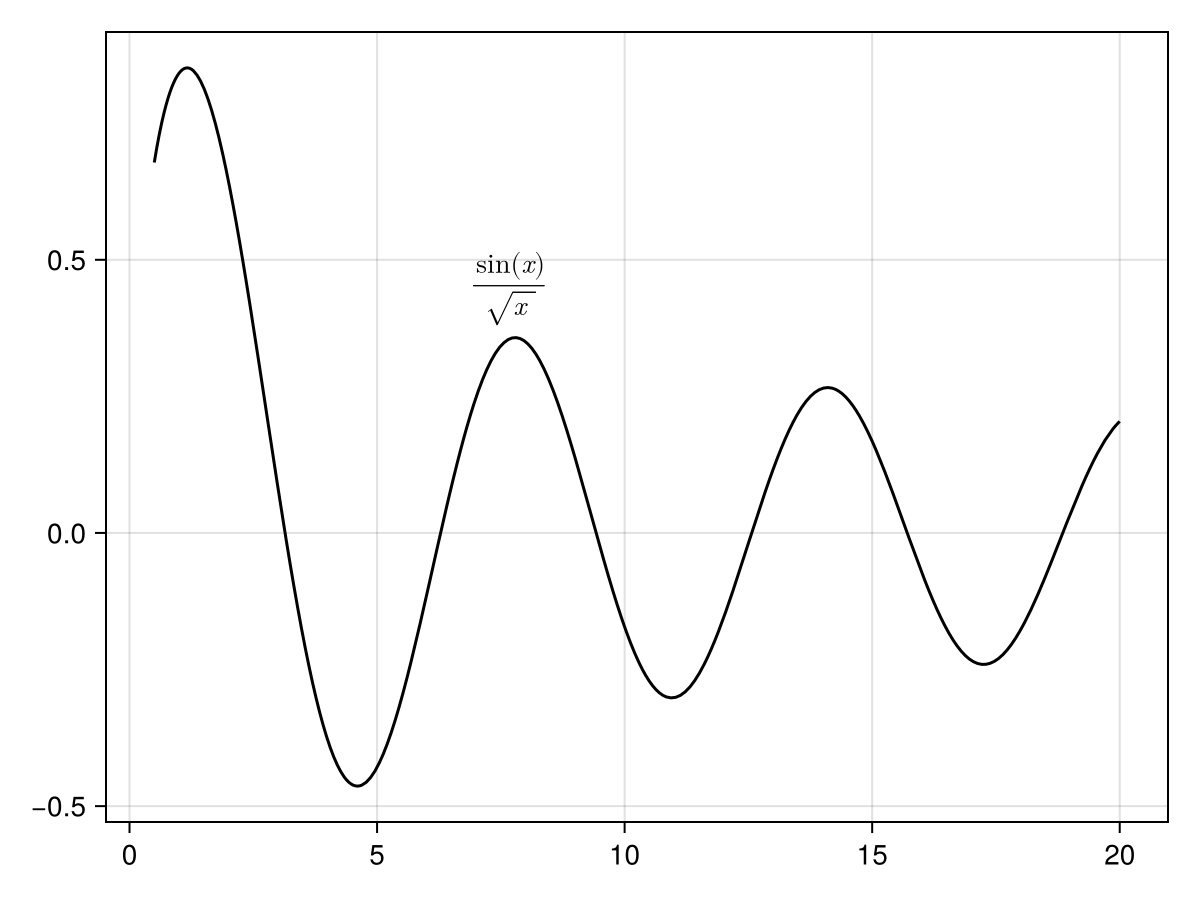
You can also pass L-strings to many objects that use text, for example as labels in the legend.
using CairoMakie
f = Figure()
ax = Axis(f[1, 1])

lines!(0..10, x -> sin(3x) / (cos(x) + 2),
    label = L"\frac{\sin(3x)}{\cos(x) + 2}")
lines!(0..10, x -> sin(x^2) / (cos(sqrt(x)) + 2),
    label = L"\frac{\sin(x^2)}{\cos(\sqrt{x}) + 2}")

Legend(f[1, 2], ax)

f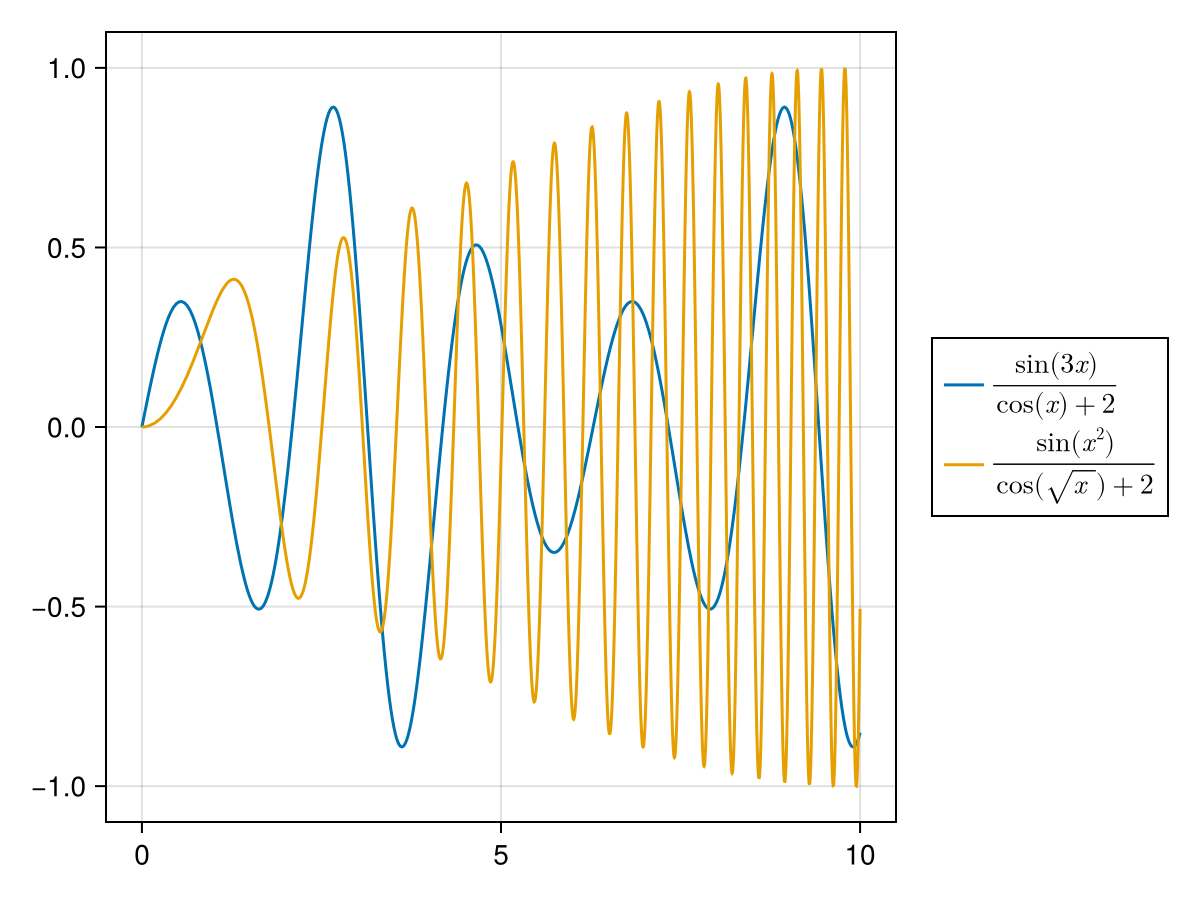
Rich text
With rich text, you can conveniently plot text whose parts have different colors or fonts, and you can position sections as subscripts and superscripts. You can create such rich text objects using the functions rich, superscript, subscript, subsup and left_subsup, all of which create RichText objects.
Each of these functions takes a variable number of arguments (except subsup and left_subsup which take exactly two arguments), each of which can be a String or RichText. Each can also take keyword arguments such as color or font, to set these attributes for the given part. The top-level settings for font, color, etc. are taken from the text attributes as usual.
using CairoMakie
f = Figure(fontsize = 30)
Label(
    f[1, 1],
    rich(
        "H", subscript("2"), "O is the formula for ",
        rich("water", color = :cornflowerblue, font = :italic)
    )
)

str = "A BEAUTIFUL RAINBOW"
rainbow = cgrad(:rainbow, length(str), categorical = true)
fontsizes = 30 .+ 10 .* sin.(range(0, 3pi, length = length(str)))

rainbow_chars = map(enumerate(str)) do (i, c)
    rich("$c", color = rainbow[i], fontsize = fontsizes[i])
end

Label(f[2, 1], rich(rainbow_chars...), font = :bold)

Label(f[3, 1], rich("Chemists use notations like ", left_subsup("92", "238"), "U or PO", subsup("4", "3−")))

f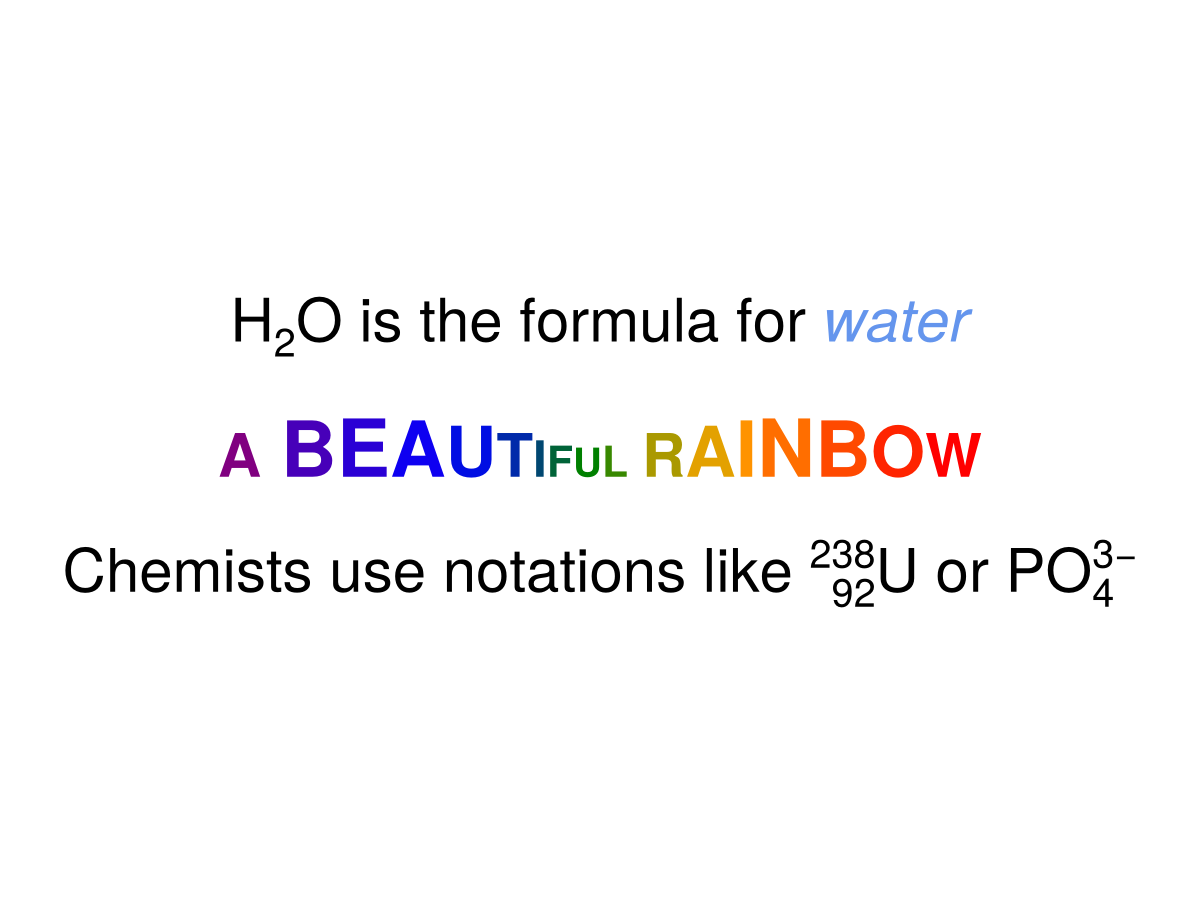
Tweaking offsets
Sometimes, when using regular and italic fonts next to each other, the gaps between glyphs are too narrow or too wide. You can use the offset value for rich text to shift glyphs by an amount proportional to the fontsize.
using CairoMakie
f = Figure(fontsize = 30)
Label(
    f[1, 1],
    rich(
        "ITALIC",
        superscript("Regular without x offset", font = :regular),
        font = :italic
    )
)

Label(
    f[2, 1],
    rich(
        "ITALIC",
        superscript("Regular with x offset", font = :regular, offset = (0.15, 0)),
        font = :italic
    )
)

f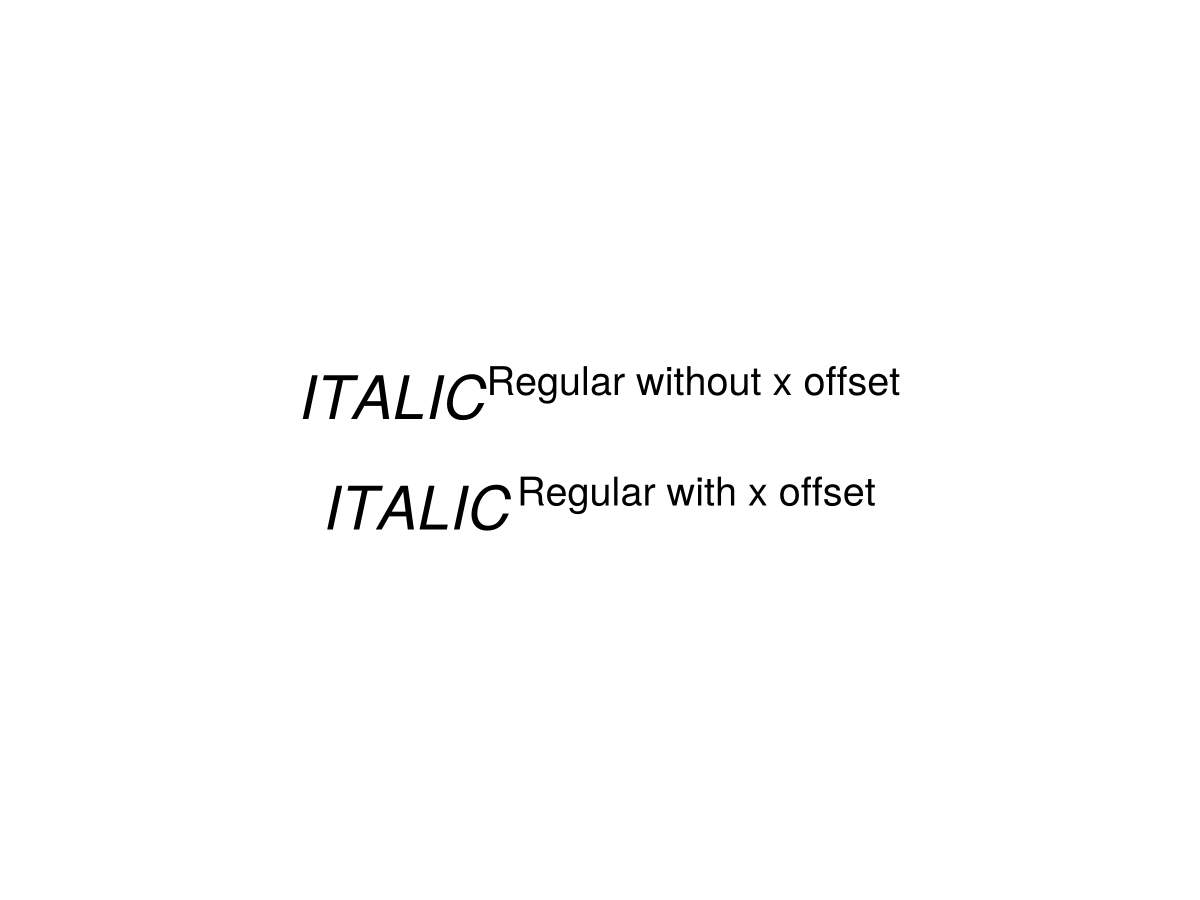
Attributes
align
Defaults to (:left, :bottom)
Sets the alignment of the string w.r.t. position. Uses :left, :center, :right, :top, :bottom, :baseline or fractions.
alpha
Defaults to 1.0
The alpha value of the colormap or color attribute. Multiple alphas like in plot(alpha=0.2, color=(:red, 0.5), will get multiplied.
clip_planes
Defaults to @inherit clip_planes automatic
Clip planes offer a way to do clipping in 3D space. You can set a Vector of up to 8 Plane3f planes here, behind which plots will be clipped (i.e. become invisible). By default clip planes are inherited from the parent plot or scene. You can remove parent clip_planes by passing Plane3f[].
color
Defaults to @inherit textcolor
Sets the color of the text. One can set one color per glyph by passing a Vector{<:Colorant}, or one colorant for the whole text. If color is a vector of numbers, the colormap args are used to map the numbers to colors.
colormap
Defaults to @inherit colormap :viridis
Sets the colormap that is sampled for numeric colors. PlotUtils.cgrad(...), Makie.Reverse(any_colormap) can be used as well, or any symbol from ColorBrewer or PlotUtils. To see all available color gradients, you can call Makie.available_gradients().
colorrange
Defaults to automatic
The values representing the start and end points of colormap.
colorscale
Defaults to identity
The color transform function. Can be any function, but only works well together with Colorbar for identity, log, log2, log10, sqrt, logit, Makie.pseudolog10, Makie.Symlog10, Makie.AsinhScale, Makie.SinhScale, Makie.LogScale, Makie.LuptonAsinhScale, and Makie.PowerScale.
depth_shift
Defaults to 0.0
Adjusts the depth value of a plot after all other transformations, i.e. in clip space, where -1 <= depth <= 1. This only applies to GLMakie and WGLMakie and can be used to adjust render order (like a tunable overdraw).
font
Defaults to @inherit font
Sets the font. Can be a Symbol which will be looked up in the fonts dictionary or a String specifying the (partial) name of a font or the file path of a font file
fonts
Defaults to @inherit fonts
Used as a dictionary to look up fonts specified by Symbol, for example :regular, :bold or :italic.
fontsize
Defaults to @inherit fontsize
The fontsize in units depending on markerspace.
fxaa
Defaults to false
Adjusts whether the plot is rendered with fxaa (fast approximate anti-aliasing, GLMakie only). Note that some plots implement a better native anti-aliasing solution (scatter, text, lines). For them fxaa = true generally lowers quality. Plots that show smoothly interpolated data (e.g. image, surface) may also degrade in quality as fxaa = true can cause blurring.
glowcolor
Defaults to (:black, 0.0)
Sets the color of the glow effect around the text.
glowwidth
Defaults to 0.0
Sets the size of a glow effect around the text.
highclip
Defaults to automatic
The color for any value above the colorrange.
inspectable
Defaults to @inherit inspectable
Sets whether this plot should be seen by DataInspector. The default depends on the theme of the parent scene.
inspector_clear
Defaults to automatic
Sets a callback function (inspector, plot) -> ... for cleaning up custom indicators in DataInspector.
inspector_hover
Defaults to automatic
Sets a callback function (inspector, plot, index) -> ... which replaces the default show_data methods.
inspector_label
Defaults to automatic
Sets a callback function (plot, index, position) -> string which replaces the default label generated by DataInspector.
justification
Defaults to automatic
Sets the alignment of text w.r.t its bounding box. Can be :left, :center, :right or a fraction. Will default to the horizontal alignment in align.
lineheight
Defaults to 1.0
The lineheight multiplier.
lowclip
Defaults to automatic
The color for any value below the colorrange.
markerspace
Defaults to :pixel
Sets the space in which fontsize acts. See Makie.spaces() for possible inputs.
model
Defaults to automatic
Sets a model matrix for the plot. This overrides adjustments made with translate!, rotate! and scale!.
nan_color
Defaults to :transparent
The color for NaN values.
offset
Defaults to (0.0, 0.0)
The offset of the text from the given position in markerspace units.
overdraw
Defaults to false
Controls if the plot will draw over other plots. This specifically means ignoring depth checks in GL backends
position
Defaults to (0.0, 0.0)
Deprecated: Specifies the position of the text. Use the positional argument to text instead.
rotation
Defaults to 0.0
Rotates text around the given position
space
Defaults to :data
Sets the transformation space for box encompassing the plot. See Makie.spaces() for possible inputs.
ssao
Defaults to false
Adjusts whether the plot is rendered with ssao (screen space ambient occlusion). Note that this only makes sense in 3D plots and is only applicable with fxaa = true.
strokecolor
Defaults to (:black, 0.0)
Sets the color of the outline around a marker.
strokewidth
Defaults to 0
Sets the width of the outline around a marker.
text
Defaults to ""
Specifies one piece of text or a vector of texts to show, where the number has to match the number of positions given. Makie supports String which is used for all normal text and LaTeXString which layouts mathematical expressions using MathTeXEngine.jl.
transform_marker
Defaults to false
Controls whether the model matrix (without translation) applies to the glyph itself, rather than just the positions. (If this is true, scale! and rotate! will affect the text glyphs.)
transformation
Defaults to :automatic
Controls the inheritance or directly sets the transformations of a plot. Transformations include the transform function and model matrix as generated by translate!(...), scale!(...) and rotate!(...). They can be set directly by passing a Transformation() object or inherited from the parent plot or scene. Inheritance options include:
:automatic: Inherit transformations if the parent and childspaceis compatible:inherit: Inherit transformations:inherit_model: Inherit only model transformations:inherit_transform_func: Inherit only the transform function:nothing: Inherit neither, fully disconnecting the child's transformations from the parent
Another option is to pass arguments to the transform!() function which then get applied to the plot. For example transformation = (:xz, 1.0) which rotates the xy plane to the xz plane and translates by 1.0. For this inheritance defaults to :automatic but can also be set through e.g. (:nothing, (:xz, 1.0)).
transparency
Defaults to false
Adjusts how the plot deals with transparency. In GLMakie transparency = true results in using Order Independent Transparency.
visible
Defaults to true
Controls whether the plot gets rendered or not.
word_wrap_width
Defaults to -1
Specifies a linewidth limit for text. If a word overflows this limit, a newline is inserted before it. Negative numbers disable word wrapping.