Recipes
Recipes allow you to extend Makie with your own custom types and plotting commands.
There are two types of recipes:
Type recipes define a simple mapping from a user defined type to an existing plot type
Full recipes define new custom plotting functions.
Type recipes
Type recipes are mostly just conversions from one type or set of input argument types, yet unknown to Makie, to another which Makie can handle already.
This is the sequential logic by which conversions in Makie are attempted:
Dispatch on
convert_arguments(::PlotType, args...)If no matching method is found, determine a conversion trait via
conversion_trait(::PlotType)Dispatch on
convert_arguments(::ConversionTrait, args...)If no matching method is found, try to convert each single argument recursively with
convert_single_argumentuntil each type doesn't change anymoreDispatch on
convert_arguments(::PlotType, converted_args...)Fail if no method was found
Multiple Argument Conversion with convert_arguments
Plotting of a Circle for example can be defined via a conversion into a vector of points for any existing plot type:
Makie.convert_arguments(::Type{<: AbstractPlot}, x::Circle) = (decompose(Point2f, x),)Warning
convert_arguments must always return a Tuple.
Defining a conversion for every plot type likely won't make sense, so one can restrict the conversion to a subset of plot types, like only for scatter plots:
Makie.convert_arguments(P::Type{<:Scatter}, ::MyType) = convert_arguments(P, rand(10))Conversion traits make it easier to define behavior for a group of plot types that share the same trait. PointBased for example applies to Scatter, Lines, etc. The predefined traits are NoConversion, PointBased, CellGrid <: GridBased, VertexGrid <: GridBased, ImageLike, VolumeLike, ArrowLike and SampleBased. They all inherit from ConversionTrait, sometimes indirectly.
Makie.convert_arguments(::PointBased, ::MyType) = ...It is also possible to convert multiple arguments together.
Makie.convert_arguments(::Type{<:Scatter}, x::MyType, y::MyOtherType) = ...Optionally you may define the default plot type so that plot(x::MyType) will always plot as e.g. a surface plot:
plottype(::MyType) = SurfaceSingle Argument Conversion with convert_single_argument
Some types which are unknown to Makie can be converted to other types, for which convert_arguments methods are available. This is done with convert_single_argument.
For example, AbstractArrays with Reals and missings can usually be safely converted to Float32 arrays with NaNs instead of missings.
The difference between convert_single_argument and convert_arguments with a single argument is that the former can be applied to any argument of any signature, while the latter only matches one-argument signatures.
Full recipes with the @recipe macro
A full recipe comes in two parts. First is the @recipe macro which defines the name of plot type and its default attributes. Optionally the macro can also set names for the converted arguments (i.e. the result of convert_arguments).
Second is at least one custom plot! method for the new plot type which creates an actual visualization using other existing plotting functions.
Recipe Macro
We use an example to show how this works:
@recipe MyPlot (x, y, z) begin
    "Sets the color of the plot"
    plot_color = :red

    colormap = @inherit colormap :viridis

    Makie.mixin_generic_plot_attributes()...
end
Generated Type and Plot Functions
This macro expands to several things. Firstly a type definition:
const MyPlot{ArgTypes} = Plot{myplot, ArgTypes}The type parameter of Plot contains the function myplot instead of e.g. a symbol MyPlot. This way the mapping from MyPlot to myplot is safer and simpler. The following signatures are automatically defined to make MyPlot nice to use:
myplot(args...; kw_args...) = ...
myplot!(args...; kw_args...) = ...
Argument Names
A specialization of argument_names is emitted if you have an argument list provided to the recipe macro. Otherwise a set of default names Symbol(:converted_, i) is used. In our example we provided (x, y, z) and thus get:
argument_names(::Type{<: MyPlot}, N) = (:x, :y, :z)This is optional but it will allow the use of plot_object.x to fetch the first converted argument from the call plot_object = myplot(rand(10), rand(10), rand(10)), for example. Alternatively you can always fetch the ith converted argument using plot_object[i]. If you leave out the (x, y, z) the default version of argument_names will provide plot_object.converted_1 etc. To get the unconverted arguments of the plot, i.e. the rand(10) vectors, plot_object.arg1 etc can be used. Unlike converted argument, their names can not be changed.
Recipe Attributes
The attributes given in the body of @recipe define the possible attributes that can be passed to a plot as well as their default values. Attributes can be defined explicitly by creating them like a variable within the macro scope. If an attribute is preceded by a string, that string will be used as attribute documentation in the docstring of myplot.
@recipe MyPlot begin
    attribute = 1
    "some documentation"
    documented_attribute = 1
end
One can also inherit defaults from the parent scenes scene.theme using @inherit name_in_scene_theme fallback_value.
@recipe MyPlot begin
    # This exists by default
    markersize = @inherit markersize

    # This may not exist so a fallback is needed
    outlinecolor = @inherit outlinecolor :black
end
Attributes can also be included from the output of a function by calling that function within the @recipe scope and splatting ... it. The function needs to return the output of @DocumentedAttributes for this.
function shared_myplot_attributes()
    Makie.@DocumentedAttributes begin
        "Some attribute that is used by multiple recipes"
        shared_attribute1 = 1
        shared_attribute2 = @inherit markersize
    end
end

@recipe MyPlot1 begin
    local_attrib1 = 1
    shared_myplot_attributes()...
    local_attrib2 = 2
end

@recipe MyPlot2 begin
    shared_myplot_attributes()...
end
All the attributes defined in @recipe are eventually collected in default_theme(scene, ::Type{<:MyPlot}). The function resolves the inherited attributes and returns the final set of default attributes.
Axis Utilities
You can control which kind of axis is used for a given plot and/or set of arguments by defining a method of preferred_axis_type(). There are various methods Makie will try to call. The first one that succeeds (does not return nothing) will set the axis type. In the order they are tried in, the methods are:
Makie.preferred_axis_type(::Plot, input_args...)Makie.preferred_axis_type(::Type{<: Plot}, input_args...)Makie.preferred_axis_type(::Plot, converted_args...)Makie.preferred_axis_type(::Type{<: Plot}, converted_args...)Makie.preferred_axis_type(::Plot)Makie.preferred_axis_type(::Type{<: Plot})Makie.preferred_axis_type(input_args...)Makie.preferred_axis_type(converted_args...)Makie.preferred_axis_type(arg)for each argumentMakie.preferred_axis_type(converted)for each converted argument
input_args refer to the (unprocessed) user arguments passed to the plot. convert_args are the argument after expand_dimensions(), convert_arguments() and dim converts have been processed. If none of the methods are defined Makie.Axis will be used as the default.
You can also control the attributes an axis is initialized with by implementing a method of preferred_axis_attributes(). Like above, there are multiple call signatures and the first one that returns a valid result will be chosen. In this case the valid result is a non-empty key-value collection. In call order, the methods are:
Makie.preferred_axis_attributes(AxisType, ::Plot, input_args...)Makie.preferred_axis_attributes(AxisType, ::Plot)Makie.preferred_axis_attributes(AxisType, input_args...)
The AxisType is either set automatically by preferred_axis_type or explicitly by axis = (type = AxisType, ...) when creating the plot. If none of the methods are defined, no plot or argument based defaults will be added when creating the axis.
As an example, we may default MyPlot to use an Axis regardless of the given arguments by implementing
Makie.preferred_axis_type(::MyPlot) = AxisAnd we may set default attributes for when MyPlot creates an Axis by implementing
function Makie.preferred_axis_attributes(::Type{Axis}, ::MyPlot)
    return (
        xgridvisible = false, ygridvisible = false,
        title = "MyPlot", xlabel = "x", ylabel = "y"
    )
end
Warn
The plot passed to these function is only partially initialized. User attributes, default (plot) attributes and arguments are available. Child plots and any computation added by plot!(::Plot) is not yet available. Anything that connects to a parent scene is generally available, but has not yet been updated. This includes transformations, float32convert, dim conversions, attribute cycling and scene based theming.
plot!() Method
As the second part of defining MyPlot, you should implement the actual plotting of the MyPlot object by specializing plot!:
function Makie.plot!(myplot::MyPlot)
    # normal plotting code, building on any previously defined recipes
    # or atomic plotting operations, and adding to the combined `myplot`:
    lines!(myplot, rand(10), color = myplot.plot_color)
    plot!(myplot, myplot.x, myplot.y, myplot.z)
    return myplot # return type doesn't actually matter
end
It's possible to add specializations here, depending on the converted argument types supplied to myplot. For example, to specialize the behavior of myplot(a) when a converts to a 3D array of floating point numbers:
const MyVolume = MyPlot{Tuple{<:AbstractArray{<: AbstractFloat, 3}}}
argument_names(::Type{<: MyVolume}) = (:volume,) # optional, to allow plot[:volume]
function plot!(plot::MyVolume)
    volume!(plot, plot[:volume], colormap = plot[:colormap])
    return plot
end
Attribute and Argument Manipulation
Warning
This applies to Makie 0.24+
Typically you want to transform, combine and extend attributes and arguments before passing them along to other plots. To do this dynamically these operations should react to changes in their inputs and notify their outputs. For this each plot has a ComputeGraph in plot.attributes. The nodes of the graph represent data that can dynamically update, i.e. the inputs and outputs of computations. The edges represent computations, connecting one set of nodes to another. For example, the input arguments and converted arguments are nodes in the graph which are connected by computations.
To register a new computation and produce new (output) nodes you can use
# create a new compute edge
# with [:position, :window] as input nodes (these must already exist)
# with :running_average as the output node (this will be created)
# running the computation defined in the do ... end block
map!(plot.attributes, [:positions, :window], :running_average) do positions, window
    # if the output name is a Symbol, return a value
    # if the output is Symbol[], return a tuple() of values (matching order)
    return [mean(positions[i : i + window]) for i in 1 : length(positions)-window]
end
or the more verbose
# inputs and outputs must always be Vector{Symbol} here
register_computation!(plot.attributes, [:positions, :window], [:running_average]) do inputs, changed, cached
    # first argument is a NamedTuple containing the input data
    positions = inputs.positions
    window = inputs.window

    # changed is a NamedTuple which marks which inputs have updated since the last
    # time this function has been called

    # cached contains the previous result or nothing if no previous result exists

    output = [mean(positions[i : i + window]) for i in 1 : length(positions)-window]

    # The return type should be either a tuple() of the new data, or nothing if
    # the calculation should be discarded
    return (output, )
end
After calling either of these functions, the node running_average will be created. It can be accessed like any other attribute or argument with plot.running_average or plot[:running_average]. It can also be passed to another plot like any other attribute or argument:
@recipe MyPlot (positions, ) begin
    window = 10
end

function Makie.plot!(myplot::MyPlot)
    map!(plot.attributes, [:positions, :window], :running_average) do positions, window
        return [mean(positions[i : i + window]) for i in 1 : length(positions)-window]
    end

    map!(plot.attributes [:positions, :window], :running_variance) do positions, window
        return [var(positions[i : i + window]) for i in 1 : length(positions)-window]
    end

    lines!(myplot, plot.running_average, color = myplot.running_variance)
    return myplot
end
Attribute Passthrough
Warning
This applies to Makie 0.24+
Recipes often include a lot of attributes that simply get passed along to a child plot for customizability. While you can pass them one by one via keyword arguments, you can also pass plot.attributes in their entirety.
function Makie.plot!(myplot::MyPlot)
    lines!(myplot, myplot.attributes, args...; kwargs...)
end
This will result in the child plot picking out and connecting all applicable attributes from myplot.attributes. So in this case attributes like myplot.linewidth and myplot.color would be forwarded to lines. If you want to prevent an attribute from getting forwarded you can explicitly set it as a keyword argument.
function Makie.plot!(myplot::MyPlot)
    lines!(myplot, myplot.attributes, args...; color = myplot.computed_color)
end
With this color would be set by myplot.computed_color and linewidth would still follow from myplot.linewidth
Legacy Attribute and Argument handling
The ComputeGraph was introduced with Makie Version 0.24. The explanations above build on that and are not valid for previous version. Before Makie 0.24 dynamic updating in recipes was handled by Observables. They can still be used, but may run into update synchronization issues, can be harder to debug and may perform worse. The code above can be translated to:
@recipe MyPlot (positions, ) begin
    window = 10
end

function Makie.plot!(myplot::MyPlot)
    # individual map() calls will cause synchronization issues in lines, as
    # colors and positions must match in length. To work around this we do
    # ovs.val updates
    running_average = Observable(Float32[])
    running_variance = Observable(Float32[])

    onany(myplot, myplot.position, myplot.window) do positions, window
        running_average.val = [mean(positions[i : i + window]) for i in 1 : length(positions)-window]
        running_variance.val = [var(positions[i : i + window]) for i in 1 : length(positions)-window]
        notify(running_average)
        notify(running_variance)
        return
    end

    lines!(myplot, plot.running_average, color = myplot.running_variance)
    return myplot
end
Passing plot.attributes to a child plot is incompatible between versions, as those attributes take priority over keyword arguments before 0.24. To be compatible with 0.24 attributes need to be passed as keyword arguments explicitly.
Example: Stock Chart
Let's say we want to visualize stock values with the classic open / close and low / high combinations. In this example, we will create a special type to hold this information, and a recipe that can plot this type.
First, we make a struct to hold the stock's values for a given day:
using CairoMakie

struct StockValue{T<:Real}
    open::T
    close::T
    high::T
    low::T
end
Now we create a new plot type called StockChart. In this case the default attributes just define colors for stocks going up and down.
@recipe StockChart begin
    downcolor = :red
    upcolor = :green
end
Then we get to the meat of the recipe, which is actually creating a plot method. We need to overload a specific method of Makie.plot! which as its argument has a subtype of our new StockChart plot type. Its type parameter is a Tuple type of the converted argument types for which this method should work.
Note that because Makie processes plot arguments and attributes dynamically, we need to write our plot method in a dynamic way as well. This can be a bit trickier than recipes you might know from other plotting packages which produce mostly static plots.
function Makie.plot!(
        sc::StockChart{<:Tuple{AbstractVector{<:Real}, AbstractVector{<:StockValue}}})

    # We use the two converted arguments as input nodes for our computation.
    # These match the types in the tuple above, i.e.
    # AbstractVector{<: Real}, AbstractVector{<: StockValue}
    input_nodes = [:converted_1, :converted_2]

    # As outputs we want to compute data for `linesegments` and `barplot`
    output_nodes = [:linesegments, :bar_tos, :color, :barpos]

    # This will register a computation in the graph, which connects a new set of
    # output_nodes to the given input_nodes in a way that can dynamically update.
    map!(sc.attributes, input_nodes, output_nodes) do times, stockvalues
        # Note that the order of inputs and outputs must match the order of
        # input_nodes and output_nodes respectively

        linesegments = Point2f[]
        for (t, s) in zip(times, stockvalues)
            push!(linesegments, Point2f(t, s.low))
            push!(linesegments, Point2f(t, s.high))
        end

        barpos = [Point2f(t, s.open) for (t, s) in zip(times, stockvalues)]
        bar_tos = [s.close for s in stockvalues]
        colors = [x.close > x.open for x in stockvalues]

        return (linesegments, bar_tos, colors, barpos)
    end

    # For colors we use a vector of booleans, which are interpreted as numbers
    # and thus get colored based on the colormap. To get the correct colors we
    # build a colormap containing just `downcolor` and `upcolor` here
    map!((dc, uc) -> [dc, uc], sc.attributes, [:downcolor, :upcolor], :colormap)

    # Now we define how the StockChart is visualized through other plot types.
    # For this we pass the nodes we added to the StockChart plot:
    linesegments!(sc, sc.linesegments, color = sc.color, colormap = sc.colormap)

    # We can also pass the graph directly, which will cause the child plot
    # (barplot) to connect the correctly named attributes (color and colormap)
    # on its own
    barplot!(sc, sc.attributes, sc.barpos, fillto = sc.bar_tos, strokewidth = 0)

    return sc
end
Finally, let's try it out and plot some stocks:
timestamps = 1:100

# we create some fake stock values in a way that looks pleasing later
startvalue = StockValue(0.0, 0.0, 0.0, 0.0)
stockvalues = foldl(timestamps[2:end], init = [startvalue]) do values, t
    open = last(values).close + 0.3 * randn()
    close = open + randn()
    high = max(open, close) + rand()
    low = min(open, close) - rand()
    push!(values, StockValue(
        open, close, high, low
    ))
end

# now we can use our new recipe
f = Figure()

stockchart(f[1, 1], timestamps, stockvalues)

# and let's try one where we change our default attributes
stockchart(f[2, 1], timestamps, stockvalues,
    downcolor = :purple, upcolor = :orange)
f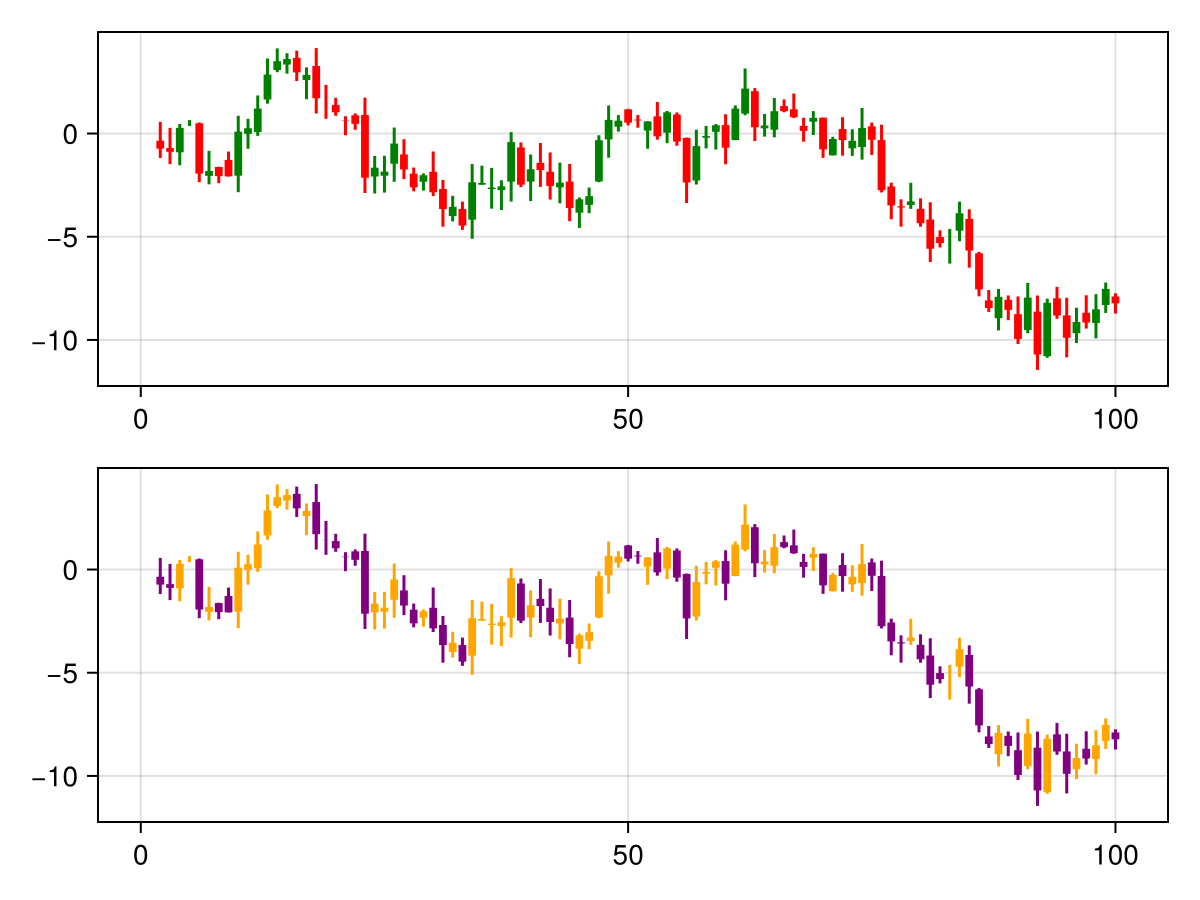
As a last example, lets pretend our stock data is coming in dynamically and we want to create an animation out of it. This is easy if we use observables as input arguments which we then update frame by frame:
using GLMakie
timestamps = collect(1:100)
stocknode = stockvalues

fig, ax, sc = stockchart(timestamps, stocknode)

record(fig, "stockchart_animation.mp4", 101:200,
        framerate = 30) do t
    # push a new timestamp
    push!(timestamps, t)

    # push a new StockValue
    old = last(stocknode)
    open = old.close + 0.3 * randn()
    close = open + randn()
    high = max(open, close) + rand()
    low = min(open, close) - rand()
    new = StockValue(open, close, high, low)
    push!(stocknode, new)

    # now that both timestamps and stocknode are updated and synchronized
    # we can update the plot
    update!(sc, arg1 = timestamps, arg2 = stocknode)
    # let's also update the axis limits because the plot will grow
    # to the right
    autolimits!(ax)
end
Projecting in Recipes
In a complex recipe you may need to apply transformation or projections to plot data. For this, Makie has the register_projected_positions!() helper function. See Projecting in Recipes for more information.
Makie Package Extension
For a simple example of a package extension for Makie, see https://github.com/jkrumbiegel/MakiePkgExtTest. The following documentation explains the basics of the implementation in the linked example.
Set up your package extension to have Makie as a dependency, not any of the Makie backends.
You'll have to define and export your full recipe functions in your main package, for example:
module SomePackage

export someplot
export someplot!

# functions with no methods
function someplot end
function someplot! end

end # module
and then your Makie extension package will add methods to someplot!.
module MakieExtension

using SomePackage
import SomePackage: someplot, someplot!

Makie.convert_single_argument(v::SomeVector) = v.v

@recipe(SomePlot) do scene
    Theme()
end

function Makie.plot!(p::SomePlot)
    lines!(p, p[1])
    scatter!(p, p[1])
    return p
end

end # module
See the linked example above for more functionalities such as accommodating for both extensions and Requires.jl, or providing error hints for plotting functions that don't yet have methods, or setting up your Project.toml.