Dimension conversions
Starting with Makie v0.21, support for types like units, categorical values and dates has been added. They are converted to a plottable representation by dim(ension) converts, which also take care of axis ticks. In the following sections we will explain their usage and how to extend the interface with your own types.
Examples
The basic usage is as easy as replacing numbers with any supported type, e.g. Dates.Second:
using CairoMakie
using CairoMakie, Makie.Dates, Makie.Unitful

f, ax, pl = scatter(rand(Second(1):Second(60):Second(20*60), 10))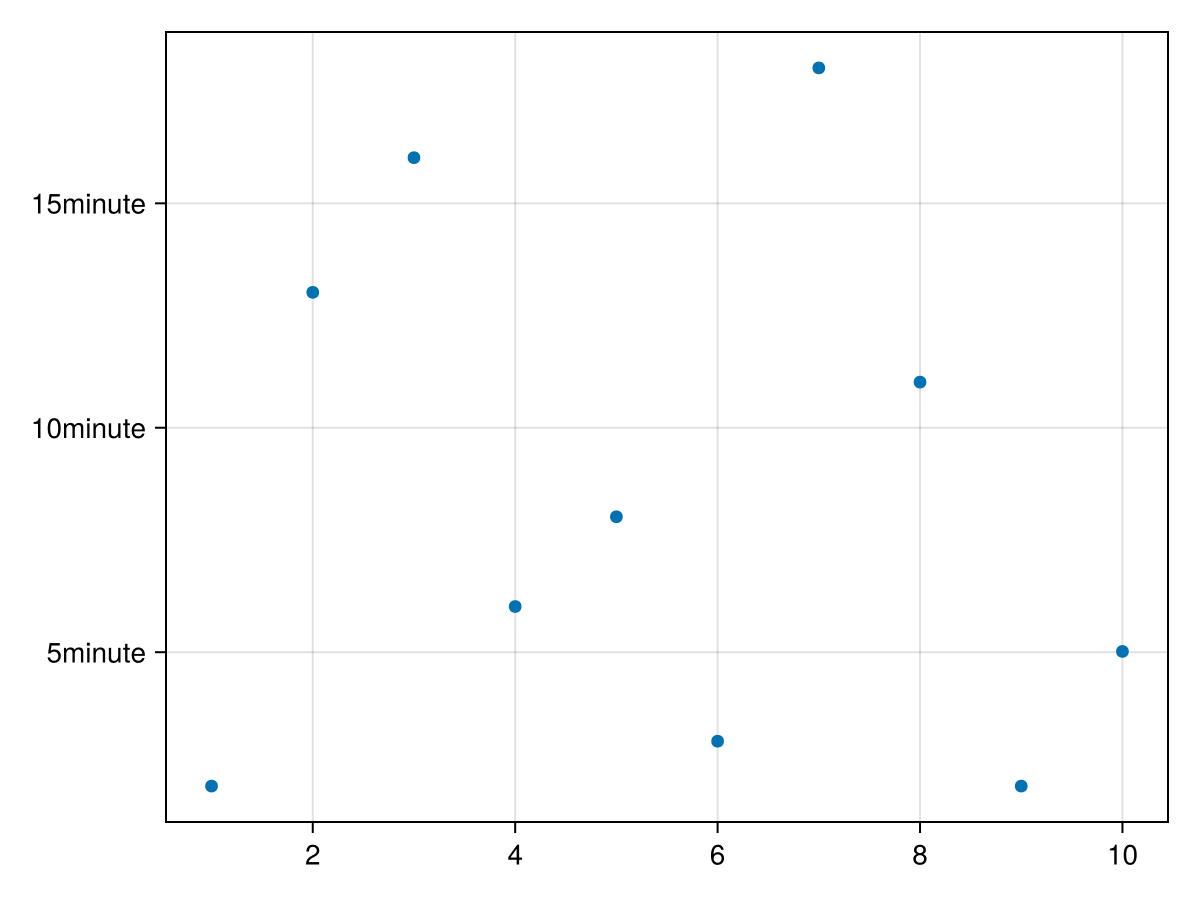
Once an axis dimension is set to a certain unit, one must plot into that axis with compatible units. So e.g. hours work, since they're compatible with the unitful conversion:
scatter!(ax, rand(Hour(1):Hour(1):Hour(20), 10))
# Unitful works as well
scatter!(ax, LinRange(0u"yr", 0.1u"yr", 5))
f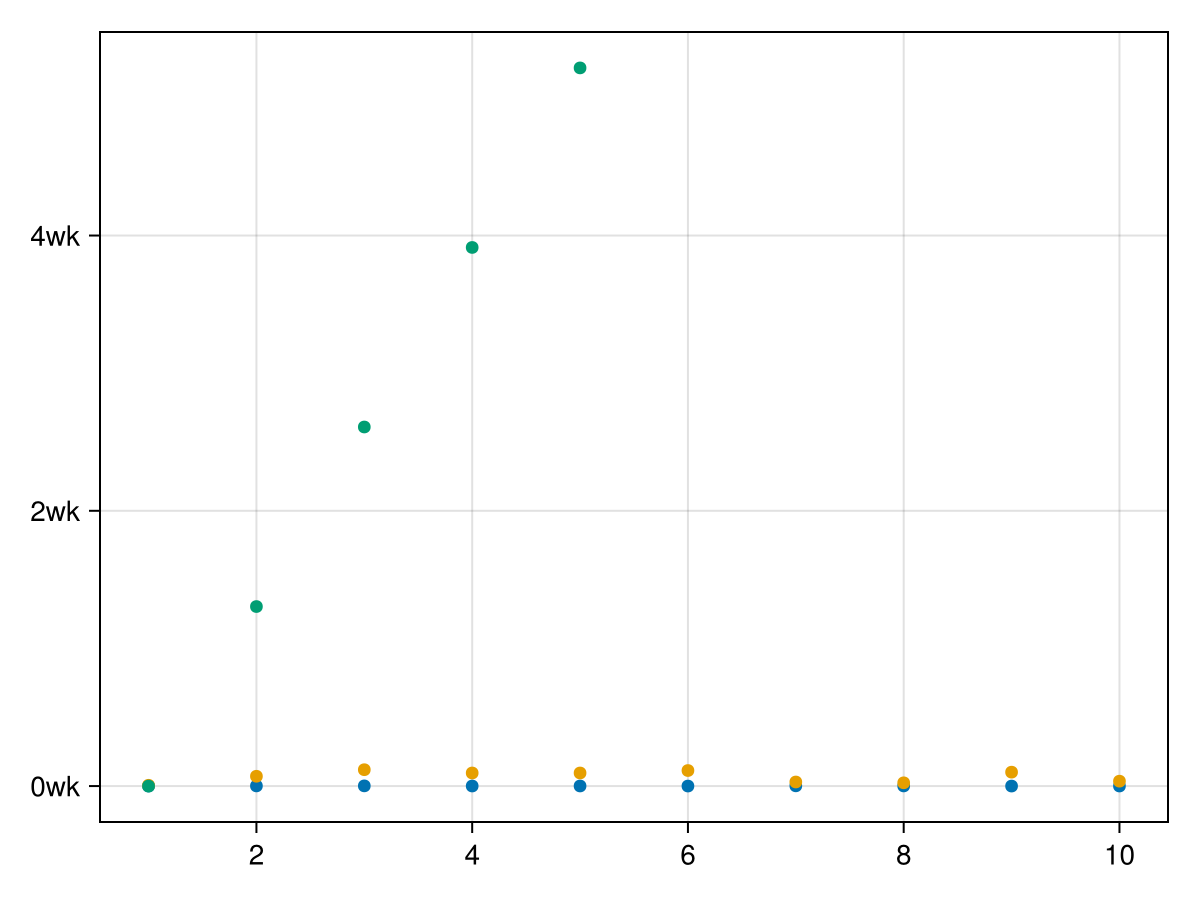
Note that the units displayed in ticks will adjust to the given range of values.
Going back to just numbers errors since the axis is unitful now:
try
    scatter!(ax, 1:4)
catch e
    return e
end
Similarly, trying to plot units into a unitless axis dimension errors too, since otherwise it would alter the meaning of the previous plotted values:
try
    scatter!(ax, LinRange(0u"yr", 0.1u"yr", 10), rand(Hour(1):Hour(1):Hour(20), 10))
catch e
    return e
end
you can access the conversion via ax.dim1_conversion and ax.dim2_conversion:
(ax.dim1_conversion[], ax.dim2_conversion[])And set them accordingly:
f = Figure()
ax = Axis(f[1, 1]; dim1_conversion=Makie.CategoricalConversion())
Experimental DynamicQuantities.jl support
Warning
This feature might change outside breaking releases, since the API is not yet finalized
Makie also provides support for DynamicQuantities.jl. This can used almost as a drop-in replacement for Unitful.jl, with the following key design differences:
There is no conversion support between Dates.jl and DynamicQuantities.jl objects. Use
1.0u"hr"in place ofDates.Hour(1.0),1.0u"d"in place ofDates.day(1.0), etc.Units are set by the first object plotted by default. This is to prevent unexpected changes to other units when plotting multiple objects on the same axis.
Units are displayed in SI be default. Use
us"<desired unit>"(note thes) to explicitly set your desired units, either implicitly in a plot call or explicitly as adim_conversionaxis argument.
Below are a few common usage examples to construct the same plot. Please file a bug report if you find an issue with this experimental feature!
using CairoMakie
using DynamicQuantities

# Implicitly define figure, axis, and units
f, ax, pl = scatter((100:100:1_000)us"cm")
scatter!(ax, (10:-1:1)u"m")

# Implicitly define axis and units
scatter(f[1, 2], (100:100:1_000)us"cm")
scatter!(f[1, 2], (10:-1:1)u"m")

# Explicitly define axis, implicitly define units
ax3 = Axis(f[2, 1])
scatter!(ax3, (100:100:1_000)us"cm") # The first plot sets the units
scatter!(ax3, (10:-1:1)u"m")

# Explicitly define axis and units
ax4 = Axis(f[2, 2]; dim2_conversion=Makie.DQConversion(us"cm"))
scatter!(ax4, (100:100:1_000)u"cm") # No need for us"cm" now
scatter!(ax4, (10:-1:1)u"m")

f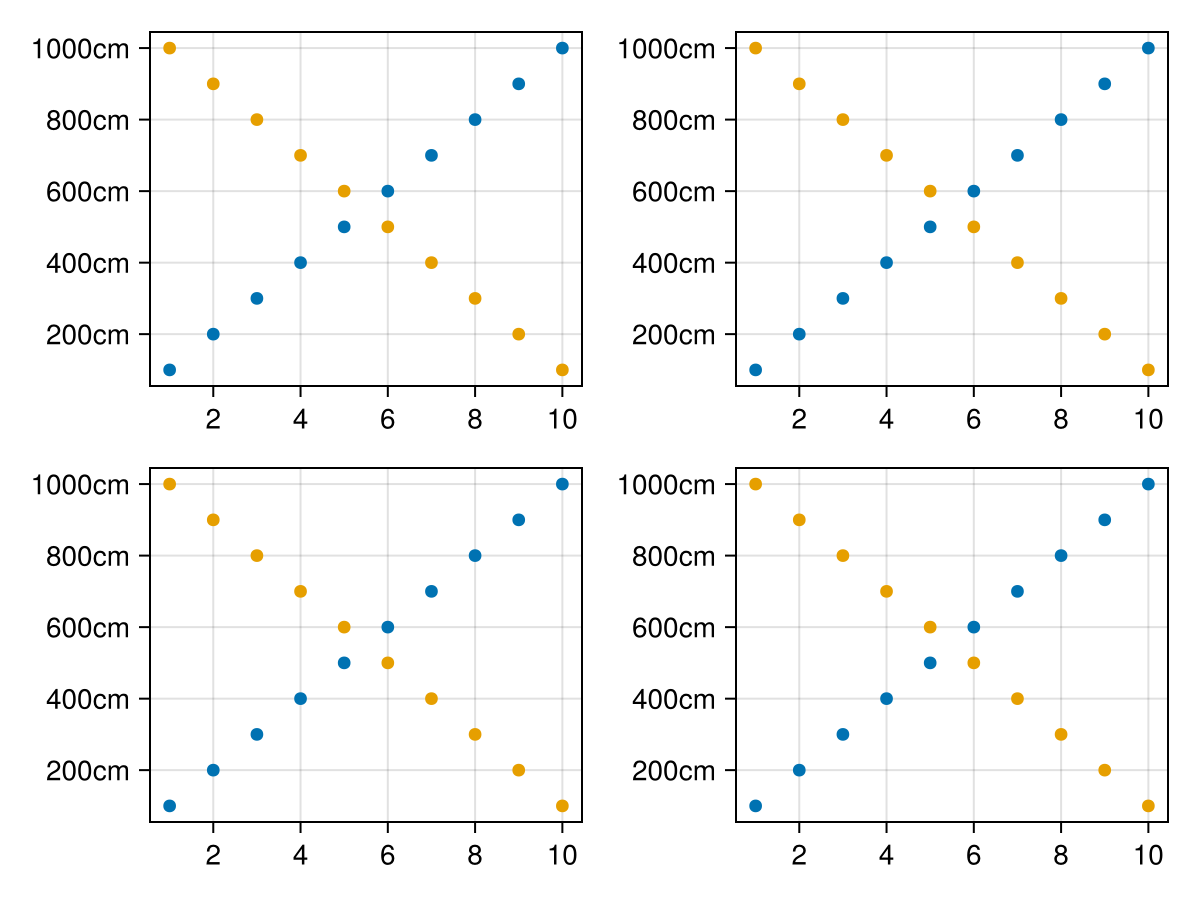
Limitations
For now, dim conversions only works for vectors with supported types for the x and y arguments for the standard 2D Axis. It's setup to generalize to other Axis types, but the full integration hasn't been done yet.
Keywords like
direction=:yin e.g. Barplot will not propagate to the Axis correctly, since the first argument is currently always x and second always y. We're still trying to figure out how to solve this properlyCategorical values need to be wrapped in
Categorical, since it's hard to find a good type that isn't ambiguous when defaulting to a categorical conversion. You can find a work around in the docs.Date Time ticks simply use
PlotUtils.optimize_datetime_tickswhich is also used by Plots.jl. It doesn't generate optimally readable ticks yet and can generate overlaps and goes out of axis bounds quickly. This will need more polish to create readable ticks as default.To properly apply dim conversions only when applicable, one needs to use the new undocumented
@recipemacro and define a conversion target type. This means user recipes only work if they pass through the arguments to any basic plotting type without conversion.
Current conversions in Makie
Makie.CategoricalConversion Type
CategoricalConversion(; sortby=identity)Categorical conversion. Gets chosen automatically only for Categorical(array_of_objects) and Enums right now. The categories work with any sortable value though, so one can always do Axis(fig; dim1_conversion=CategoricalConversion()), to use it for other categories. One can use CategoricalConversion(sortby=func), to change the sorting, or make unsortable objects sortable.
Examples
# Ticks get chosen automatically as categorical
scatter(1:4, Categorical(["a", "b", "c", "a"]))# Explicitly set them for other types:
struct Named
value
end
Base.show(io::IO, s::SomeStruct) = println(io, "[$(s.value)]")
conversion = Makie.CategoricalConversion(sortby=x->x.value)
barplot(Named.([:a, :b, :c]), 1:3, axis=(dim1_conversion=conversion,))Makie.UnitfulConversion Type
UnitfulConversion(unit=automatic; units_in_label=false)Allows to plot arrays of unitful objects into an axis.
Arguments
unit=automatic: sets the unit as conversion target. If left at automatic, the best unit will be chosen for all plots + values plotted to the axis (e.g. years for long periods, or km for long distances, or nanoseconds for short times).units_in_label=true: controls, whether plots are shown in the label_prefix of the axis labels, or in the tick labels
Examples
using Unitful, CairoMakie

# UnitfulConversion will get chosen automatically:
scatter(1:4, [1u"ns", 2u"ns", 3u"ns", 4u"ns"])
Fix unit to always use Meter & display unit in the ylabel:
uc = Makie.UnitfulConversion(u"m"; units_in_label=false)
scatter(1:4, [0.01u"km", 0.02u"km", 0.03u"km", 0.04u"km"]; axis=(dim2_conversion=uc, ylabel="y (m)"))Makie.DQConversion Type
DQConversion(unit=automatic; units_in_label=false)Allows to plot arrays of DynamicQuantity objects into an axis.
Arguments
units_in_label=true: controls, whether plots are shown in the label_prefix of the axis labels, or in the tick labels
Examples
using DynamicQuantities, CairoMakie

scatter(1:4, [1u"ns", 2u"ns", 3u"ns", 4u"ns"])
Fix unit to always use Meter & display unit in the xlabel:
dqc = Makie.DQConversion(us"m"; units_in_label = false)

scatter(1:4, [0.01u"km", 0.02u"km", 0.03u"km", 0.04u"km"]; axis=(dim2_conversion=dqc, xlabel="x (km)"))Makie.DateTimeConversion Type
DateTimeConversion(type=Automatic; k_min=automatic, k_max=automatic, k_ideal=automatic)Creates conversion and conversions for Date, DateTime and Time. For other time units one should use UnitfulConversion, which work with e.g. Seconds.
For DateTimes PlotUtils.optimize_datetime_ticks is used for getting the conversion, otherwise axis.(x/y)ticks are used on the integer representation of the date.
Arguments
type=automatic: when left at automatic, the first plot into the axis will determine the type. Otherwise, one can set this toTimeorDateTime.
Examples
date_time = DateTime("2021-10-27T11:11:55.914")
date_time_range = range(date_time, step=Week(5), length=10)
# Automatically choose xticks as DateTimeTicks:
scatter(date_time_range, 1:10)

# explicitly choose DateTimeConversion and use it to plot unitful values into it and display in the `Time` format:
using Makie.Unitful
conversion = Makie.DateTimeConversion(Time)
scatter(1:4, (1:4) .* u"s", axis=(dim2_conversion=conversion,))Developer docs
You can overload the API to define your own dim converts by overloading the following functions:
struct MyDimConversion <: Makie.AbstractDimConversion end

# The type you target with the dim conversion
struct MyUnit
    value::Float64
end

# This is currently needed because `expand_dimensions` can only be narrowly defined for `Vector{<:Real}` in Makie.
# So, if you want to make `plot(some_y_values)` work for your own types, you need to define this method:
Makie.expand_dimensions(::PointBased, y::AbstractVector{<:MyUnit}) = (keys(y.values), y)

function Makie.needs_tick_update_observable(conversion::MyDimConversion)
    # return an observable that indicates when ticks need to update e.g. in case the unit changes or new categories get added.
    # For a simple unit conversion this is not needed, so we return nothing.
    return nothing
end

# Indicate that this type should be converted using MyDimConversion
# The Type gets extracted via `Makie.get_element_type(plot_argument_for_dim_n)`
# so e.g. `plot(1:10, ["a", "b", "c"])` would call `Makie.get_element_type(["a", "b", "c"])` and return `String` for axis dim 2.
Makie.create_dim_conversion(::Type{MyUnit}) = MyDimConversion()

# This function needs to be overloaded too, even though it's redundant to the above in a sense.
# We did not want to use `hasmethod(Makie.should_dim_convert, (MyDimTypes,))` because it can be slow and error prown.
Makie.should_dim_convert(::Type{MyUnit}) = true

# The non observable version of the actual conversion function
# This is needed to convert axis limits, and should be a pure version of the below `convert_dim_observable`
function Makie.convert_dim_value(::MyDimConversion, values)
    return [v.value for v in values]
end

function Makie.convert_dim_value(conversion::MyDimConversion, attr, values, prev_values)
    # Do the actual conversion here
    # The `attr` can be used to identify the conversion, e.g. if you want to cache results.
    # Take a look at categorical-integration.jl for an example of how to use it.
    return Makie.convert_dim_value(conversion, values)
end

function Makie.get_ticks(::MyDimConversion, user_set_ticks, user_dim_scale, user_formatter, limits_min, limits_max)
    # Don't do anything special to ticks for this example, just append `myunit` to the labels and leave the rest to Makie's usual tick finding methods.
    ticknumbers, ticklabels = Makie.get_ticks(user_set_ticks, user_dim_scale, user_formatter, limits_min,
                                        limits_max)
    return ticknumbers, ticklabels .* "myunit"
end

barplot([MyUnit(1), MyUnit(2), MyUnit(3)], 1:3)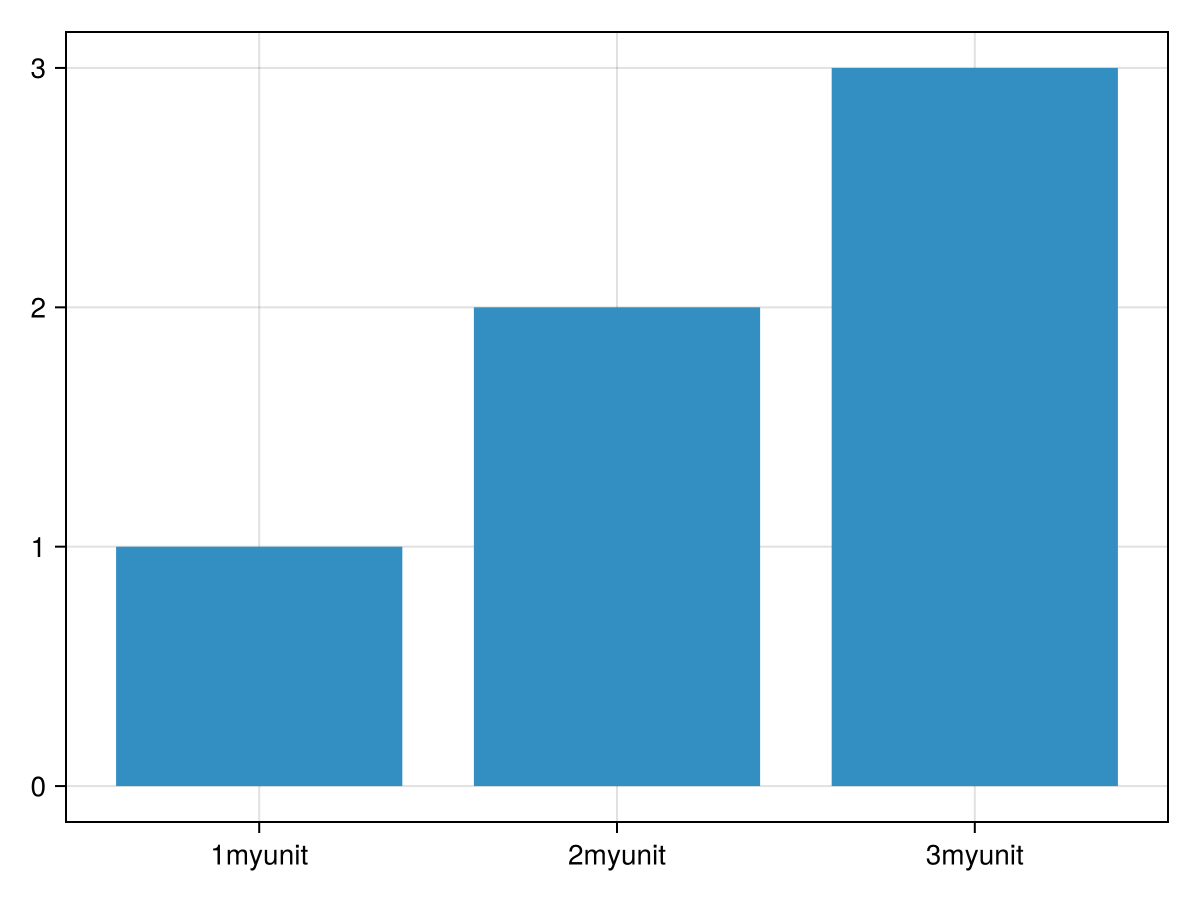
For more complex examples, you should look at the implementation in: Makie/src/dim-converts.
The conversions get applied in the function Makie.conversion_pipeline in Makie/src/interfaces.jl.