SpecApi
Warning
The SpecApi is still under active development and might introduce breaking changes quickly in the future. It's also slower for animations than using the normal Makie API, since it needs to re-create plots often and needs to go over the whole plot tree to find different values. While the performance will always be slower than directly using Observables to update attributes, it's still not much optimized so we expect to improve it in the future. You should also expect bugs, since the API is still very new while offering lots of new and complex functionality. Don't hesitate to open issues if you run into unexpected behaviour. PRs are also more than welcome, the code isn't actually that complex and should be easy to dive into (src/basic_recipes/specapi.jl).
What is the SpecApi?
Starting with version 0.20, Makie supports the creation of plots and figures through specification or "spec" objects. These objects are declarative versions of familiar objects like Axis, Colorbar, Scatter or Heatmap. Declarative means that these objects do not implement any of the complex internal machinery needed for interactive, stateful plotting. Instead, they are simply descriptions which Makie then converts into the full objects for you.
Why is this useful?
Spec objects are lightweight and easy to compose into larger structures without having to build those up step by step. This makes it possible to glue together subfigures returned from different functions, instead of having these functions mutatingly plot into the same existing parent Figure. You can also plot observable spec objects into a given Figure and when you change the description, the whole subfigure updates or rebuilds itself automatically, trying to preserve existing structures where possible through the use of diffing. This can make building dashboards or smaller interactive apps much easier because the user has to keep track of less state. On the flip side, diffing introduces a performance overhead and will in general not be as fast as using Makie's mutating API directly.
You can create spec objects with the Makie.SpecApi object. There are mainly two types of specs, PlotSpecs and BlockSpecs, corresponding to plot objects like Scatter or Heatmap, and Block objects like Axis or Colorbar.
The API is supposed to be similar to the normal API, just declarative. Complex specs are built by nesting simpler specs inside each other. The convention is to always use the S prefix when creating spec objects, so they can't be confused with their counterparts from the standard API.
import Makie.SpecApi as S

scatterspec = S.Scatter(1:4) # a PlotSpec describing a Scatter plot
axspec = S.Axis(plots=[scatterspec]) # a BlockSpec describing an Axis with a Scatter plot
layout_spec = S.GridLayout(axspec) # a Layout describing a Figure with an Axis with a Scatter plot

# Now we can instantiate the spec into a fully realized Figure.
# Note that the output type from `plot` is currently, a bit confusingly, a
# FigureAxisPlot type, which does not really fit because `pl` is not a normal plot
# and there can be zero or many axes in the figure.
# This will be changed in future iterations.
f, _, pl = plot(layout_spec)

# By updating the input observable of `pl`, our "plot" object, we can
# update all the content in the Figure with something new. In this case,
# we just change the plot type in the Axis from Scatter to Lines, and the
# axis title to "Lines".
pl[1] = S.GridLayout(S.Axis(; title="Lines", plots=[S.Lines(1:4)]))
You can not only plot specs describing whole layout, but also specs describing Blocks or just single plots.
s = Makie.PlotSpec(:Scatter, 1:4; color=:red)
axis = Makie.BlockSpec(:Axis; title="Axis at layout position (1, 1)")
Building layouts for specs
To build layouts quickly, you can pass column vectors, row vectors or matrices of block specs to S.GridLayout. If you need more control over the layout, you can specify row and column sizes and gaps directly.
using GLMakie
using DelimitedFiles
using Makie.FileIO
import Makie.SpecApi as S
using Random

Random.seed!(123)

volcano = readdlm(Makie.assetpath("volcano.csv"), ',', Float64)
brain = load(assetpath("brain.stl"))
r = LinRange(-1, 1, 100)
cube = [(x .^ 2 + y .^ 2 + z .^ 2) for x = r, y = r, z = r]

density_plots = map(x -> S.Density(x * randn(200) .+ 3x, color=:y), 1:5)
brain_mesh = S.Mesh(brain, colormap=:Spectral, color=[tri[1][2] for tri in brain for i in 1:3])
volcano_contour = S.Contourf(volcano; colormap=:inferno)
cube_contour = S.Contour(cube, alpha=0.5)

ax_densities = S.Axis(; plots=density_plots, yautolimitmargin = (0, 0.1))
ax_volcano = S.Axis(; plots=[volcano_contour])
ax_brain = S.Axis3(; plots=[brain_mesh], protrusions = (50, 20, 10, 0))
ax_cube = S.Axis3(; plots=[cube_contour], protrusions = (50, 20, 10, 0))

spec_column_vector = S.GridLayout([ax_densities, ax_volcano, ax_brain]);
spec_matrix = S.GridLayout([ax_densities ax_volcano; ax_brain ax_cube]);
spec_row = S.GridLayout([spec_column_vector spec_matrix], colsizes = [Auto(), Auto(4)])

f, ax, pl = plot(S.GridLayout(spec_row); figure = (; fontsize = 10))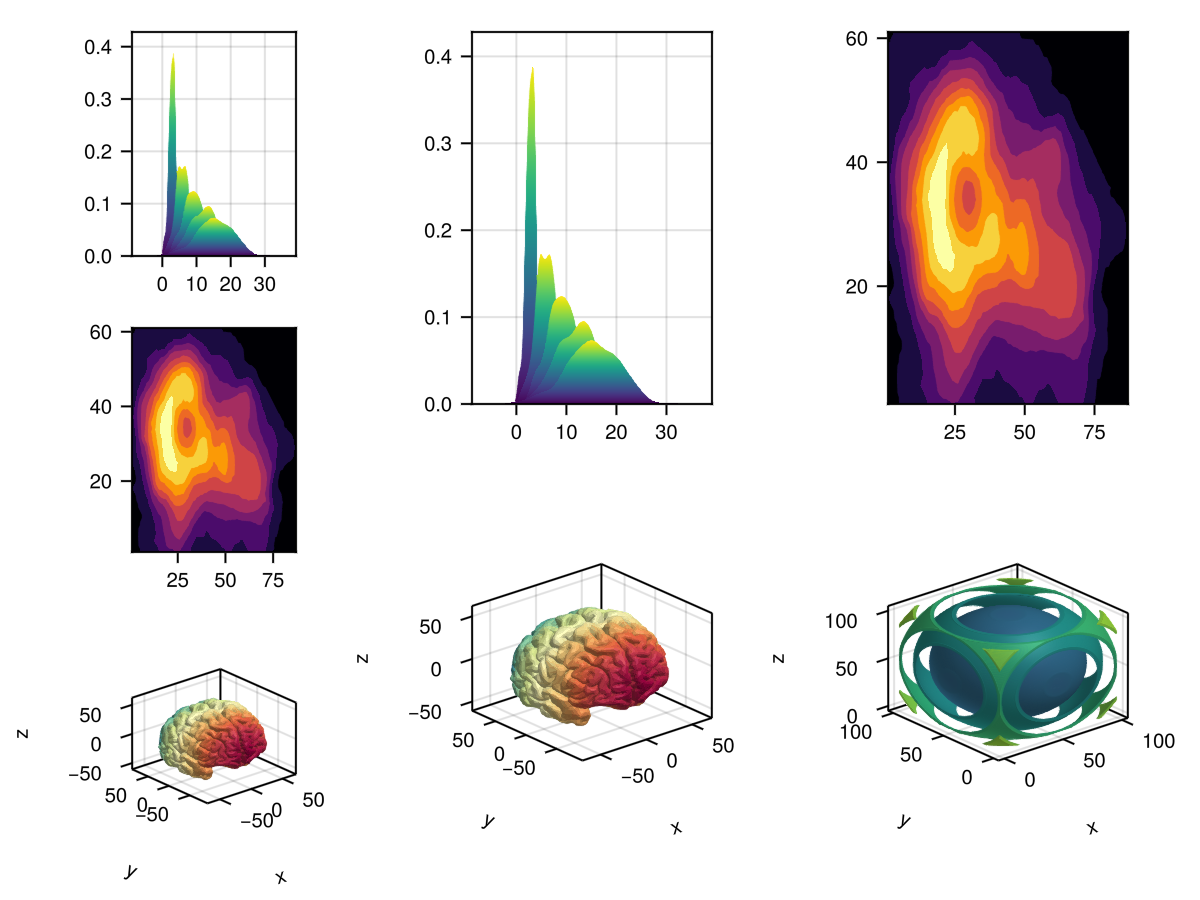
Advanced spec layouting
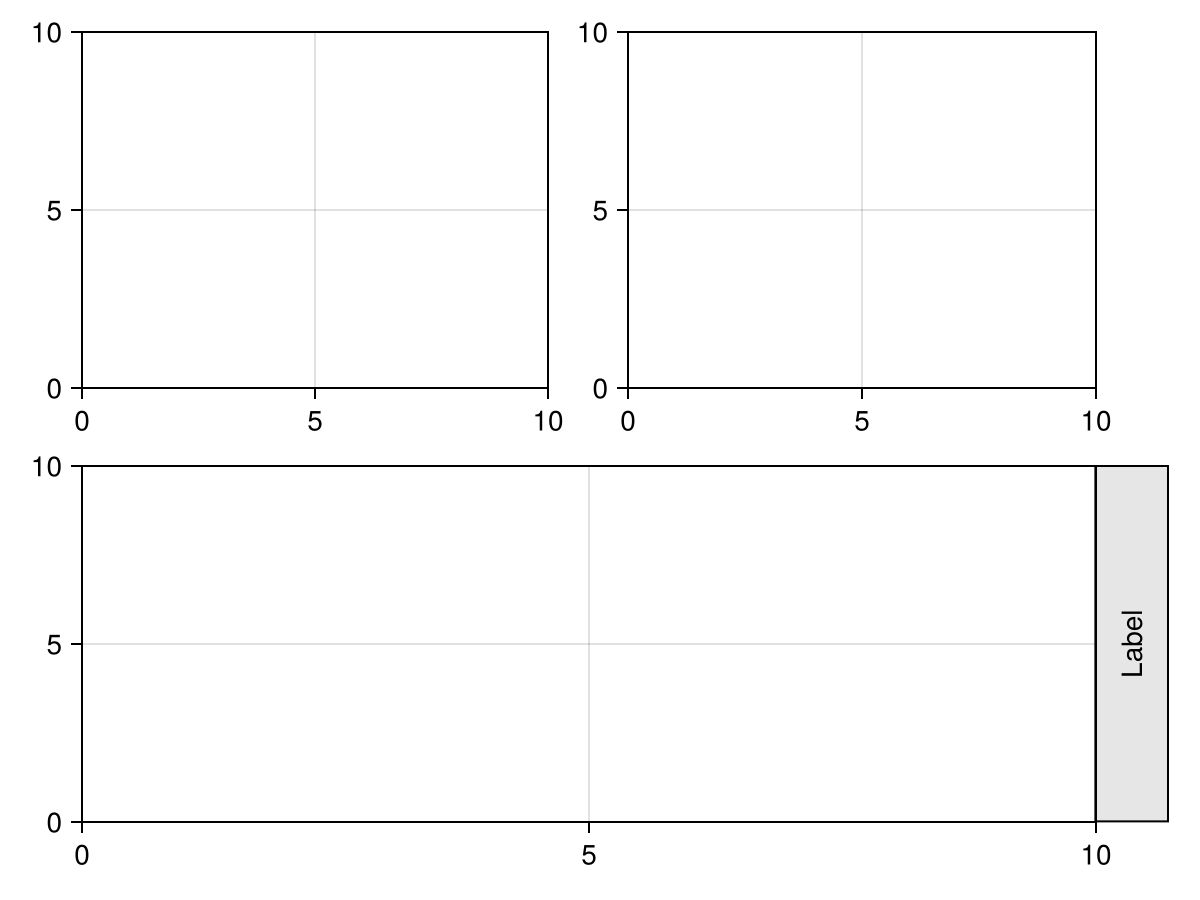
If you need even more control, you can pass the position of each object in your layout to S.GridLayout directly. These positions are specified as a tuple of (rows, columns [, side]) where side is Inside() by default. For rows and columns you can either use integers like 2, ranges like 1:3 or the colon operator : which spans across all rows or columns that are specified for other elements. Rows and columns start at 1 by default but you can also use numbers lower than 1 if necessary.
using CairoMakie
import Makie.SpecApi as S

plot(
    S.GridLayout([
        (1, 1) => S.Axis(),
        (1, 2) => S.Axis(),
        (2, :) => S.Axis(),
        (2, 2, Right()) => S.Box(),
        (2, 2, Right()) => S.Label(
            text = "Label",
            rotation = pi/2,
            padding = (10, 10, 10, 10)
        ),
    ])
)
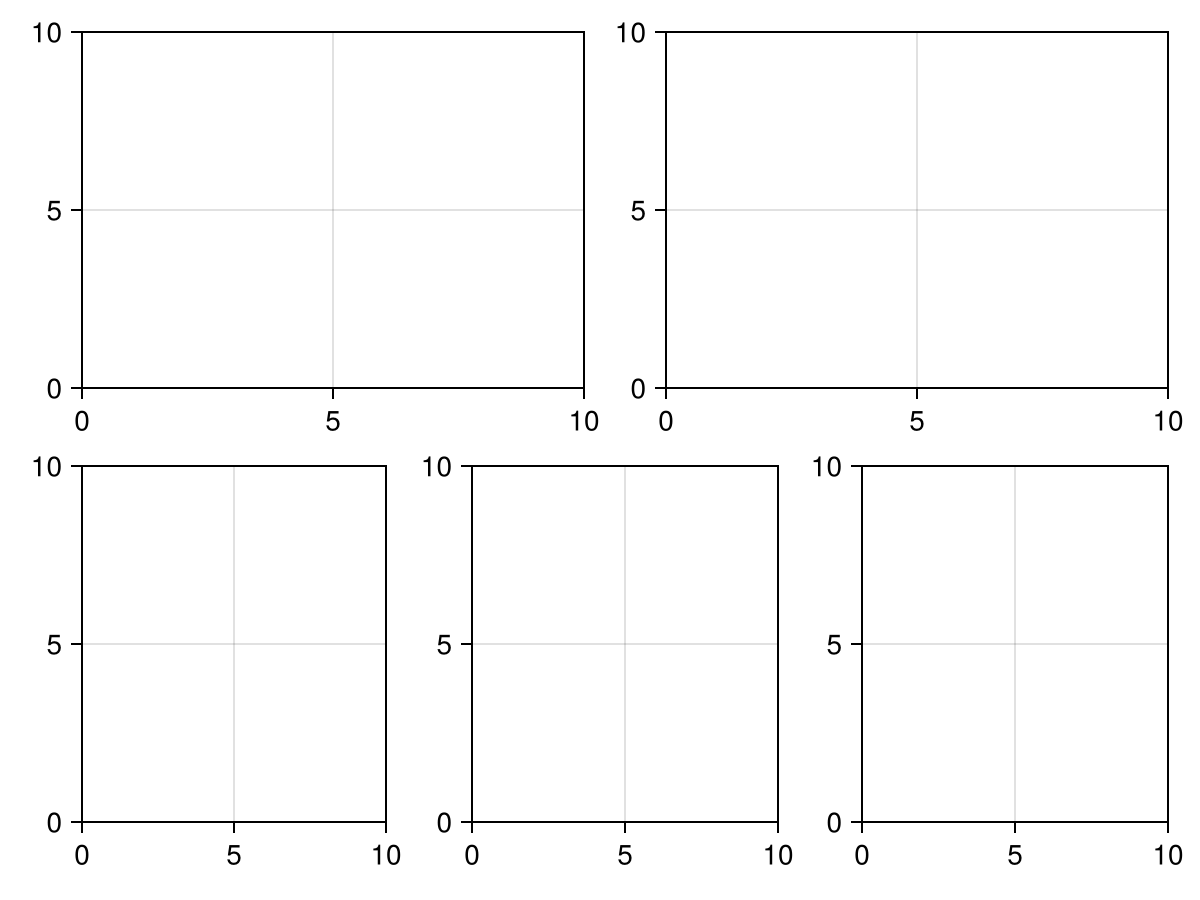
You can also use manual positions with nested GridLayouts.
using CairoMakie
import Makie.SpecApi as S

plot(S.GridLayout([
    (1, 1) => S.Axis(),
    (1, 2) => S.Axis(),
    (2, :) => S.GridLayout(fill(S.Axis(), 1, 3)),
]))
Here are all the keyword arguments that S.GridLayout accepts.
S.GridLayout([...],
    colsizes = [Auto(), Auto(), 300],
    rowsizes = [Relative(0.4), Relative(0.6)],
    colgaps,
    rowgaps,
    alignmode,
    halign,
    valign,
    tellheight,
    tellwidth,
)
Axis links are also supported, but they're not part of Axis, but rather the surrounding GridLayout, since when constructing the axis you usually don't yet have the other Axes you want to link them to. You can either pass a vector of axis specs or a vector of vectors of axis specs, in which case each group is linked independently.
using CairoMakie
import Makie.SpecApi as S
axis_matrix = broadcast(1:2, (1:2)') do x, y
    S.Axis(; title="$x, $y")
end
layout = S.GridLayout(
    axis_matrix;
    xaxislinks=vec(axis_matrix[1:2, 1]),
    yaxislinks=vec(axis_matrix[1:2, 2])
)
f, _, pl = plot(layout)
# Change limits to see the links in action
for ax in f.content[[1, 3]]
    limits!(ax, 2, 3, 2, 3)
end
f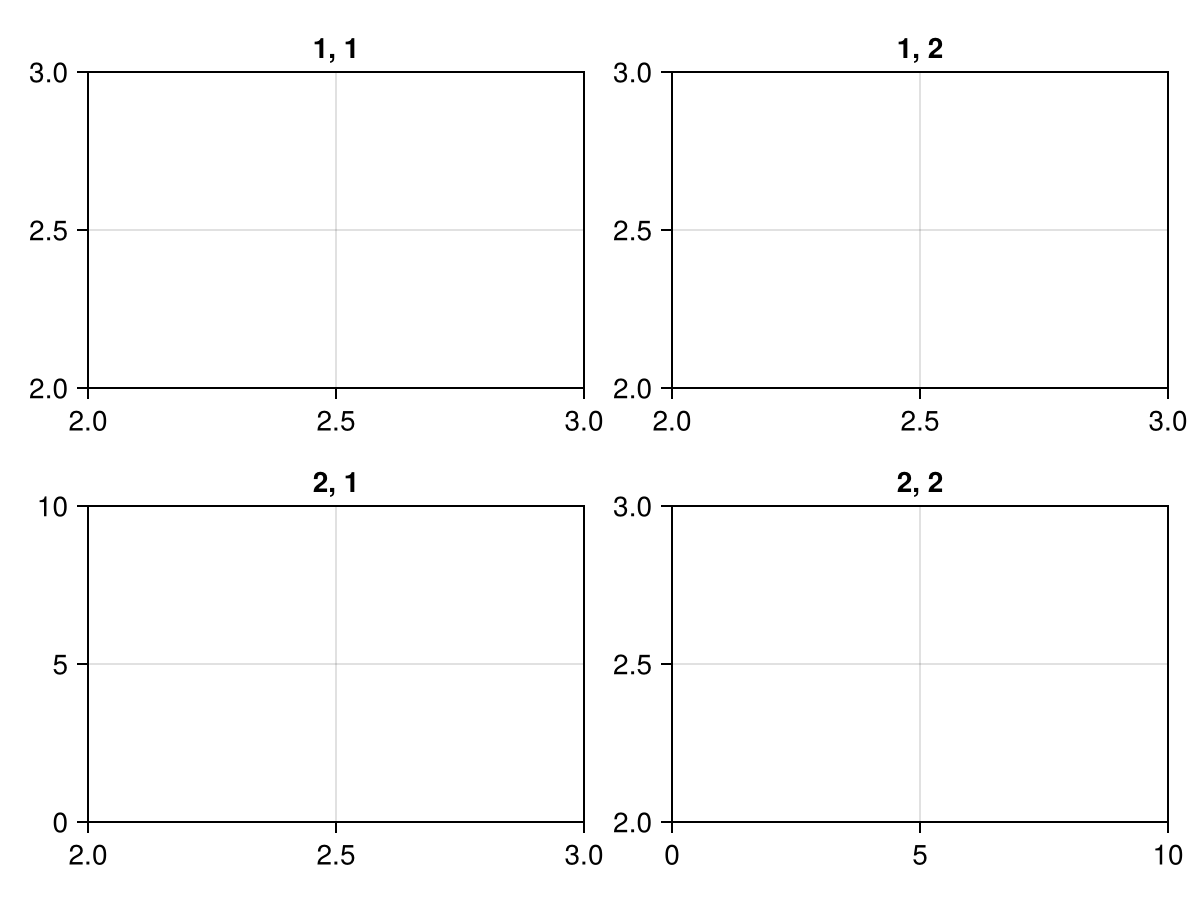
Using specs in convert_arguments
Warning
It's not decided yet how to forward keyword arguments from plots(...; kw...) to convert_arguments for the SpecApi in a more convenient and performant way. Until then, you need to mark attributes you want to use in convert_arguments with Makie.used_attributes, but this will completely redraw the entire spec on change of any attribute. We also may require users to overload a different function in future versions.
You can overload convert_arguments and return an array of PlotSpecs or a GridLayoutSpec. The main difference between those is, that returning an array of PlotSpecs may be plotted like any recipe into axes, while overloads returning GridLayoutSpec may not.
convert_arguments for GridLayoutSpec
In this example, we overload convert_arguments for a custom type to create facet grids easily.
using CairoMakie
import Makie.SpecApi as S

# Our custom type we want to write a conversion method for
struct PlotGrid
    nplots::Tuple{Int,Int}
end

# If we want to use the `color` attribute in the conversion, we have to
# mark it via `used_attributes`
Makie.used_attributes(::PlotGrid) = (:color,)

# The conversion method creates a grid of `Axis` objects with `Lines` plot inside
# We restrict to Plot{plot}, so that only `plot(PlotGrid(...))` works, but not e.g. `scatter(PlotGrid(...))`.
function Makie.convert_arguments(::Type{Plot{plot}}, obj::PlotGrid; color=:black)
    axes = [
        S.Axis(plots=[S.Lines(cumsum(randn(1000)); color=color)])
            for i in 1:obj.nplots[1],
                j in 1:obj.nplots[2]
    ]
    return S.GridLayout(axes)
end

# Now, when we plot `PlotGrid` we get a whole facet layout
plot(PlotGrid((3, 4)))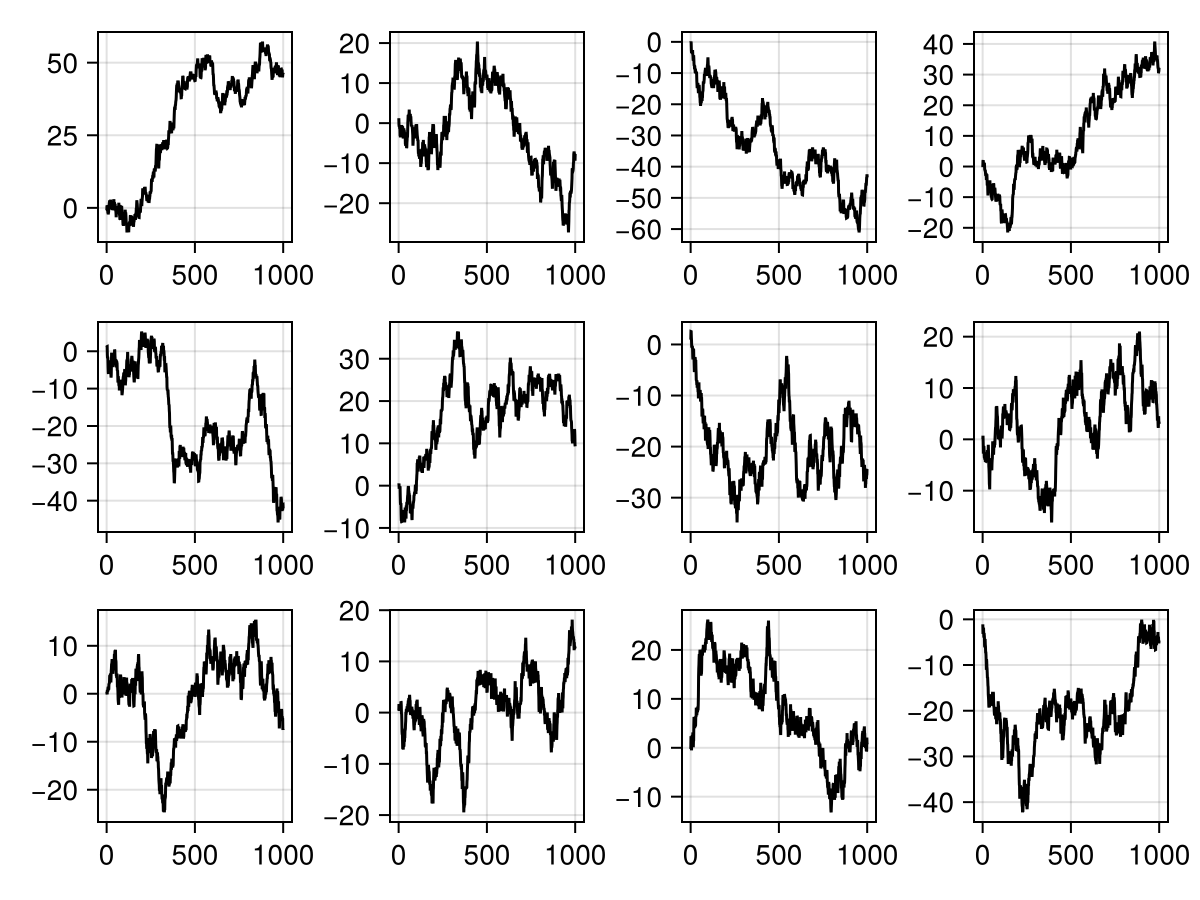
We can also plot into existing Figures with our new plot method:
f = Figure()
plot(f[1, 1], PlotGrid((2, 2)); color=Cycled(1))
plot(f[1, 2], PlotGrid((3, 2)); color=Cycled(2))
f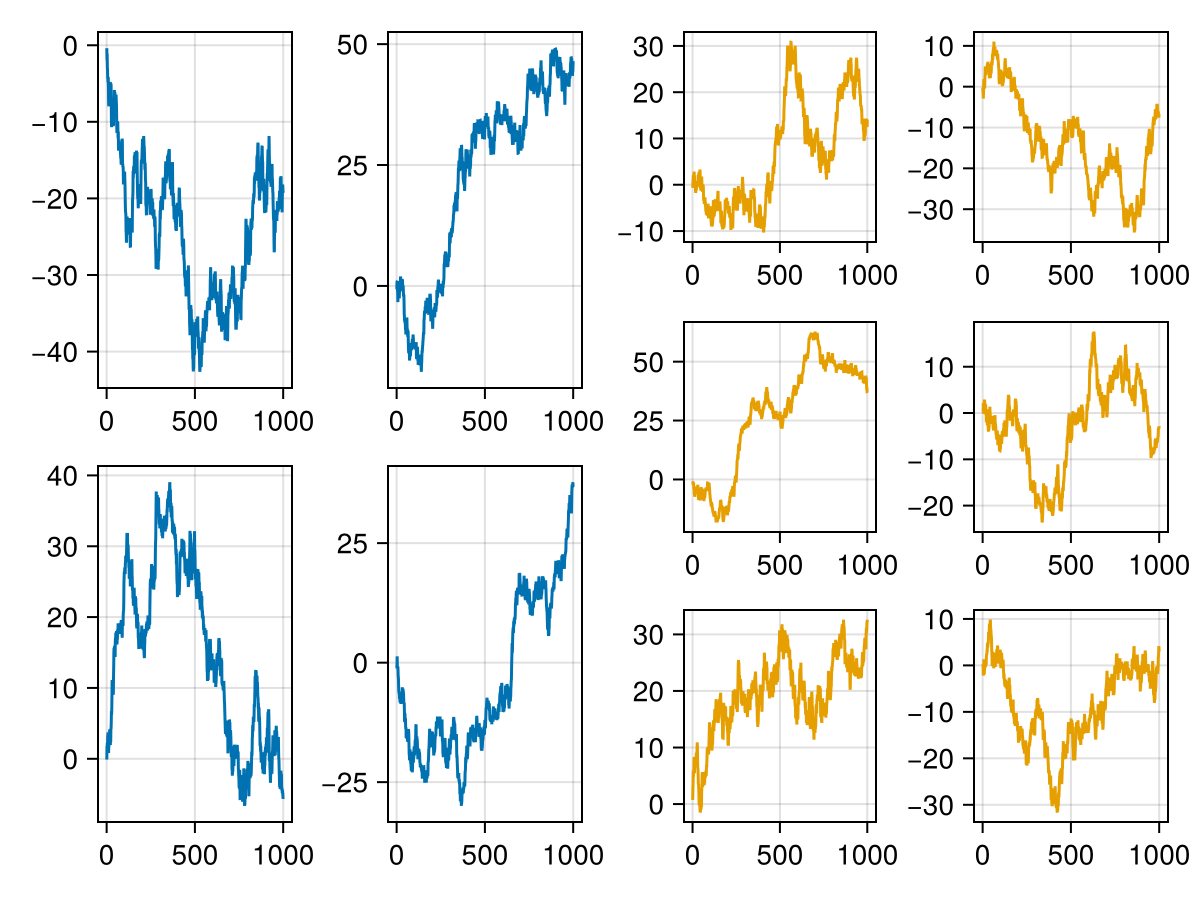
convert_arguments for PlotSpecs
We can return a vector of PlotSpecs from convert_arguments which allows us to dynamically choose the plot objects we want to add given the input data. While you could choose plot types based on input data with the old recipe API as well, this did not easily work for observable updates that changed these plot types in an existing figure. For this, users had to do tedious manual bookkeeping which is now abstracted away.
Note, that this method currently doesn't allow to forward keyword arguments from the plot command to convert_arguments, so we put the plot arguments into the LineScatter object in the following example:
using CairoMakie
import Makie.SpecApi as S
using Random

Random.seed!(123)

# define a struct for `convert_arguments`
struct CustomMatrix
    data::Matrix{Float32}
    style::Symbol
    kw::Dict{Symbol,Any}
end
CustomMatrix(data; style, kw...) = CustomMatrix(data, style, Dict{Symbol,Any}(kw))

function Makie.convert_arguments(::Type{<:AbstractPlot}, obj::CustomMatrix)
    plots = PlotSpec[]
    if obj.style === :heatmap
        push!(plots, S.Heatmap(obj.data; obj.kw...))
    elseif obj.style === :contourf
        push!(plots, S.Contourf(obj.data; obj.kw...))
    end
    max_position = Tuple(argmax(obj.data))
    push!(plots, S.Scatter(max_position; markersize = 30, strokecolor = :white, color = :transparent, strokewidth = 4))
    return plots
end

data = randn(30, 30)

f = Figure()
ax = Axis(f[1, 1])
# We can either plot into an existing Axis
plot!(ax, CustomMatrix(data, style = :heatmap, colormap = :Blues))
# Or create a new one automatically as we are used to from the standard API
plot(f[1, 2], CustomMatrix(data, style = :contourf, colormap = :inferno))
f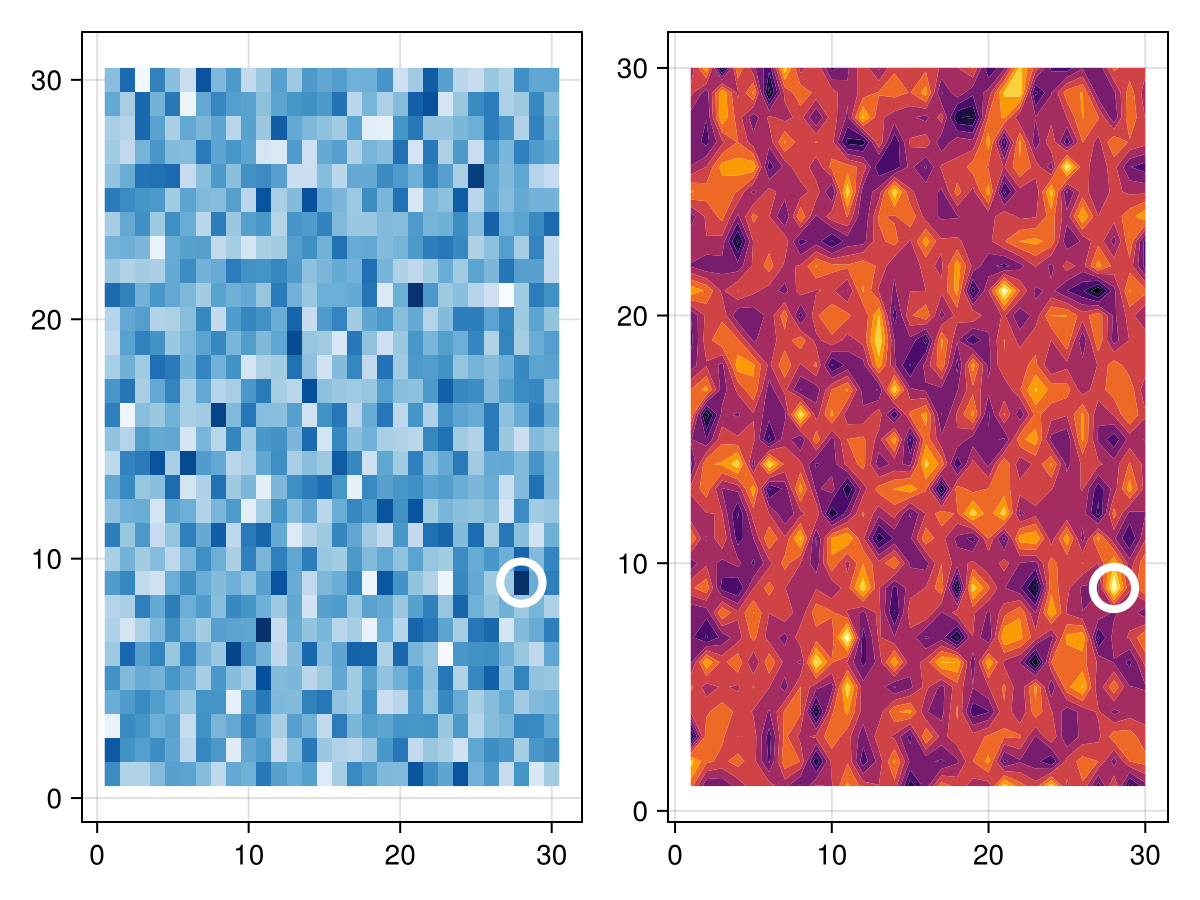
Interactive example
The SpecApi is geared towards dashboards and interactively creating complex plots. Here is an example using a Slider and a Menu, to visualize a fake simulation:
using GLMakie
using Random
import Makie.SpecApi as S

struct MySimulation
    plottype::Symbol
    arguments::AbstractVector
end

function Makie.convert_arguments(::Type{<:AbstractPlot}, sim::MySimulation)
    return map(enumerate(sim.arguments)) do (i, data)
        return PlotSpec(sim.plottype, data)
    end
end
f = Figure()
s = Slider(f[1, 1], range=1:10)
m = Menu(f[1, 2], options=[:Scatter, :Lines, :BarPlot])
sim = lift(s.value, m.selection) do n_plots, p
    Random.seed!(123)
    args = [cumsum(randn(100)) for i in 1:n_plots]
    return MySimulation(p, args)
end
ax, pl = plot(f[2, :], sim)
tight_ticklabel_spacing!(ax)
# lower priority to make sure the call back is always called last
on(sim; priority=-1) do x
    autolimits!(ax)
end

record(f, "interactive_specapi.mp4", framerate=1) do io
    pause = 0.1
    m.i_selected[] = 1
    for i in 1:4
        set_close_to!(s, i)
        sleep(pause)
        recordframe!(io)
    end
    m.i_selected[] = 2
    sleep(pause)
    recordframe!(io)
    for i in 5:7
        set_close_to!(s, i)
        sleep(pause)
        recordframe!(io)
    end
    m.i_selected[] = 3
    sleep(pause)
    recordframe!(io)
    for i in 7:10
        set_close_to!(s, i)
        sleep(pause)
        recordframe!(io)
    end
end
Accessing created Blocks
You can access created blocks with the then(f) syntax:
import Makie.SpecApi as S
ax =  S.Axis(...)
ax.then() do actual_axis_object
    return on(events(actual_axis_object).mouseposition) do mp
        println("mouse: $(mp)")
    end
end
Note, that the callback must be pure, since the objects will get reused and the callback will be called again. To allow on or onany, one can return an array of ObserverFunctions or single one as in the above example.
ax.then() do ax
    obs1 = on(f1, events(ax).keyboardbutton)
    obs2 = on(f2, events(ax).mousebutton)
    obs_array = onany(f3, some_obs1, some_obs2)
    return [obs1, obs2, obs_array...]
end
This allows the SpecApi to clean up the callbacks on reuse. Note that things like hidedecorations!(axis) is not yet supported, since we will need some better book keeping of what got mutated by that call. One of the few functions that's already supported is linkaxes!:
axes_1 = [S.Axis(title="Axis (1): $(i)") for i in 1:3]
axes_2 = [S.Axis(title="Axis (2): $(i)") for i in 1:3]
for ax1 in axes_1
    for ax2 in axes_2
        if ax1 != ax2
            ax1.then() do iax
                ax2.then() do jax
                    linkaxes!(iax, jax)
                    return
                end
                return
            end
        end
    end
end