boxplot
Makie.boxplot Function
boxplot(x, y; kwargs...)Draw a Tukey style boxplot. The boxplot has 3 components:
- a
crossbarspanning the interquartile (IQR) range (values from the 25th to
the 75% percentile) with a midline marking the median
an
errorbarincluding values from the interquartile range extended byrange * iqrpoints marking outliers, that is, data outside the errorbar
Arguments
x: positions of the categoriesy: variables within the boxes
Plot type
The plot type alias for the boxplot function is BoxPlot.
Examples
using CairoMakie
categories = rand(1:3, 1000)
values = randn(1000)

boxplot(categories, values)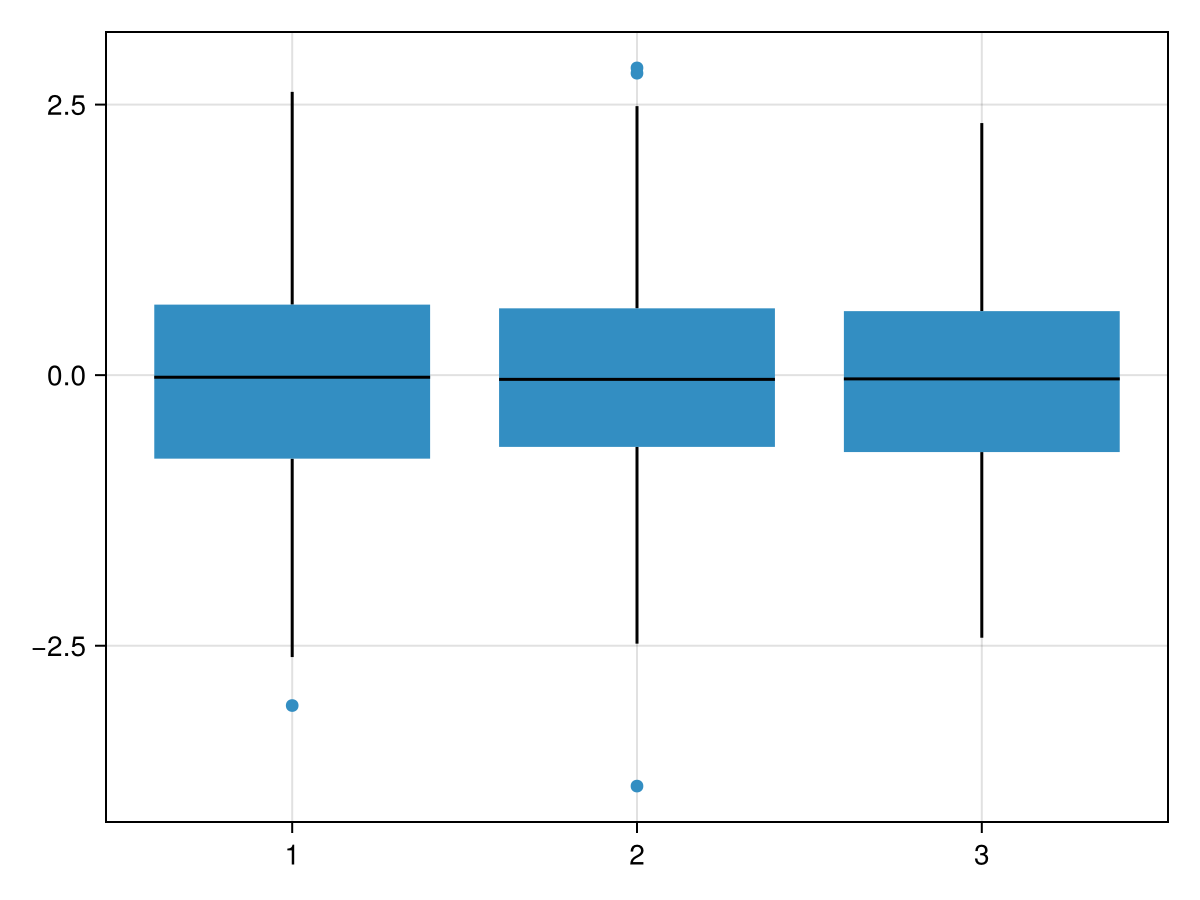
using CairoMakie
categories = rand(1:3, 1000)
values = randn(1000)
dodge = rand(1:2, 1000)

boxplot(categories, values, dodge = dodge, show_notch = true, color = dodge)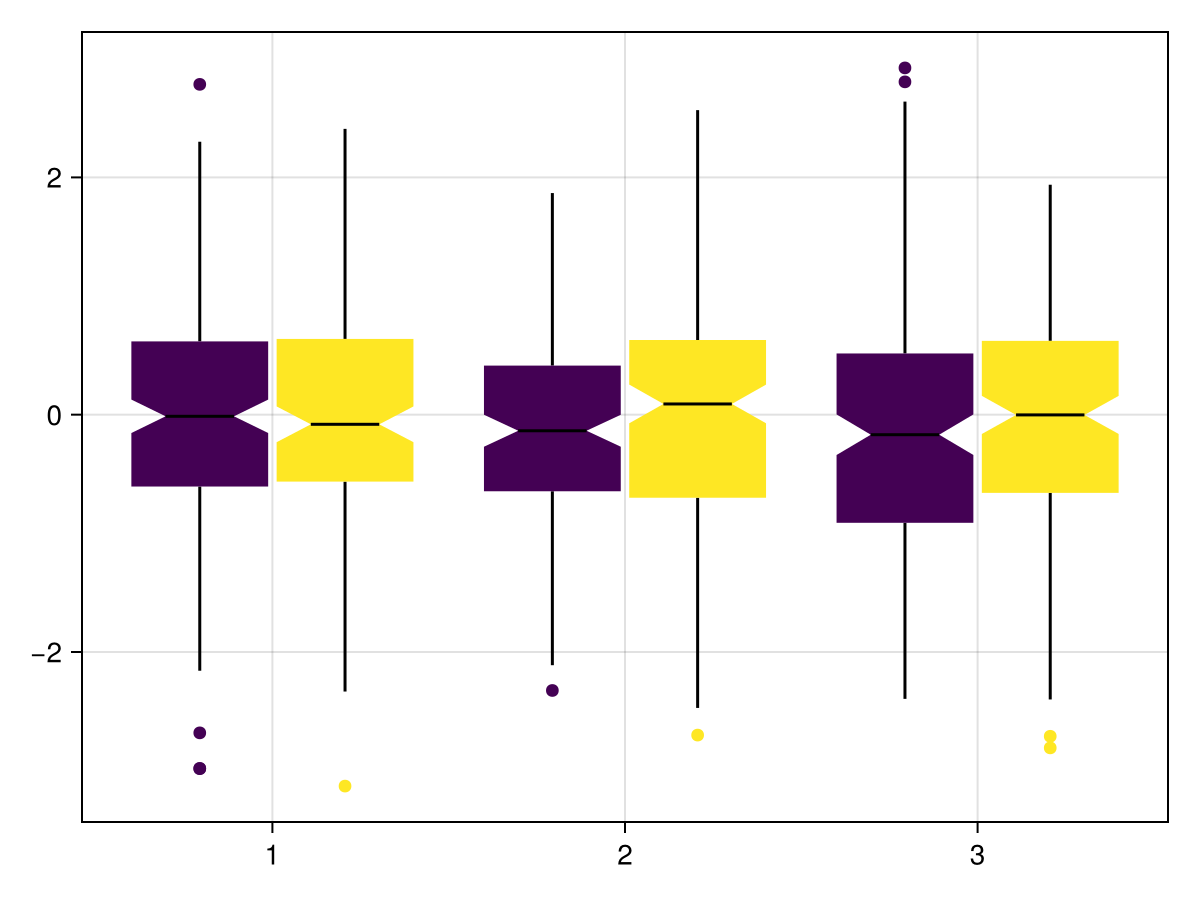
Colors are customizable. The color attribute refers to the color of the boxes, whereas outliercolor refers to the color of the outliers. If not scalars (e.g. :red), these attributes must have the length of the data. If outliercolor is not provided, outliers will have the same color as their box, as shown above.
Note
For all indices corresponding to points within the same box, color (but not outliercolor) must have the same value.
using CairoMakie
categories = rand(1:3, 1000)
values = randn(1000)
dodge = rand(1:2, 1000)

boxplot(categories, values, dodge = dodge, show_notch = true, color = map(d->d==1 ? :blue : :red, dodge) , outliercolor = rand([:red, :green, :blue, :black, :yellow], 1000))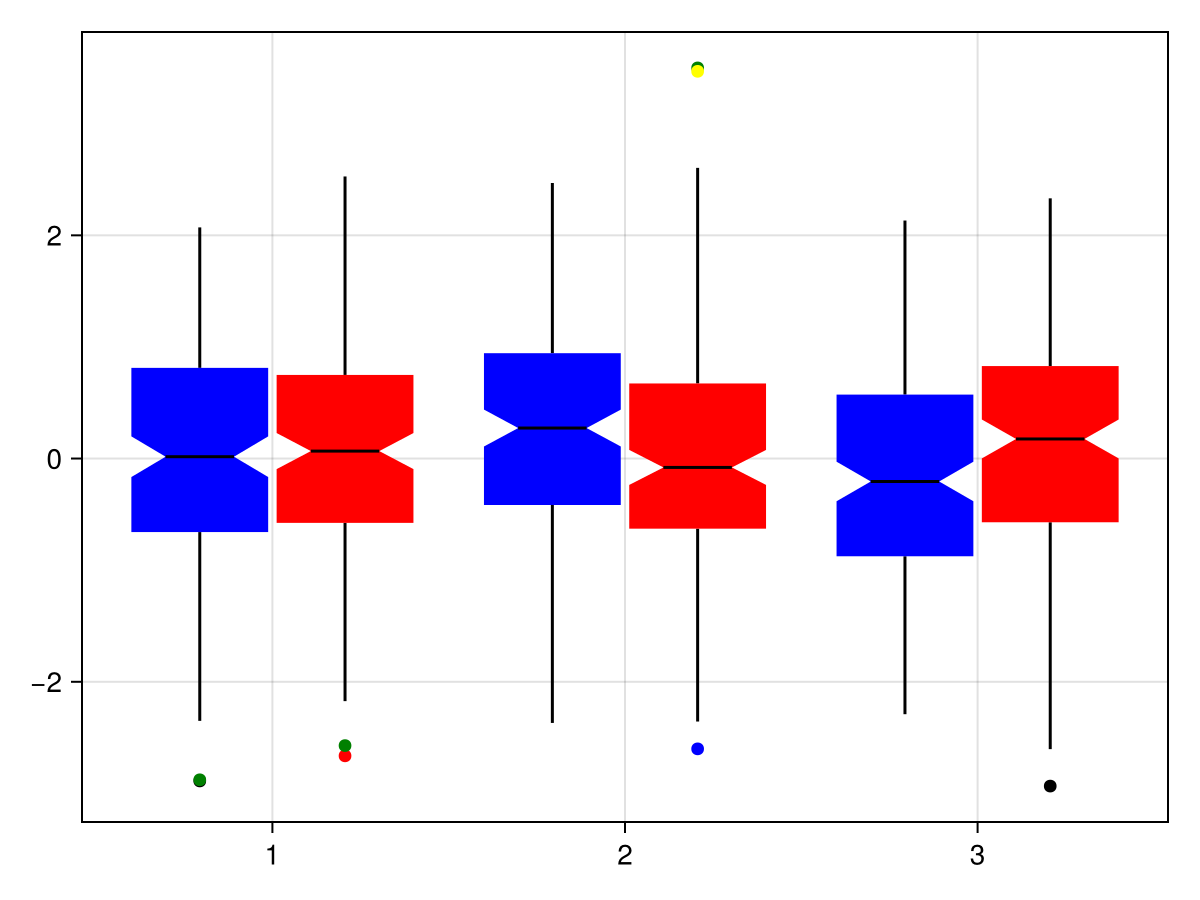
Using statistical weights
using CairoMakie
using Distributions

N = 100_000
x = rand(1:3, N)
y = rand(Uniform(-1, 5), N)

w = pdf.(Normal(), x .- y)

fig = Figure()

boxplot(fig[1,1], x, y)
boxplot(fig[1,2], x, y, weights = w)

fig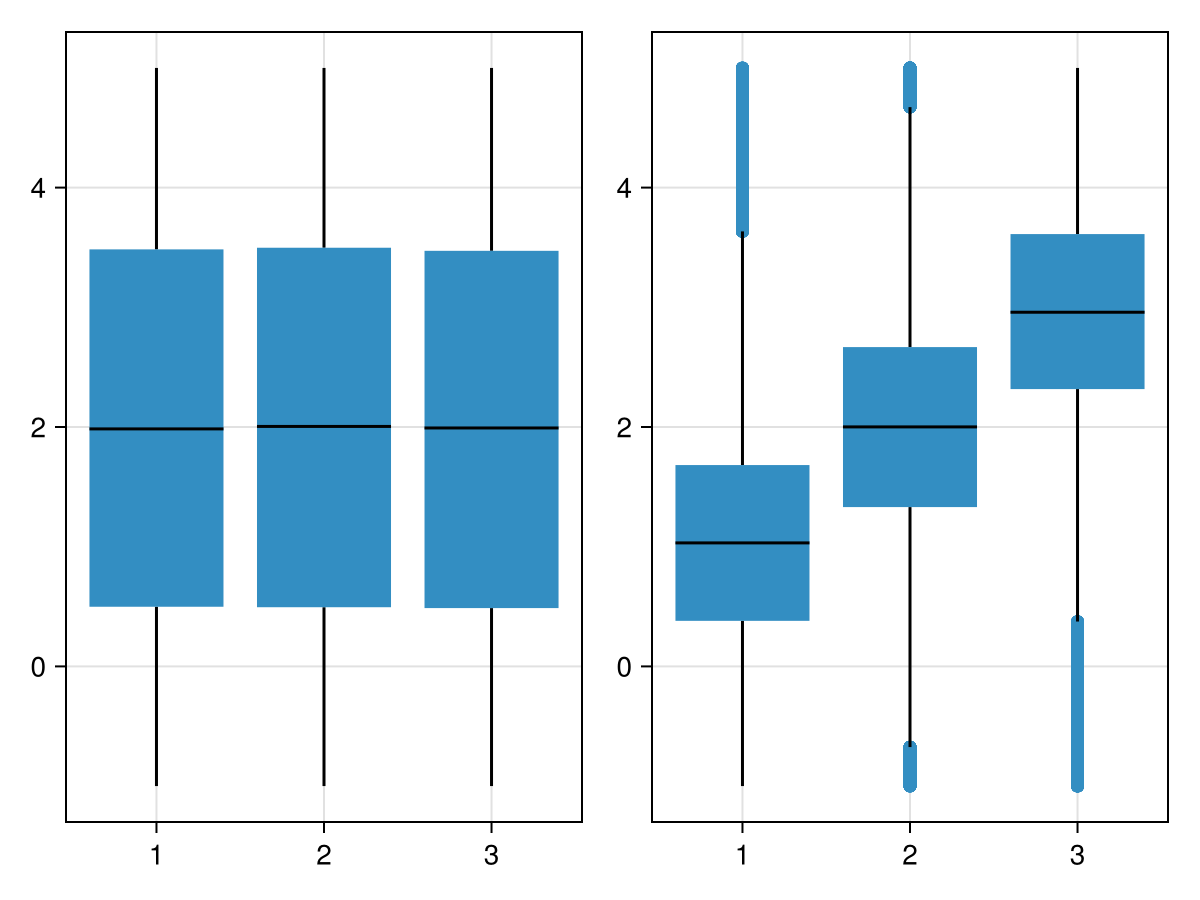
Horizontal axis
using CairoMakie
fig = Figure()

categories = rand(1:3, 1000)
values = randn(1000)

ax_vert = Axis(fig[1,1];
    xlabel = "categories",
    ylabel = "values",
    xticks = (1:3, ["one", "two", "three"])
)
ax_horiz = Axis(fig[1,2];
    xlabel="values", # note that x/y still correspond to horizontal/vertical axes respectively
    ylabel="categories",
    yticks=(1:3, ["one", "two", "three"])
)

# Note: same order of category/value, despite different axes
boxplot!(ax_vert, categories, values) # `orientation=:vertical` is default
boxplot!(ax_horiz, categories, values; orientation=:horizontal)

fig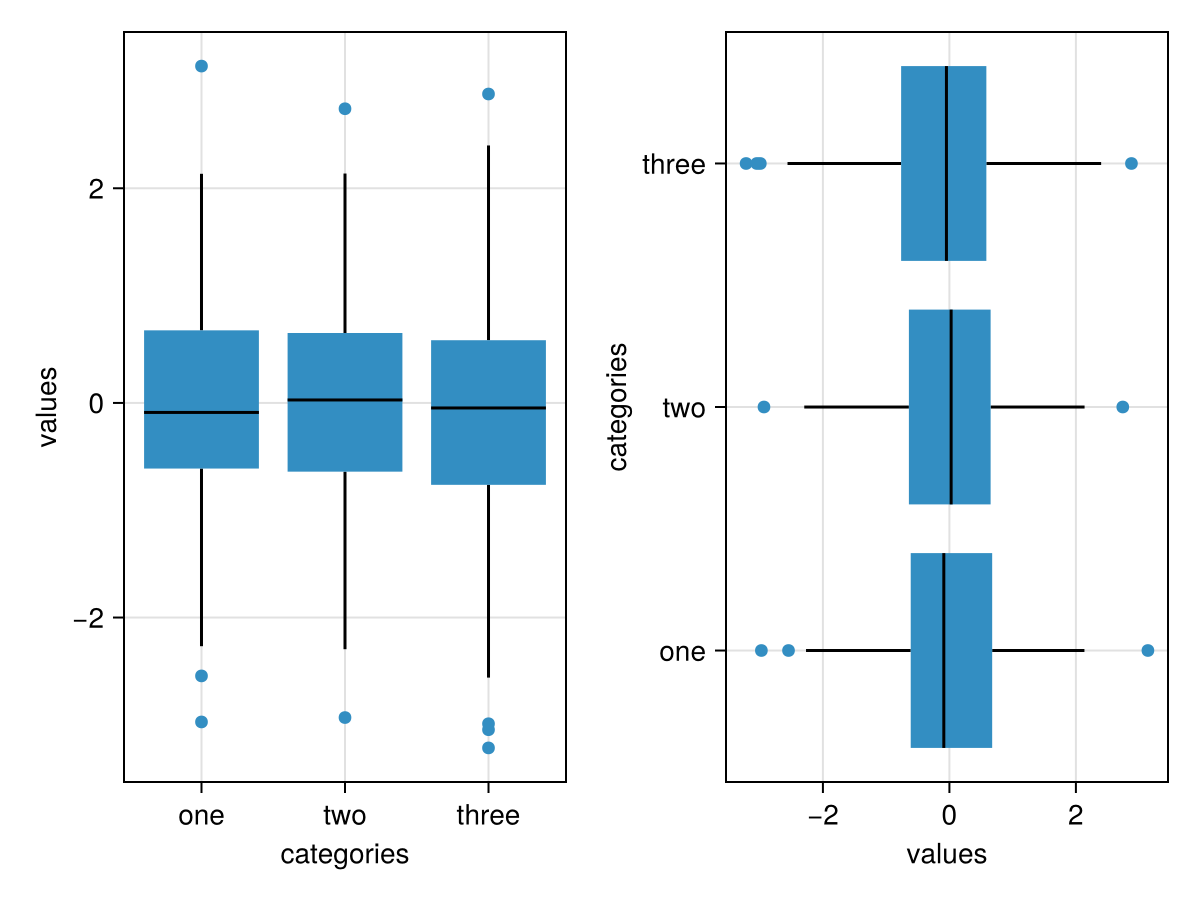
Attributes
alpha
Defaults to 1.0
The alpha value of the colormap or color attribute. Multiple alphas like in plot(alpha=0.2, color=(:red, 0.5)), will get multiplied.
clip_planes
Defaults to @inherit clip_planes automatic
Clip planes offer a way to do clipping in 3D space. You can set a Vector of up to 8 Plane3f planes here, behind which plots will be clipped (i.e. become invisible). By default clip planes are inherited from the parent plot or scene. You can remove parent clip_planes by passing Plane3f[].
color
Defaults to @inherit patchcolor
Sets the color of the drawn boxes. These can be values for colormapping.
colormap
Defaults to @inherit colormap :viridis
Sets the colormap that is sampled for numeric colors. PlotUtils.cgrad(...), Makie.Reverse(any_colormap) can be used as well, or any symbol from ColorBrewer or PlotUtils. To see all available color gradients, you can call Makie.available_gradients().
colorrange
Defaults to automatic
The values representing the start and end points of colormap.
colorscale
Defaults to identity
The color transform function. Can be any function, but only works well together with Colorbar for identity, log, log2, log10, sqrt, logit, Makie.pseudolog10, Makie.Symlog10, Makie.AsinhScale, Makie.SinhScale, Makie.LogScale, Makie.LuptonAsinhScale, and Makie.PowerScale.
cycle
Defaults to [:color => :patchcolor]
Sets which attributes to cycle when creating multiple plots. The values to cycle through are defined by the parent Theme. Multiple cycled attributes can be set by passing a vector. Elements can
directly refer to a cycled attribute, e.g.
:colormap a cycled attribute to a palette attribute, e.g.
:linecolor => :colormap multiple cycled attributes to a palette attribute, e.g.
[:linecolor, :markercolor] => :color
depth_shift
Defaults to 0.0
Adjusts the depth value of a plot after all other transformations, i.e. in clip space, where -1 <= depth <= 1. This only applies to GLMakie and WGLMakie and can be used to adjust render order (like a tunable overdraw).
dodge
Defaults to automatic
Dodge can be used to separate crossbars drawn at the same x positions. For this each crossbar is given an integer value corresponding to its position relative to the given positions. E.g. with positions = [1, 1, 1, 2, 2, 2] we have 3 crossbars at each position which can be separated by dodge = [1, 2, 3, 1, 2, 3].
dodge_gap
Defaults to 0.03
Sets the gap between dodged crossbars relative to the size of them.
fxaa
Defaults to true
Adjusts whether the plot is rendered with fxaa (fast approximate anti-aliasing, GLMakie only). Note that some plots implement a better native anti-aliasing solution (scatter, text, lines). For them fxaa = true generally lowers quality. Plots that show smoothly interpolated data (e.g. image, surface) may also degrade in quality as fxaa = true can cause blurring.
gap
Defaults to 0.2
Size of the gap between crossbars. The modified width is width * (1 - gap).
highclip
Defaults to automatic
The color for any value above the colorrange.
inspectable
Defaults to @inherit inspectable
Sets whether this plot should be seen by DataInspector. The default depends on the theme of the parent scene.
inspector_clear
Defaults to automatic
Sets a callback function (inspector, plot) -> ... for cleaning up custom indicators in DataInspector.
inspector_hover
Defaults to automatic
Sets a callback function (inspector, plot, index) -> ... which replaces the default show_data methods.
inspector_label
Defaults to automatic
Sets a callback function (plot, index, position) -> string which replaces the default label generated by DataInspector.
lowclip
Defaults to automatic
The color for any value below the colorrange.
marker
Defaults to @inherit marker
Sets the marker for outliers.
markersize
Defaults to @inherit markersize
Sets the markersize for outliers.
mediancolor
Defaults to @inherit linecolor
Sets the color of median line.
medianlinewidth
Defaults to @inherit linewidth
Sets the width of the median line.
model
Defaults to automatic
Sets a model matrix for the plot. This overrides adjustments made with translate!, rotate! and scale!.
n_dodge
Defaults to automatic
Sets the maximum integer for dodge. This sets how many crossbars can be placed at a given position, controlling their width.
nan_color
Defaults to :transparent
The color for NaN values.
notchwidth
Defaults to 0.5
Multiplier of width for narrowest width of notch at the midline/y.
orientation
Defaults to :vertical
Orientation of box (:vertical or :horizontal).
outliercolor
Defaults to automatic
Sets the color for outliers.
outlierstrokecolor
Defaults to @inherit markerstrokecolor
Sets the marker strokecolor for outliers.
outlierstrokewidth
Defaults to @inherit markerstrokewidth
Sets the marker strokewidth for outliers.
overdraw
Defaults to false
Controls if the plot will draw over other plots. This specifically means ignoring depth checks in GL backends
range
Defaults to 1.5
Sets how far the errorbar range expands beyond the interquartile range as a multiple of it. The final value range for errorbars is Q2 - range * (Q4 - Q2) to Q4 + range * (Q4 - Q2) where Q2 and Q4 include 25% and 75% of the values respectively. Setting to 0 extends whiskers to the range of the data.
show_median
Defaults to true
Shows the median as the midline of the crossbar.
show_notch
Defaults to false
Whether to draw the notch, which refers to a narrowed region around the midline/y.
show_outliers
Defaults to true
Show outliers as points. Any point outside the errorbars is consider one.
space
Defaults to :data
Sets the transformation space for box encompassing the plot. See Makie.spaces() for possible inputs.
ssao
Defaults to false
Adjusts whether the plot is rendered with ssao (screen space ambient occlusion). Note that this only makes sense in 3D plots and is only applicable with fxaa = true.
strokecolor
Defaults to @inherit patchstrokecolor
Sets the outline color of crossbars.
strokewidth
Defaults to @inherit patchstrokewidth
Sets the outline linewidth of crossbars.
transformation
Defaults to :automatic
Controls the inheritance or directly sets the transformations of a plot. Transformations include the transform function and model matrix as generated by translate!(...), scale!(...) and rotate!(...). They can be set directly by passing a Transformation() object or inherited from the parent plot or scene. Inheritance options include:
:automatic: Inherit transformations if the parent and childspaceis compatible:inherit: Inherit transformations:inherit_model: Inherit only model transformations:inherit_transform_func: Inherit only the transform function:nothing: Inherit neither, fully disconnecting the child's transformations from the parent
Another option is to pass arguments to the transform!() function which then get applied to the plot. For example transformation = (:xz, 1.0) which rotates the xy plane to the xz plane and translates by 1.0. For this inheritance defaults to :automatic but can also be set through e.g. (:nothing, (:xz, 1.0)).
transparency
Defaults to false
Adjusts how the plot deals with transparency. In GLMakie transparency = true results in using Order Independent Transparency.
visible
Defaults to true
Controls whether the plot gets rendered or not.
weights
Defaults to automatic
Vector of statistical weights (length of data). By default, each observation has weight 1.
whiskercolor
Defaults to @inherit linecolor
Sets the color of errorbars.
whiskerlinewidth
Defaults to @inherit linewidth
Sets the linewidth of errorbars.
whiskerwidth
Defaults to 0.0
Sets the width of whiskers on errorbars as a multiplier of the crossbar width.
width
Defaults to automatic
(Unscaled) width of the box.