violin
Makie.violin Function
violin(x, y)Draws a violin plot which consists of pairs of density plots draw side by side. The density pairs can be sourced from the same or from different data.
Arguments
x: positions of the categoriesy: variables whose density is computed
Plot type
The plot type alias for the violin function is Violin.
Examples
using CairoMakie
categories = rand(1:3, 1000)
values = randn(1000)

violin(categories, values)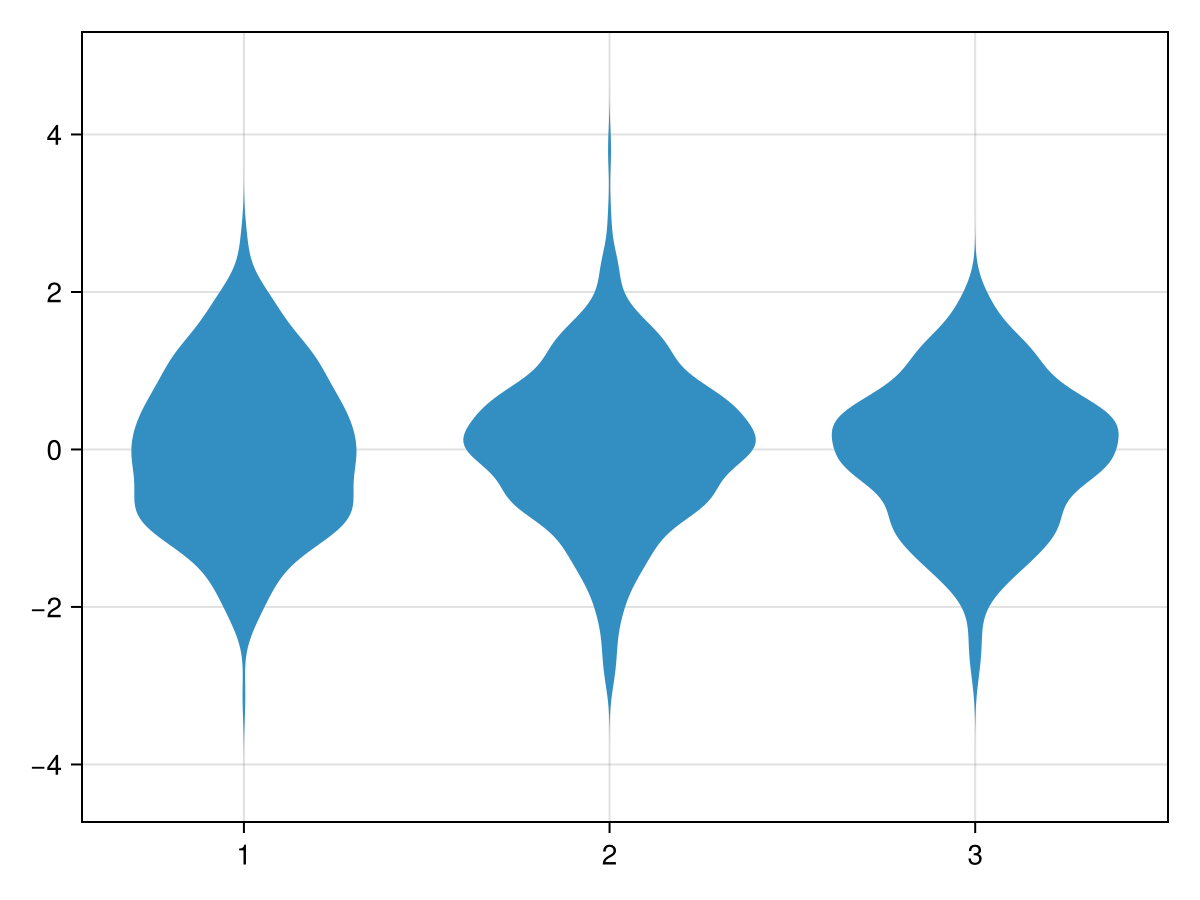
using CairoMakie
fig = Figure()
xs = vcat([fill(i, i * 1000) for i in 1:4]...)
ys = vcat(randn(6000), randn(4000) * 2)
for (i, scale) in enumerate([:area, :count, :width])
    ax = Axis(fig[i, 1])
    violin!(ax, xs, ys; scale, show_median=true)
    Makie.xlims!(0.2, 4.8)
    ax.title = "scale=:$(scale)"
end
fig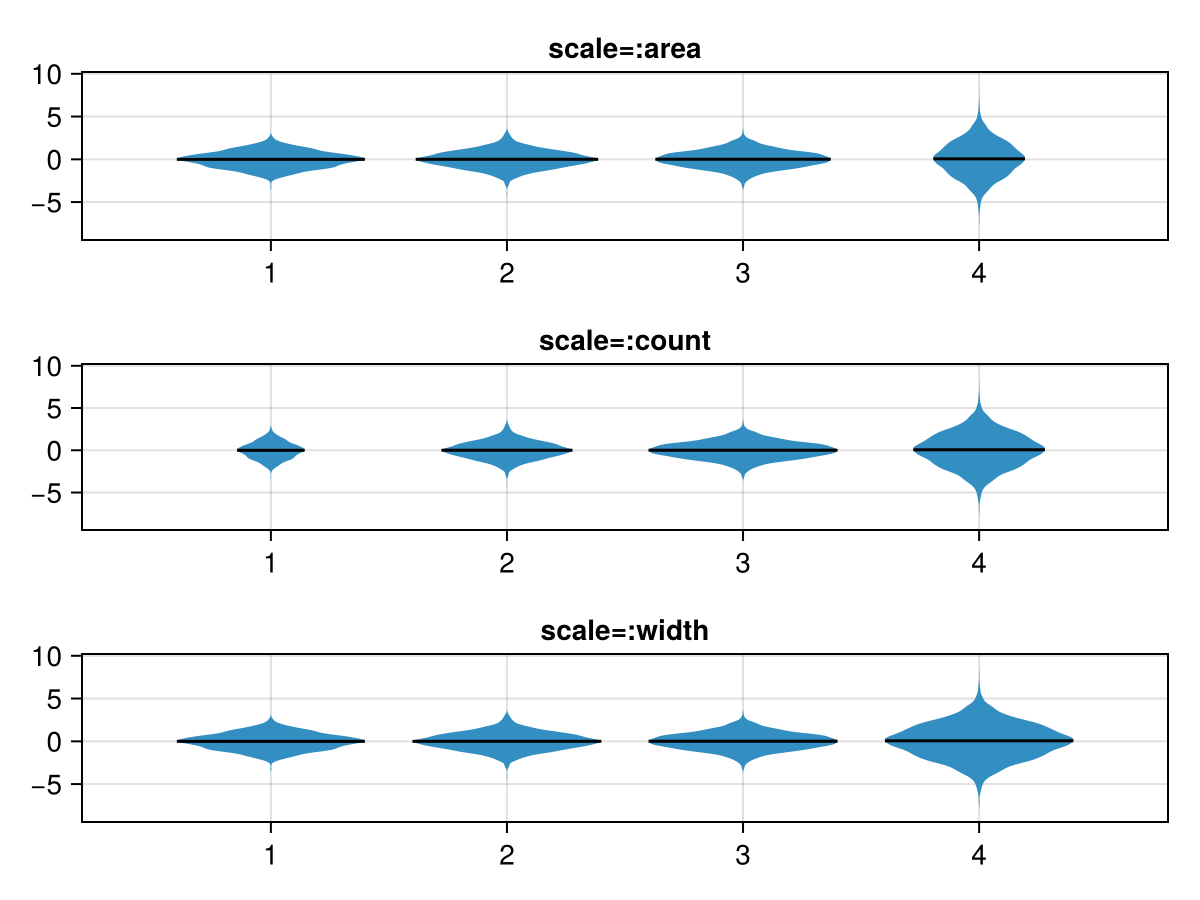
using CairoMakie
categories = rand(1:3, 1000)
values = map(categories) do x
    return x == 1 ? randn() : x == 2 ? 0.5 * randn() : 5 * rand()
end

violin(categories, values, datalimits = extrema)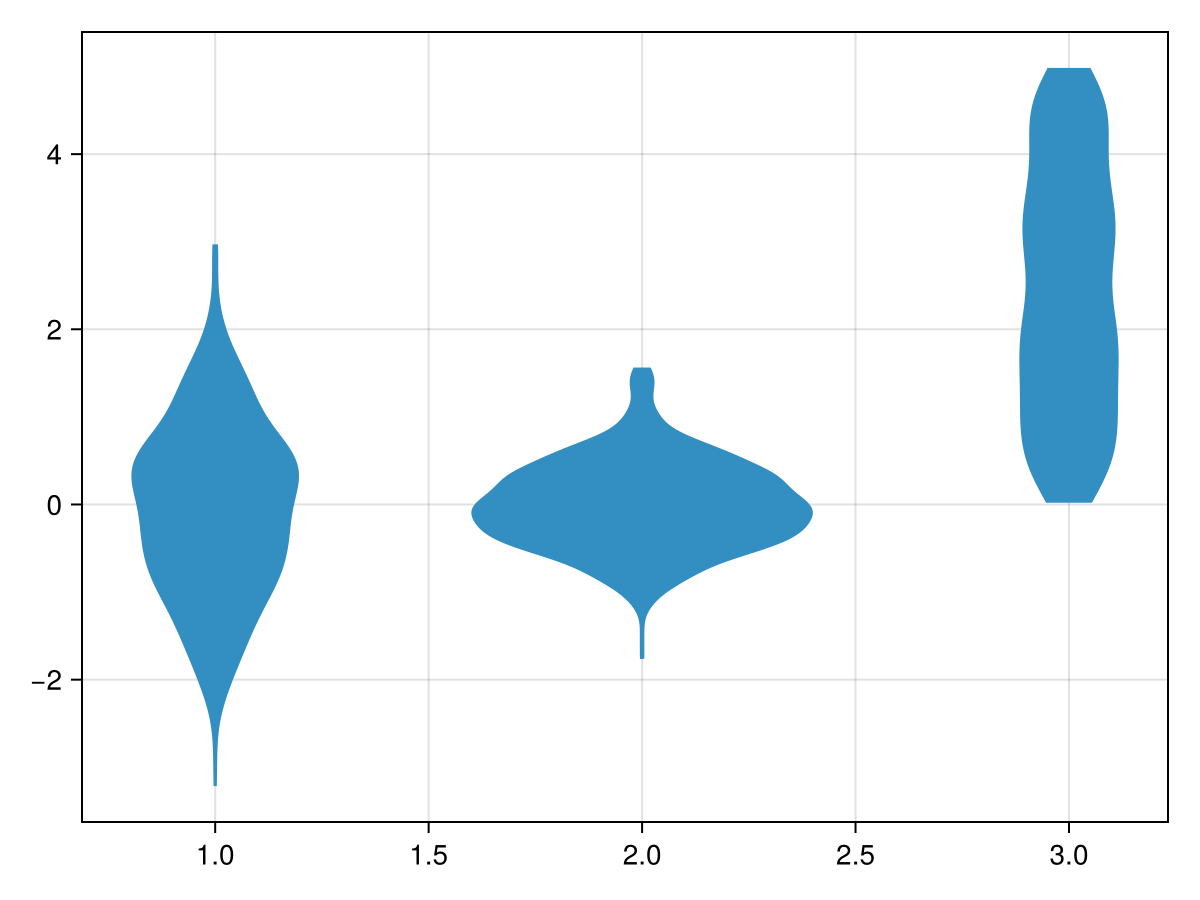
using CairoMakie
N = 1000
categories = rand(1:3, N)
dodge = rand(1:2, N)
side = rand([:left, :right], N)
color = @. ifelse(side === :left, :orange, :teal)
values = map(side) do s
    return s === :left ? randn() : rand()
end

violin(categories, values, dodge = dodge, side = side, color = color)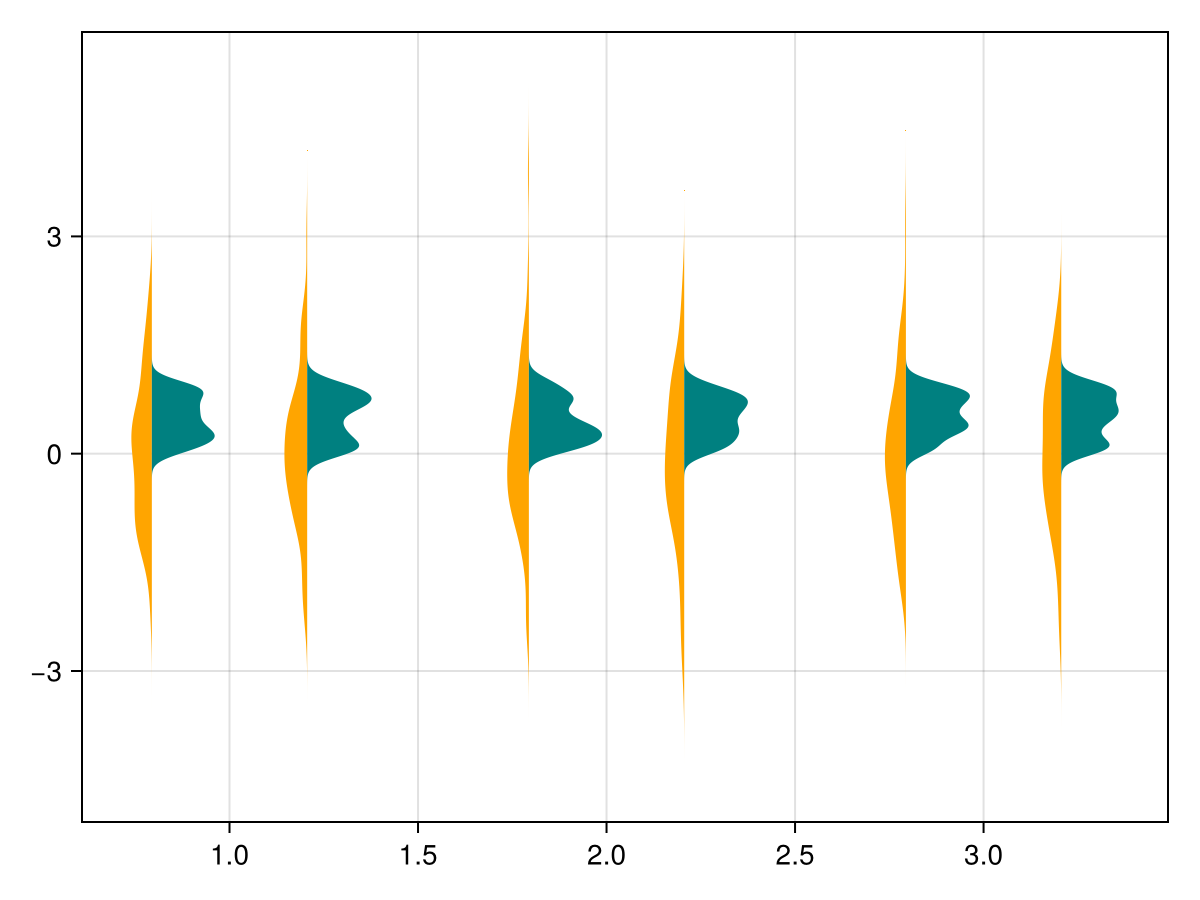
using CairoMakie
N = 1000
categories = rand(1:3, N)
side = rand([:left, :right], N)
color = map(categories, side) do x, s
    colors = s === :left ? [:red, :orange, :yellow] : [:blue, :teal, :cyan]
    return colors[x]
end
values = map(side) do s
    return s === :left ? randn() : rand()
end

violin(categories, values, side = side, color = color)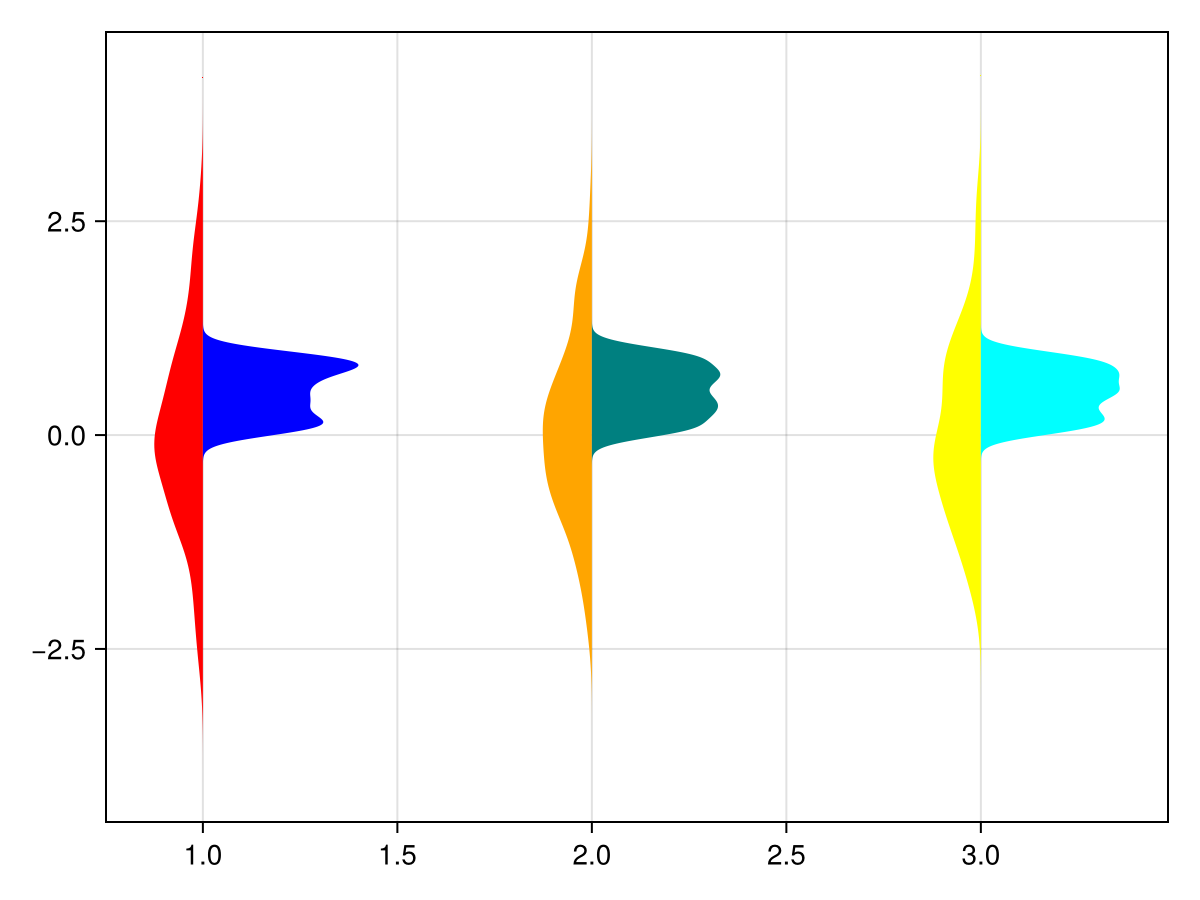
Using statistical weights
using CairoMakie
using Distributions

N = 100_000
categories = rand(1:3, N)
values = rand(Uniform(-1, 5), N)

w = pdf.(Normal(), categories .- values)

fig = Figure()

violin(fig[1,1], categories, values)
violin(fig[1,2], categories, values, weights = w)

fig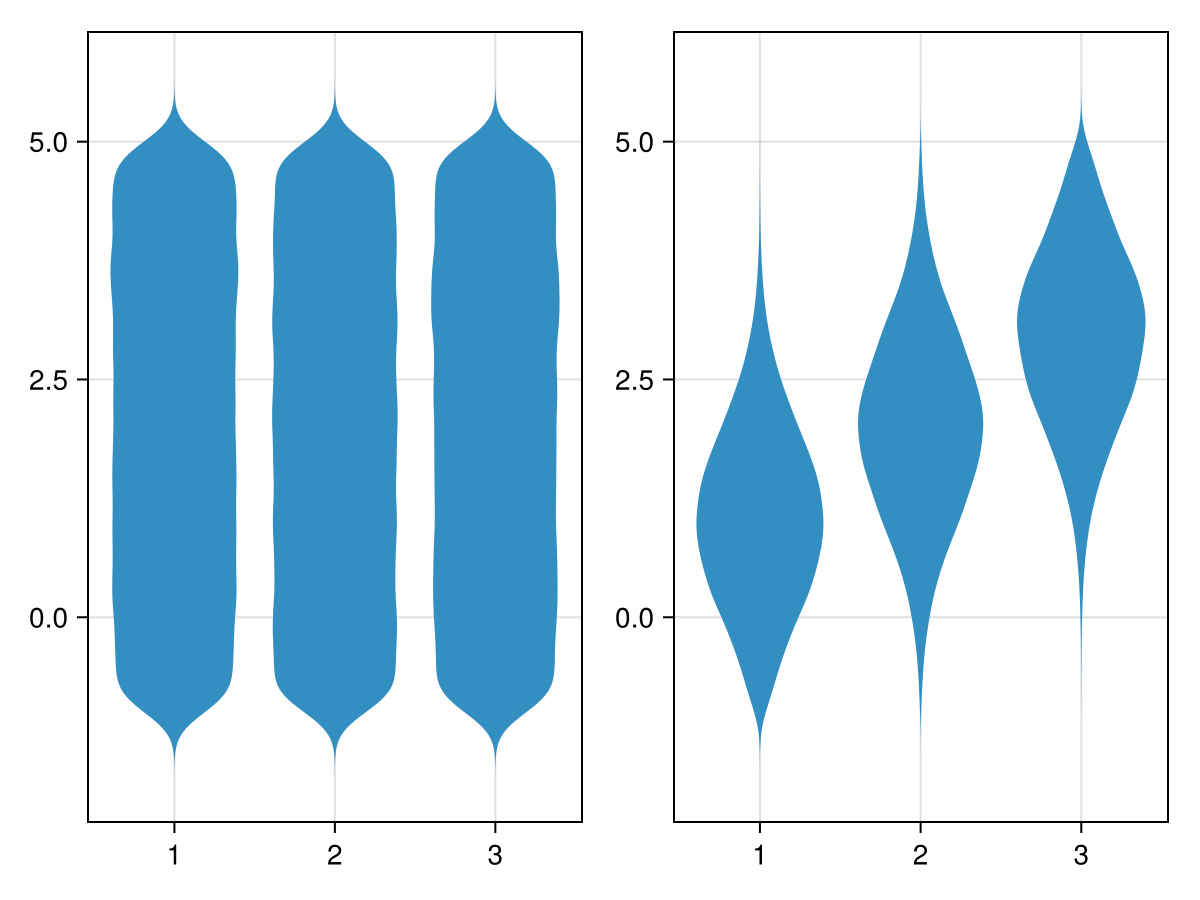
Horizontal axis
using CairoMakie
fig = Figure()

categories = rand(1:3, 1000)
values = randn(1000)

ax_vert = Axis(fig[1,1];
    xlabel = "categories",
    ylabel = "values",
    xticks = (1:3, ["one", "two", "three"])
)
ax_horiz = Axis(fig[1,2];
    xlabel="values", # note that x/y still correspond to horizontal/vertical axes respectively
    ylabel="categories",
    yticks=(1:3, ["one", "two", "three"])
)

# Note: same order of category/value, despite different axes
violin!(ax_vert, categories, values) # `orientation=:vertical` is default
violin!(ax_horiz, categories, values; orientation=:horizontal)

fig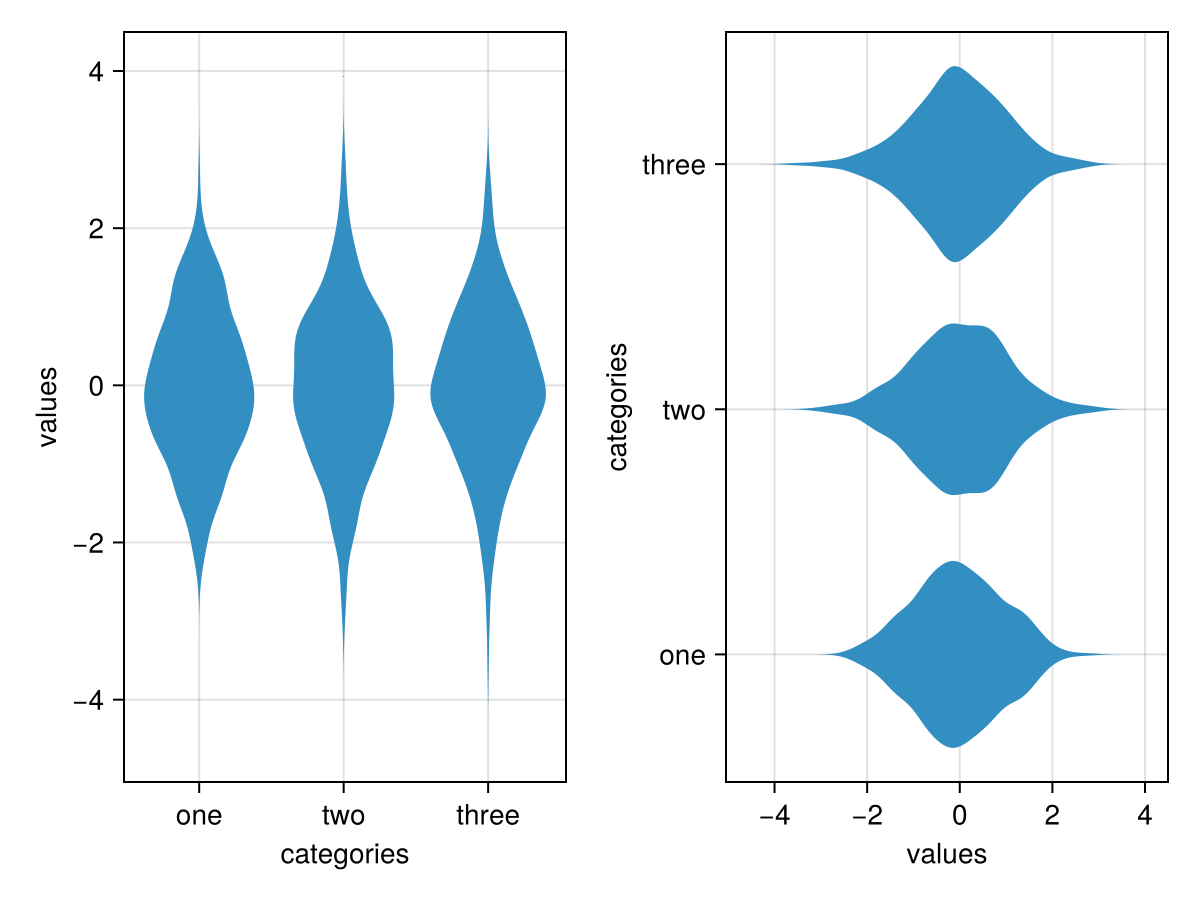
Attributes
bandwidth
Defaults to automatic
Kernel density bandwidth, determined automatically if automatic.
boundary
Defaults to automatic
Boundary of the density estimation, determined automatically if automatic.
clip_planes
Defaults to @inherit clip_planes automatic
Clip planes offer a way to do clipping in 3D space. You can set a Vector of up to 8 Plane3f planes here, behind which plots will be clipped (i.e. become invisible). By default clip planes are inherited from the parent plot or scene. You can remove parent clip_planes by passing Plane3f[].
color
Defaults to @inherit patchcolor
Sets the color of violin plots. Can be given per data point to set the color for individual violins or densities. For this the color within each data set must be consistent.
cycle
Defaults to [:color => :patchcolor]
Sets which attributes to cycle when creating multiple plots. The values to cycle through are defined by the parent Theme. Multiple cycled attributes can be set by passing a vector. Elements can
directly refer to a cycled attribute, e.g.
:colormap a cycled attribute to a palette attribute, e.g.
:linecolor => :colormap multiple cycled attributes to a palette attribute, e.g.
[:linecolor, :markercolor] => :color
datalimits
Defaults to (-Inf, Inf)
Specify values to trim the violin. Can be a Tuple or a Function (e.g. datalimits=extrema).
depth_shift
Defaults to 0.0
Adjusts the depth value of a plot after all other transformations, i.e. in clip space, where -1 <= depth <= 1. This only applies to GLMakie and WGLMakie and can be used to adjust render order (like a tunable overdraw).
dodge
Defaults to automatic
Dodge can be used to separate violins drawn at the same x position/category. For this each violin is given an integer value corresponding to its position relative to the given x positions. E.g. with positions = [1, 1, 1, 2, 2, 2] we have 3 violins at each position which can be separated by dodge = [1, 2, 3, 1, 2, 3].
dodge_gap
Defaults to 0.03
Sets the gap between dodged violins relative to their size.
fxaa
Defaults to true
Adjusts whether the plot is rendered with fxaa (fast approximate anti-aliasing, GLMakie only). Note that some plots implement a better native anti-aliasing solution (scatter, text, lines). For them fxaa = true generally lowers quality. Plots that show smoothly interpolated data (e.g. image, surface) may also degrade in quality as fxaa = true can cause blurring.
gap
Defaults to 0.2
Size of the gap between violins. The modified width is width * (1 - gap).
inspectable
Defaults to @inherit inspectable
Sets whether this plot should be seen by DataInspector. The default depends on the theme of the parent scene.
inspector_clear
Defaults to automatic
Sets a callback function (inspector, plot) -> ... for cleaning up custom indicators in DataInspector.
inspector_hover
Defaults to automatic
Sets a callback function (inspector, plot, index) -> ... which replaces the default show_data methods.
inspector_label
Defaults to automatic
Sets a callback function (plot, index, position) -> string which replaces the default label generated by DataInspector.
max_density
Defaults to automatic
Sets the maximum density value to which violin plots are scaled.
mediancolor
Defaults to @inherit linecolor
Sets the color of the median line.
medianlinewidth
Defaults to @inherit linewidth
Sets the width of the median line.
model
Defaults to automatic
Sets a model matrix for the plot. This overrides adjustments made with translate!, rotate! and scale!.
n_dodge
Defaults to automatic
Sets the maximum integer for dodge. This sets how many violins can be placed at a given position, controlling their width.
npoints
Defaults to 200
Number of points used per density plot.
orientation
Defaults to :vertical
Orientation of the violins (:vertical or :horizontal)
overdraw
Defaults to false
Controls if the plot will draw over other plots. This specifically means ignoring depth checks in GL backends
scale
Defaults to :area
Scale density by area (:area), count (:count), or width (:width).
show_median
Defaults to false
Show median as midline.
side
Defaults to :both
Specify :left or :right to only plot the density on one side of the violin. This can be set for each data point to source the left and right densities from different data sets.
space
Defaults to :data
Sets the transformation space for box encompassing the plot. See Makie.spaces() for possible inputs.
ssao
Defaults to false
Adjusts whether the plot is rendered with ssao (screen space ambient occlusion). Note that this only makes sense in 3D plots and is only applicable with fxaa = true.
strokecolor
Defaults to @inherit patchstrokecolor
Sets the outline color of violins or densities (if sampled separately). This requires strokewidth > 0.
strokewidth
Defaults to @inherit patchstrokewidth
Sets the width of the outline of violins or densities (if sampled separately).
transformation
Defaults to :automatic
Controls the inheritance or directly sets the transformations of a plot. Transformations include the transform function and model matrix as generated by translate!(...), scale!(...) and rotate!(...). They can be set directly by passing a Transformation() object or inherited from the parent plot or scene. Inheritance options include:
:automatic: Inherit transformations if the parent and childspaceis compatible:inherit: Inherit transformations:inherit_model: Inherit only model transformations:inherit_transform_func: Inherit only the transform function:nothing: Inherit neither, fully disconnecting the child's transformations from the parent
Another option is to pass arguments to the transform!() function which then get applied to the plot. For example transformation = (:xz, 1.0) which rotates the xy plane to the xz plane and translates by 1.0. For this inheritance defaults to :automatic but can also be set through e.g. (:nothing, (:xz, 1.0)).
transparency
Defaults to false
Adjusts how the plot deals with transparency. In GLMakie transparency = true results in using Order Independent Transparency.
visible
Defaults to true
Controls whether the plot gets rendered or not.
weights
Defaults to automatic
Vector of statistical weights (length of data). By default, each observation has weight 1.
width
Defaults to automatic
Sets the width of the bounding box of each violin. When dodge is used this sets combined width of all dodged violins in a single category/x value.