stem
Makie.stem Function
stem(xs, ys, [zs]; kwargs...)Plots markers at the given positions with stem lines extending from offset. All stems are connected to a trunk line.
The conversion trait of stem is PointBased.
Plot type
The plot type alias for the stem function is Stem.
Examples
using CairoMakie
f = Figure()
Axis(f[1, 1])

xs = LinRange(0, 4pi, 30)

stem!(xs, sin.(xs))

f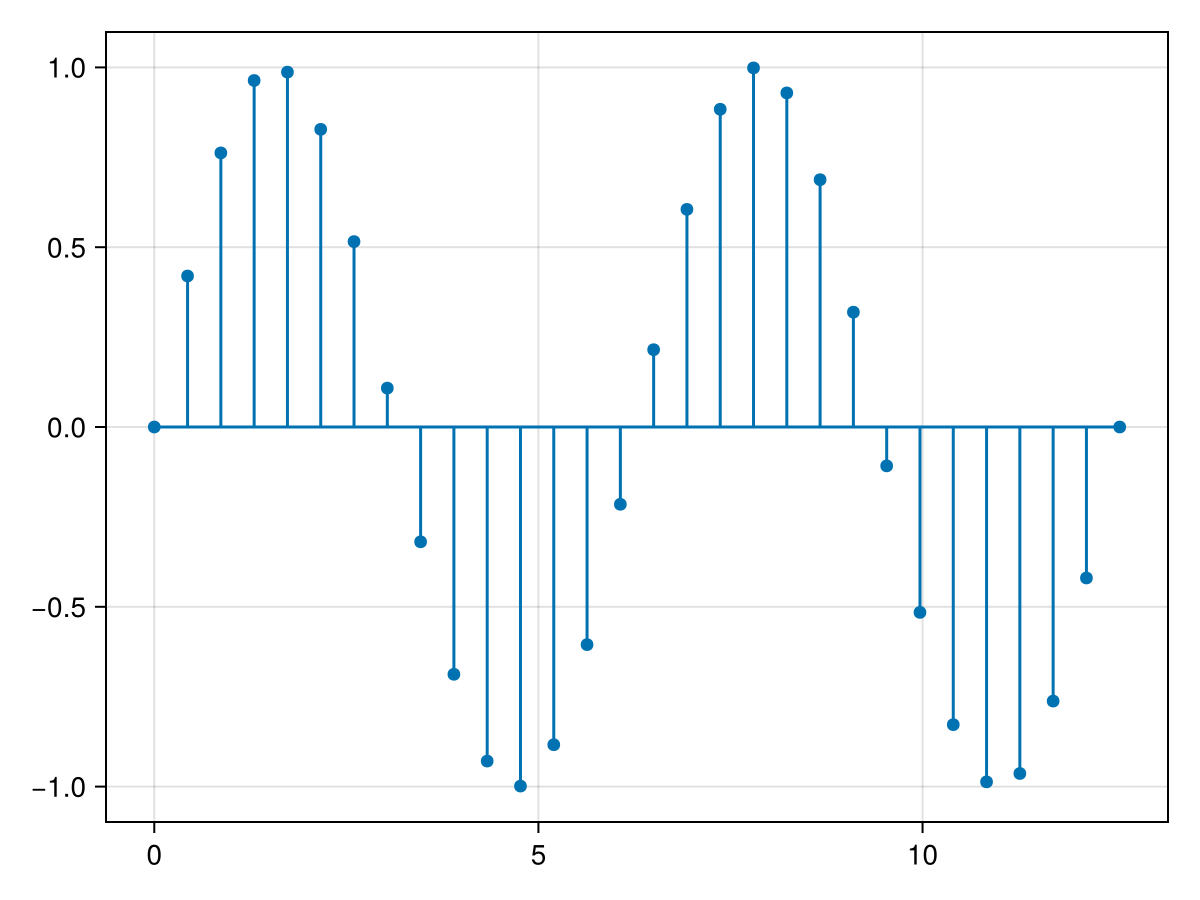
using CairoMakie
f = Figure()
Axis(f[1, 1])

xs = LinRange(0, 4pi, 30)

stem!(xs, sin,
    offset = 0.5, trunkcolor = :blue, marker = :rect,
    stemcolor = :red, color = :orange,
    markersize = 15, strokecolor = :red, strokewidth = 3,
    trunklinestyle = :dash, stemlinestyle = :dashdot)

f
using CairoMakie
f = Figure()
Axis(f[1, 1])

xs = LinRange(0, 4pi, 30)

stem!(xs, sin.(xs),
    offset = LinRange(-0.5, 0.5, 30),
    color = LinRange(0, 1, 30), colorrange = (0, 0.5),
    trunkcolor = LinRange(0, 1, 30), trunkwidth = 5)

f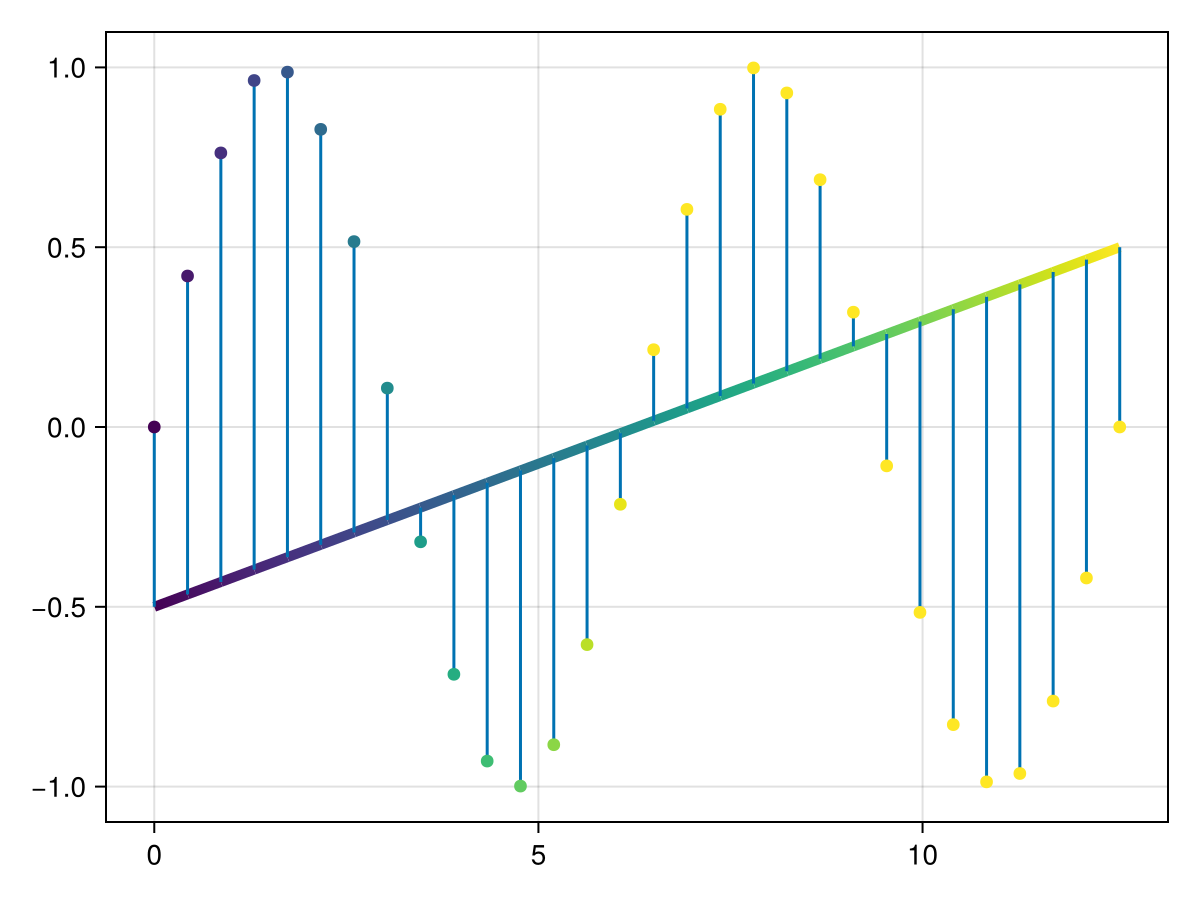
using GLMakie
f = Figure()

xs = LinRange(0, 4pi, 30)

stem(f[1, 1], 0.5xs, 2 .* sin.(xs), 2 .* cos.(xs),
    offset = Point3f.(0.5xs, sin.(xs), cos.(xs)),
    stemcolor = LinRange(0, 1, 30), stemcolormap = :Spectral, stemcolorrange = (0, 0.5))

f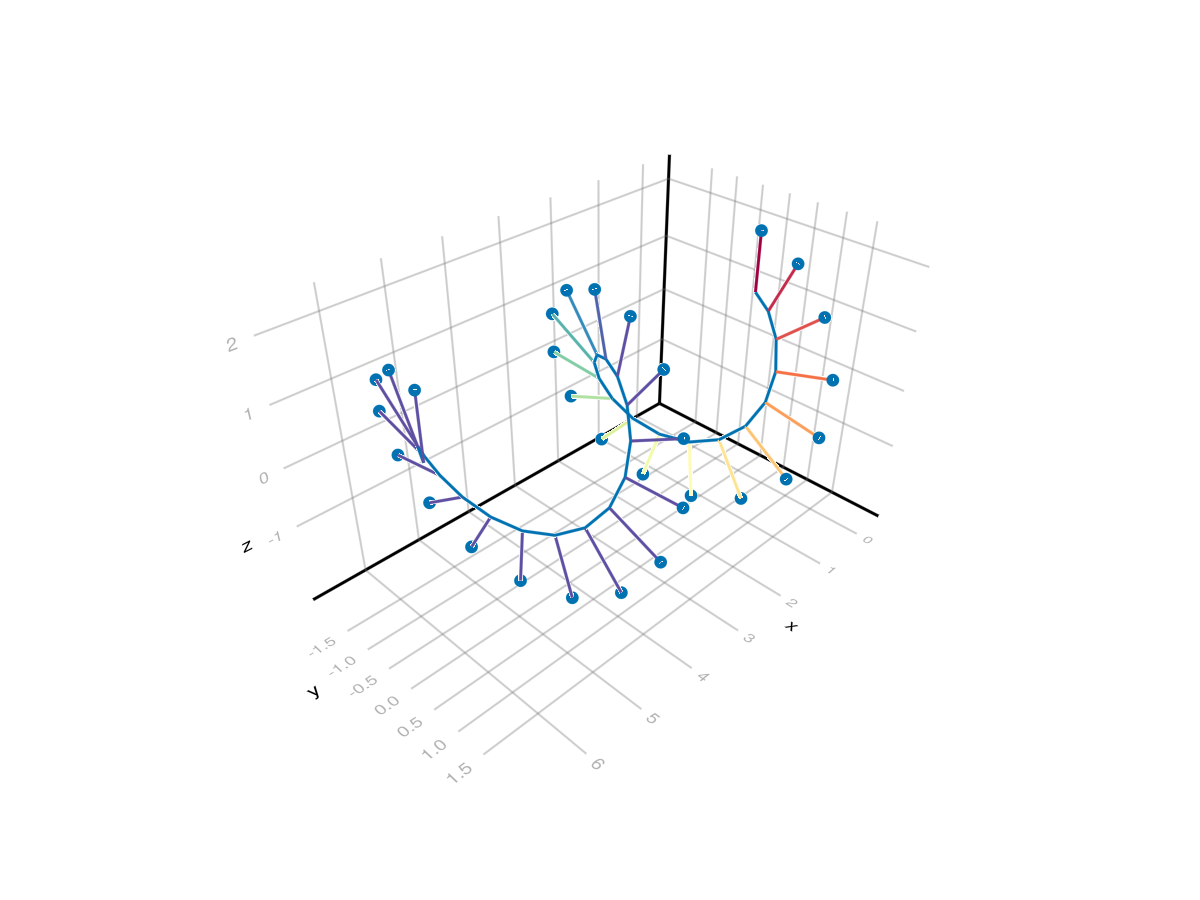
Attributes
clip_planes
Defaults to @inherit clip_planes automatic
Clip planes offer a way to do clipping in 3D space. You can set a Vector of up to 8 Plane3f planes here, behind which plots will be clipped (i.e. become invisible). By default clip planes are inherited from the parent plot or scene. You can remove parent clip_planes by passing Plane3f[].
color
Defaults to @inherit markercolor
Sets the color of markers.
colormap
Defaults to @inherit colormap
Sets the colormap of markers.
colorrange
Defaults to automatic
Sets the colorrange for markers.
colorscale
Defaults to identity
Sets the colorscale function for the trunk, stems and markers.
cycle
Defaults to [[:stemcolor, :color, :trunkcolor] => :color]
Sets which attributes to cycle when creating multiple plots. The values to cycle through are defined by the parent Theme. Multiple cycled attributes can be set by passing a vector. Elements can
directly refer to a cycled attribute, e.g.
:colormap a cycled attribute to a palette attribute, e.g.
:linecolor => :colormap multiple cycled attributes to a palette attribute, e.g.
[:linecolor, :markercolor] => :color
depth_shift
Defaults to 0.0
Adjusts the depth value of a plot after all other transformations, i.e. in clip space, where -1 <= depth <= 1. This only applies to GLMakie and WGLMakie and can be used to adjust render order (like a tunable overdraw).
fxaa
Defaults to true
Adjusts whether the plot is rendered with fxaa (fast approximate anti-aliasing, GLMakie only). Note that some plots implement a better native anti-aliasing solution (scatter, text, lines). For them fxaa = true generally lowers quality. Plots that show smoothly interpolated data (e.g. image, surface) may also degrade in quality as fxaa = true can cause blurring.
inspectable
Defaults to @inherit inspectable
Sets whether this plot should be seen by DataInspector. The default depends on the theme of the parent scene.
inspector_clear
Defaults to automatic
Sets a callback function (inspector, plot) -> ... for cleaning up custom indicators in DataInspector.
inspector_hover
Defaults to automatic
Sets a callback function (inspector, plot, index) -> ... which replaces the default show_data methods.
inspector_label
Defaults to automatic
Sets a callback function (plot, index, position) -> string which replaces the default label generated by DataInspector.
marker
Defaults to :circle
Sets the marker used for the endpoints of stems
markersize
Defaults to @inherit markersize
Sets the size of markers in pixel units.
model
Defaults to automatic
Sets a model matrix for the plot. This overrides adjustments made with translate!, rotate! and scale!.
offset
Defaults to 0
Offsets the trunk and stem startpoint from 0. Can be a number, in which case it sets y for 2D, and z for 3D stems. It can be a Point2 for 2D plots, as well as a Point3 for 3D plots. It can also be an iterable of any of these at the same length as xs, ys, zs.
overdraw
Defaults to false
Controls if the plot will draw over other plots. This specifically means ignoring depth checks in GL backends
space
Defaults to :data
Sets the transformation space for box encompassing the plot. See Makie.spaces() for possible inputs.
ssao
Defaults to false
Adjusts whether the plot is rendered with ssao (screen space ambient occlusion). Note that this only makes sense in 3D plots and is only applicable with fxaa = true.
stemcolor
Defaults to @inherit linecolor
Sets the color of stem lines. Can be a Symbol, Colorant, Real or Vector thereof.
stemcolormap
Defaults to @inherit colormap
Sets the colormap for stem lines which maps numbers to colors.
stemcolorrange
Defaults to automatic
Sets the colorrange for stem lines which limits the value range for colormapping.
stemlinestyle
Defaults to nothing
Sets the linestyle of stem lines. See ?lines.
stemwidth
Defaults to @inherit linewidth
Sets the linewidth of stems.
strokecolor
Defaults to @inherit markerstrokecolor
Sets the strokecolor of markers.
strokewidth
Defaults to @inherit markerstrokewidth
Sets the strokewidth of markers.
transformation
Defaults to :automatic
Controls the inheritance or directly sets the transformations of a plot. Transformations include the transform function and model matrix as generated by translate!(...), scale!(...) and rotate!(...). They can be set directly by passing a Transformation() object or inherited from the parent plot or scene. Inheritance options include:
:automatic: Inherit transformations if the parent and childspaceis compatible:inherit: Inherit transformations:inherit_model: Inherit only model transformations:inherit_transform_func: Inherit only the transform function:nothing: Inherit neither, fully disconnecting the child's transformations from the parent
Another option is to pass arguments to the transform!() function which then get applied to the plot. For example transformation = (:xz, 1.0) which rotates the xy plane to the xz plane and translates by 1.0. For this inheritance defaults to :automatic but can also be set through e.g. (:nothing, (:xz, 1.0)).
transparency
Defaults to false
Adjusts how the plot deals with transparency. In GLMakie transparency = true results in using Order Independent Transparency.
trunkcolor
Defaults to @inherit linecolor
Sets the color for the trunk line.
trunkcolormap
Defaults to @inherit colormap
Sets the colormap for the trunk line.
trunkcolorrange
Defaults to automatic
Sets the colorrange for the trunk line.
trunklinestyle
Defaults to nothing
Sets the linestyle for the trunk line.
trunkwidth
Defaults to @inherit linewidth
Sets the linewidth for the trunk line.
visible
Defaults to true
Controls whether the plot gets rendered or not.