Pixel Perfect Rendering
Let's say you have some data in a matrix and want to plot it exactly as it is. More explicitly you want each drawn pixel to sample from exactly one value of your matrix with no interpolation taking place. This tutorial will explain how to do this.
heatmap and image
To draw a matrix of values we can use image or heatmap. With their default setting image is interpolated and uses a grayscale colormap while heatmap is pixelated and uses a colorful colormap (viridis). They also differ in their placement of cells or "pixels". In image you can set where the plot starts and ends, i.e. you set where the left edge of the left most pixel and the right edge of right most pixel is. (Same for the bottom and top pixels.) In heatmap you usually set where the cells centers are, though you can also set the edges by passing size + 1 x and y values. With the right settings both can be made to look the same:
using CairoMakie
using CairoMakie

data = [1 2; 3 4; 5 6]

f = Figure()

a1, p = image(f[1, 1], data)
a2, p = heatmap(f[1, 2], data)

# 0..3, 0..2 is the default, we could omit it
a3, p = image(f[2, 1], 0..3, 0..2, data, colormap = :viridis, interpolate = false)
a4, p = heatmap(f[2, 2], 0:3, 0:2, data, colormap = :viridis, interpolate = false)
# Note that length(0:3), length(0:2) == size(data) .+ 1

limits!.([a1, a2, a3, a4], -1, 4, -1, 3)

f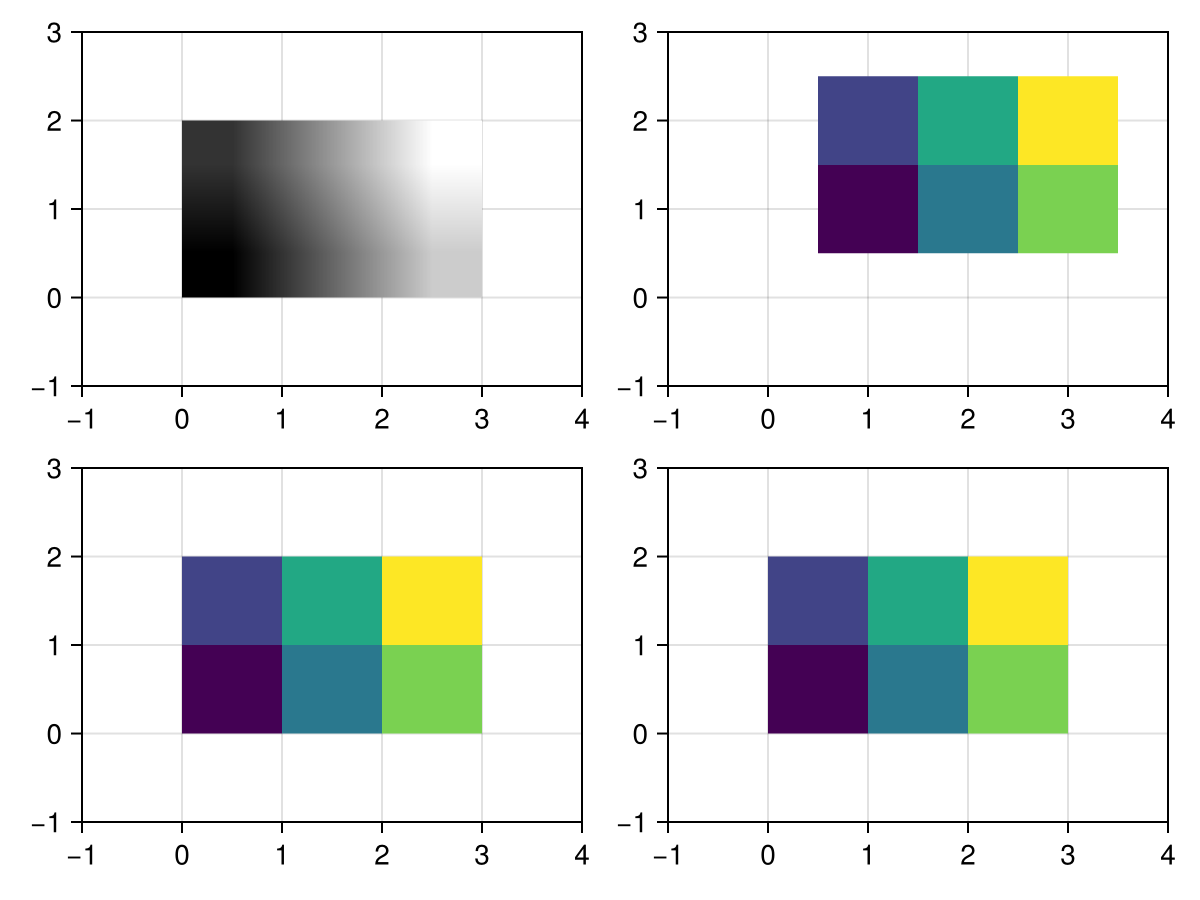
Full Screen Plot
Let us consider the case of creating a plain image from some data, without any of the usual Axis decorations. In this case it is not useful to work with Figure and Axis as they both use up space through padding and layouting. Instead, we use a Scene directly. An empty scene of a specific size can be created with
using CairoMakie
using CairoMakie

scene = Scene(size = (200, 100), camera = campixel!)
Here we explicitly set camera = campixel! so that the scene uses pixel units. More specifically, this sets the bottom left corner of the scene to (0, 0) and the top right corner to size. Using those limits we can now draw an image (or heatmap) plot filling the scene exactly:
using CairoMakie
using CairoMakie

data = [ifelse(x > 180, 0, x/100) * ifelse(y > 80, 0, y/50) for x in 1:200, y in 1:100]

scene = Scene(size = (200, 100), camera = campixel!)

# image will have the correct limits by default (0..200, 0..100)
image!(scene, data, colormap = :viridis, interpolate = false)

# alternatively with heatmap:
# heatmap!(scene, 0:200, 0:100, data)

scene
If we want to enlarge the image we can simply adjust the size of the scene and the limits of the plot. For heatmap we need to be a bit careful though because 0:600 is going to give us 601 values rather than the 201 we need. To fix this we will need to explicitly include the size of each cell as the step of range.
using CairoMakie
using CairoMakie

data = [ifelse(x > 180, 0, x/100) * ifelse(y > 80, 0, y/50) for x in 1:200, y in 1:100]
scene = Scene(size = (3 * 200, 2 * 100), camera = campixel!)
image!(scene, 0..600, 0..200, data, colormap = :viridis, interpolate = false)
# heatmap!(scene, 0:3:600, 0:2:200, data)

scene
Another option is to change px_per_unit when saving the scene. Using Makie.save(filename, scene, px_per_unit = 2) each "pixel" in the scene is represented by 2 pixels in the saved image. This does not affect the limits of the plot, i.e. in a (200, 100) scene you should use (200, 100) as the limits in your plots. (If you check the images generated here you will see that they have twice the size given to the scene because the documentation renders with pixel_per_unit = 2)
Notes
Camera
While the pixel camera is intuitive to use in this context it is not necessary. If you create a scene without a camera, it will default to a clip space camera. With that the size of coordinates of the scene always range from -1 to 1. That may simplify plotting a bit, as you don't have to adjust the image limits when adjusting the scene limits:
using CairoMakie
using CairoMakie

data = [ifelse(x > 180, 0, x/100) * ifelse(y > 80, 0, y/50) for x in 1:200, y in 1:100]
scene = Scene(size = (3 * 200, 2 * 100))
image!(scene, -1..1, -1..1, data, colormap = :viridis, interpolate = false)
scene
Similarly you can also use camera = cam_relative! to get 0..1 coordinates.
GLMakie Anti-aliasing
GLMakie uses FXAA to smooth out hard edges in the rendered image. That means it will interpolate and/or blur pixels with significant brightness differences. This is something we don't want here, so we should turn it off:
using GLMakie
using GLMakie

data = [ifelse(x > 180, 0, x/100) * ifelse(y > 80, 0, y/50) for x in 1:200, y in 1:100]
scene = Scene(size = (3 * 200, 2 * 100))
image!(scene, -1..1, -1..1, data, colormap = :viridis, interpolate = false, fxaa = false)
scene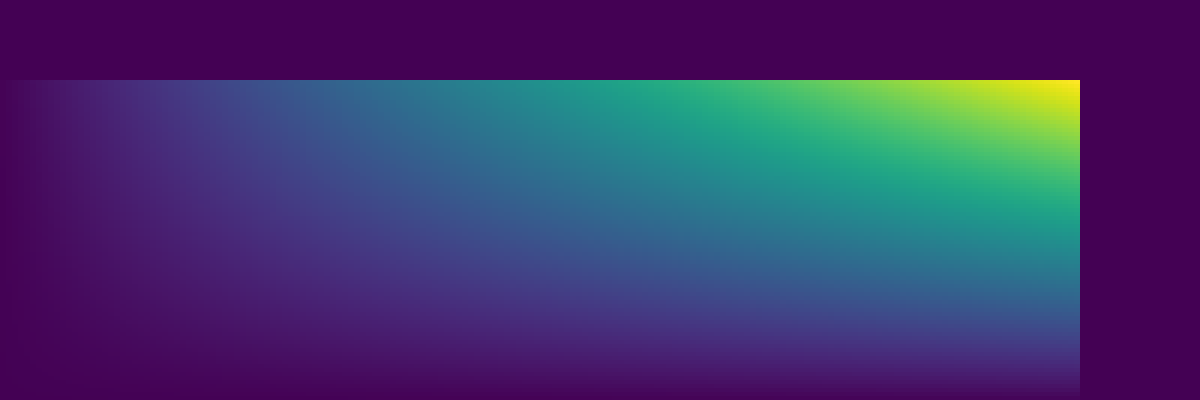
WGLMakie uses MSAA instead, which samples each pixel at multiple sub-pixels. With a pixel-perfect mapping this will sample the same color multiple times, resulting in the same final color. So in WGLMakie we don't have this problem.
Pixel Perfect Plotting in a Figure
Using LScene
If you want to plot multiple pixel perfect matrices using a Figure for layouting is quite useful. We can continue relying on the Scene mechanics we used above by using an LScene. Here we will need to set the width and height instead of size to let layouting know how much space the LScene needs. resize_to_layout!() is also quite useful to fit the Figure to the size of the scenes:
using CairoMakie
using CairoMakie

# length(50:50) = 101
data = [x*y/1000 for x in -50:50, y in -50:50]

fig = Figure()

s1 = LScene(fig[1, 1], width = 101, height = 101, show_axis = false, scenekw = (camera = cam_relative!,))
image!(s1, 0..1, 0..1, data, colormap = :viridis, interpolate = false)

s2 = LScene(fig[1, 2], width = 101, height = 101, show_axis = false, scenekw = (camera = campixel!,))
heatmap!(s2, 0:101, 0:101, data)

resize_to_layout!(fig)
fig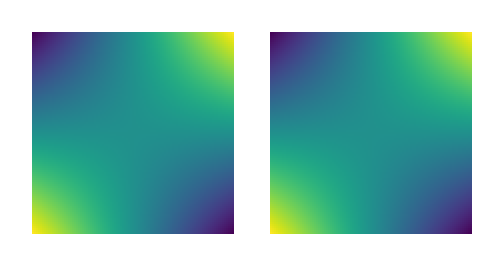
To control the white space the figure generates, you can adjust Figure(figure_padding = ...) for the outer padding and rowgap!(fig, ...) and colgap!(fig.layout, ...) for the inner gaps.
Using Axis
If you want to plot to an Axis you can effectively just replace LScene in the example above:
using CairoMakie
using CairoMakie

# length(50:50) = 101
data = [x*y/1000 for x in -50:50, y in -50:50]

fig = Figure()

a1 = Axis(fig[1, 1], width = 101, height = 101)
image!(a1, data, colormap = :viridis, interpolate = false)

a2 = Axis(fig[1, 2], width = 101, height = 101)
heatmap!(a2, data)

resize_to_layout!(fig)
fig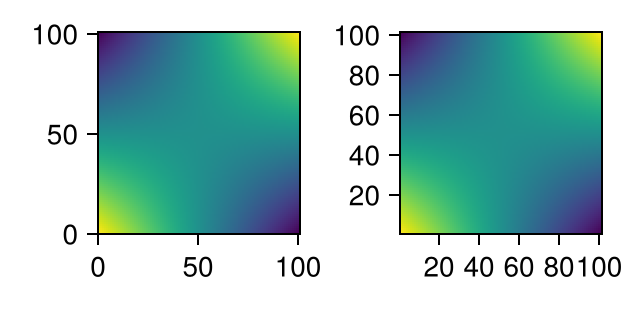
For image and heatmap the axis will choose limits tightly aligned to the respective plot. Therefore you don't need to match the x and y values of the plot to the dimensions of the data and Axis. However you may still want to set them for heatmap so ticks are not aligned to cell centers. You may also want to turn off the spines (leftspinevisible = false etc) as they overlap the edge of the image.