qqplot
Makie.qqplot Function
qqplot(x, y; kwargs...)
qqplot(y; distribution, kwargs...)
Draw a Q-Q plot, comparing quantiles of two distributions. y must be a list of samples, i.e., AbstractVector{<:Real}, whereas x can be
a list of samples,
an abstract distribution, e.g.
Normal(0, 1),a distribution type, e.g.
Normal.
In the last case, the distribution type is fitted to the data y.
If only one positional argument is given, this must be a vector y and the distribution to use or distribution type to fit must be given as the keyword argument distribution.
The attribute qqline (defaults to :none) determines how to compute a fit line for the Q-Q plot. Possible values are the following.
:identitydraws the identity line.:fitcomputes a least squares line fit of the quantile pairs.:fitrobustcomputes the line that passes through the first and third quartiles of the distributions.:noneomits drawing the line.
Broadly speaking, qqline = :identity is useful to see if x and y follow the same distribution, whereas qqline = :fit and qqline = :fitrobust are useful to see if the distribution of y can be obtained from the distribution of x via an affine transformation.
Plot type
The plot type alias for the qqplot function is QQPlot.
Examples
Test if xs and ys follow the same distribution.
using CairoMakie
xs = randn(100)
ys = randn(100)

qqplot(xs, ys, qqline = :identity)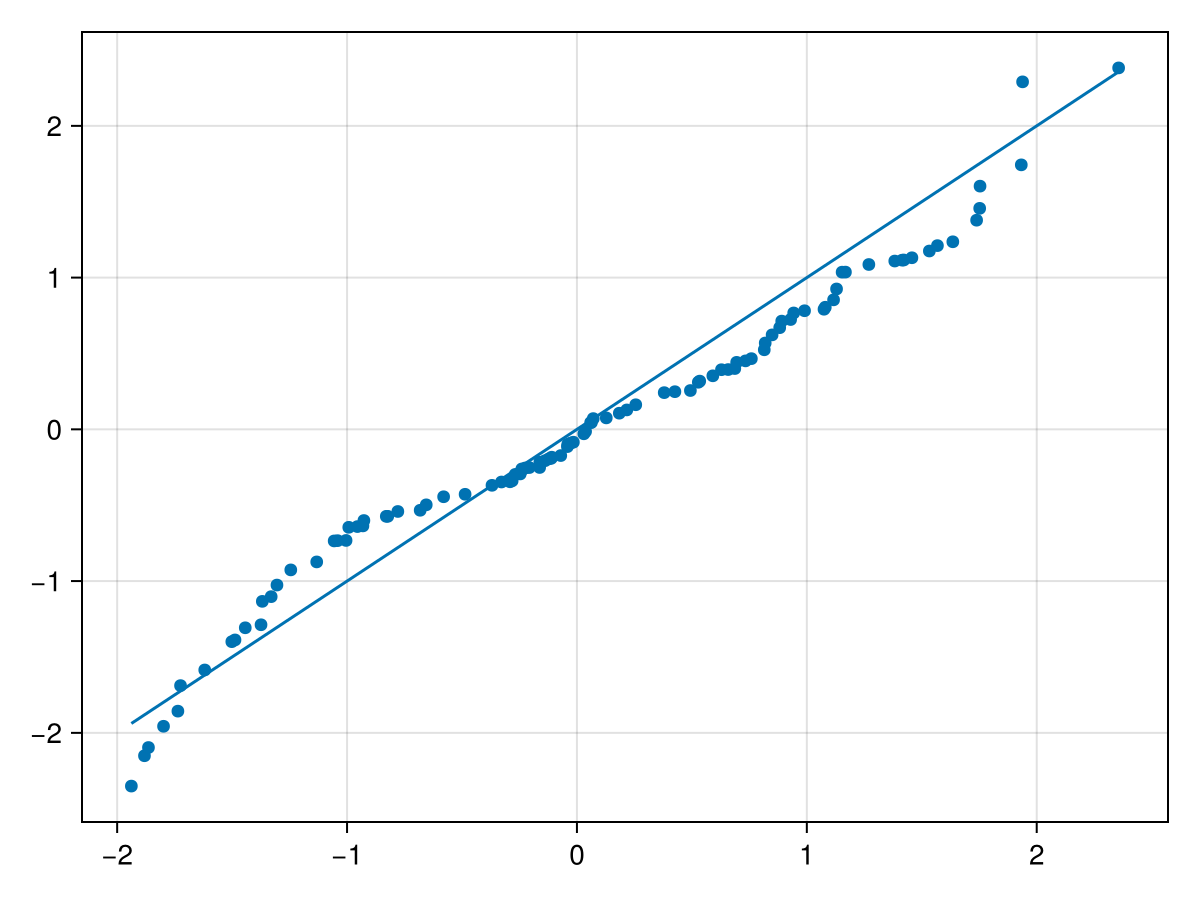
Check if xs follows a Normal distribution which is fit to the data first. Alternatively, you can pass a specific Normal distribution to use, like Normal(0, 1).
using CairoMakie
using Distributions

xs = randn(100)

qqplot(Normal, xs, qqline = :identity)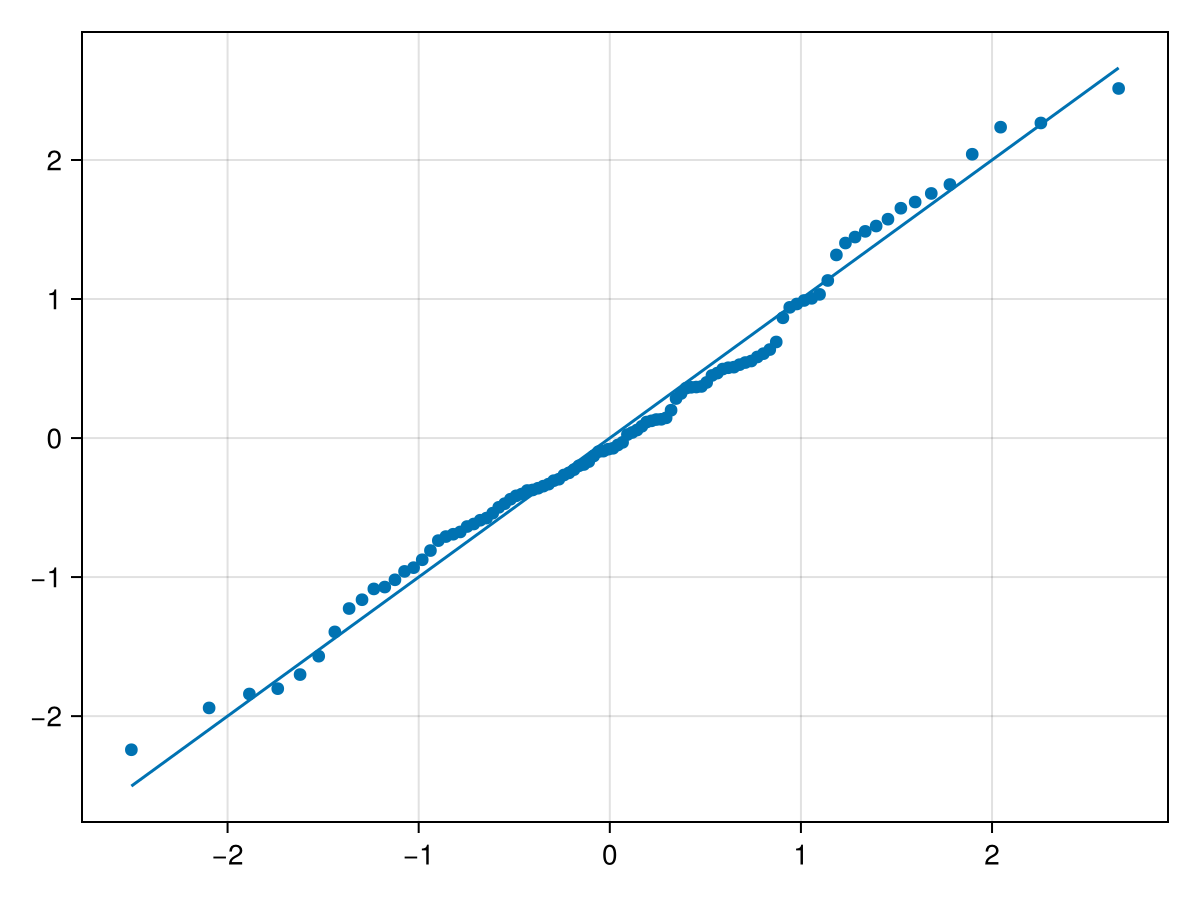
An alternative syntax is giving the data as the sole positional argument and passing the distribution via the distribution keyword. This syntax is compatible with AlgebraOfGraphics where currently only array-valued positional arguments can be used.
using CairoMakie
using Distributions

xs = randn(100)

qqplot(xs, distribution = Normal(0, 1), qqline = :identity)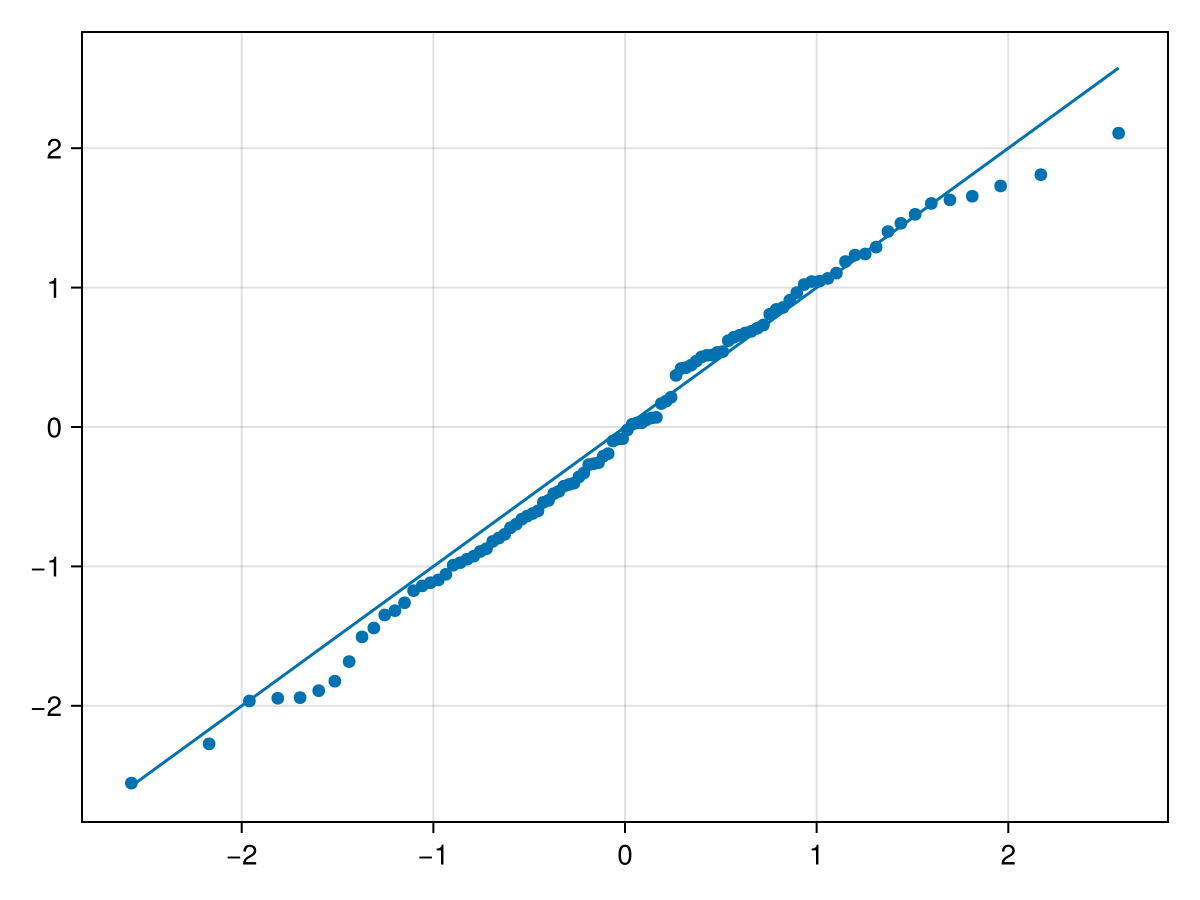
Attributes
alpha
Defaults to 1.0
The alpha value of the colormap or color attribute. Multiple alphas like in plot(alpha=0.2, color=(:red, 0.5)), will get multiplied.
clip_planes
Defaults to @inherit clip_planes automatic
Clip planes offer a way to do clipping in 3D space. You can set a Vector of up to 8 Plane3f planes here, behind which plots will be clipped (i.e. become invisible). By default clip planes are inherited from the parent plot or scene. You can remove parent clip_planes by passing Plane3f[].
color
Defaults to @inherit linecolor
The color of the line, and by default also of the scatter markers.
colormap
Defaults to @inherit colormap :viridis
Sets the colormap that is sampled for numeric colors. PlotUtils.cgrad(...), Makie.Reverse(any_colormap) can be used as well, or any symbol from ColorBrewer or PlotUtils. To see all available color gradients, you can call Makie.available_gradients().
colorrange
Defaults to automatic
The values representing the start and end points of colormap.
colorscale
Defaults to identity
The color transform function. Can be any function, but only works well together with Colorbar for identity, log, log2, log10, sqrt, logit, Makie.pseudolog10, Makie.Symlog10, Makie.AsinhScale, Makie.SinhScale, Makie.LogScale, Makie.LuptonAsinhScale, and Makie.PowerScale.
cycle
Defaults to [:color]
Sets which attributes to cycle when creating multiple plots. The values to cycle through are defined by the parent Theme. Multiple cycled attributes can be set by passing a vector. Elements can
directly refer to a cycled attribute, e.g.
:colormap a cycled attribute to a palette attribute, e.g.
:linecolor => :colormap multiple cycled attributes to a palette attribute, e.g.
[:linecolor, :markercolor] => :color
depth_shift
Defaults to 0.0
Adjusts the depth value of a plot after all other transformations, i.e. in clip space, where -1 <= depth <= 1. This only applies to GLMakie and WGLMakie and can be used to adjust render order (like a tunable overdraw).
depthsorting
Defaults to false
Enables depth-sorting of markers which can improve border artifacts. Currently supported in GLMakie only.
distancefield
Defaults to nothing
Optional distancefield used for e.g. font and bezier path rendering. Will get set automatically.
font
Defaults to "default"
Sets the font to be used for character markers
fxaa
Defaults to false
Adjusts whether the plot is rendered with fxaa (fast approximate anti-aliasing, GLMakie only). Note that some plots implement a better native anti-aliasing solution (scatter, text, lines). For them fxaa = true generally lowers quality. Plots that show smoothly interpolated data (e.g. image, surface) may also degrade in quality as fxaa = true can cause blurring.
glowcolor
Defaults to (:black, 0.0)
Sets the color of the glow effect around the marker.
glowwidth
Defaults to 0.0
Sets the size of a glow effect around the marker.
highclip
Defaults to automatic
The color for any value above the colorrange.
inspectable
Defaults to @inherit inspectable
Sets whether this plot should be seen by DataInspector. The default depends on the theme of the parent scene.
inspector_clear
Defaults to automatic
Sets a callback function (inspector, plot) -> ... for cleaning up custom indicators in DataInspector.
inspector_hover
Defaults to automatic
Sets a callback function (inspector, plot, index) -> ... which replaces the default show_data methods.
inspector_label
Defaults to automatic
Sets a callback function (plot, index, position) -> string which replaces the default label generated by DataInspector.
linecap
Defaults to @inherit linecap
Sets the type of line cap used. Options are :butt (flat without extrusion), :square (flat with half a linewidth extrusion) or :round.
linestyle
Defaults to nothing
Sets the dash pattern of the line. Options are :solid (equivalent to nothing), :dot, :dash, :dashdot and :dashdotdot. These can also be given in a tuple with a gap style modifier, either :normal, :dense or :loose. For example, (:dot, :loose) or (:dashdot, :dense).
For custom patterns have a look at Makie.Linestyle.
linewidth
Defaults to @inherit linewidth
Sets the width of the line in screen units
lowclip
Defaults to automatic
The color for any value below the colorrange.
marker
Defaults to @inherit marker
Sets the scatter marker.
marker_offset
Defaults to Vec3f(0)
The offset of the marker from the given position in markerspace units. An offset of 0 corresponds to a centered marker.
markercolor
Defaults to automatic
Sets the color of scatter markers. These default to color
markercolormap
Defaults to automatic
Sets the colormap for scatter markers. This defaults to colormap
markercolorrange
Defaults to automatic
Sets the colorrange for scatter markers. This defaults to colorrange
markersize
Defaults to @inherit markersize
Sets the size of the marker by scaling it relative to its base size which can differ for each marker. A Real scales x and y dimensions by the same amount. A Vec or Tuple with two elements scales x and y separately. An array of either scales each marker separately. Humans perceive the area of a marker as its size which grows quadratically with markersize, so multiplying markersize by 2 results in a marker that is 4 times as large, visually.
markerspace
Defaults to :pixel
Sets the space in which markersize is given. See Makie.spaces() for possible inputs
model
Defaults to automatic
Sets a model matrix for the plot. This overrides adjustments made with translate!, rotate! and scale!.
nan_color
Defaults to :transparent
The color for NaN values.
overdraw
Defaults to false
Controls if the plot will draw over other plots. This specifically means ignoring depth checks in GL backends
rotation
Defaults to Billboard()
Sets the rotation of the marker. A Billboard rotation is always around the depth axis.
space
Defaults to :data
Sets the transformation space for box encompassing the plot. See Makie.spaces() for possible inputs.
ssao
Defaults to false
Adjusts whether the plot is rendered with ssao (screen space ambient occlusion). Note that this only makes sense in 3D plots and is only applicable with fxaa = true.
strokecolor
Defaults to @inherit markerstrokecolor
Sets the color of the outline around a marker.
strokewidth
Defaults to @inherit markerstrokewidth
Sets the width of the outline around a marker.
transform_marker
Defaults to false
Controls whether the model matrix (without translation) applies to the marker itself, rather than just the positions. (If this is true, scale! and rotate! will affect the marker.
transformation
Defaults to :automatic
Controls the inheritance or directly sets the transformations of a plot. Transformations include the transform function and model matrix as generated by translate!(...), scale!(...) and rotate!(...). They can be set directly by passing a Transformation() object or inherited from the parent plot or scene. Inheritance options include:
:automatic: Inherit transformations if the parent and childspaceis compatible:inherit: Inherit transformations:inherit_model: Inherit only model transformations:inherit_transform_func: Inherit only the transform function:nothing: Inherit neither, fully disconnecting the child's transformations from the parent
Another option is to pass arguments to the transform!() function which then get applied to the plot. For example transformation = (:xz, 1.0) which rotates the xy plane to the xz plane and translates by 1.0. For this inheritance defaults to :automatic but can also be set through e.g. (:nothing, (:xz, 1.0)).
transparency
Defaults to false
Adjusts how the plot deals with transparency. In GLMakie transparency = true results in using Order Independent Transparency.
visible
Defaults to true
Controls whether the plot gets rendered or not.