triplot
Makie.triplot Function
triplot(x, y; kwargs...)
triplot(positions; kwargs...)
triplot(triangles::Triangulation; kwargs...)
Plots a triangulation based on the provided position or Triangulation from DelaunayTriangulation.jl.
Plot type
The plot type alias for the triplot function is Triplot.
Examples
A triplot plots a triangle mesh generated from an arbitrary set of points. The input data can either be point based (like scatter or lines) or a Triangulation from DelaunayTriangulation.jl.
using CairoMakie
using DelaunayTriangulation

using Random
Random.seed!(1234)

points = randn(Point2f, 50)
f, ax, tr = triplot(points, show_points = true, triangle_color = :lightblue)

tri = triangulate(points)
ax, tr = triplot(f[1, 2], tri, show_points = true)
f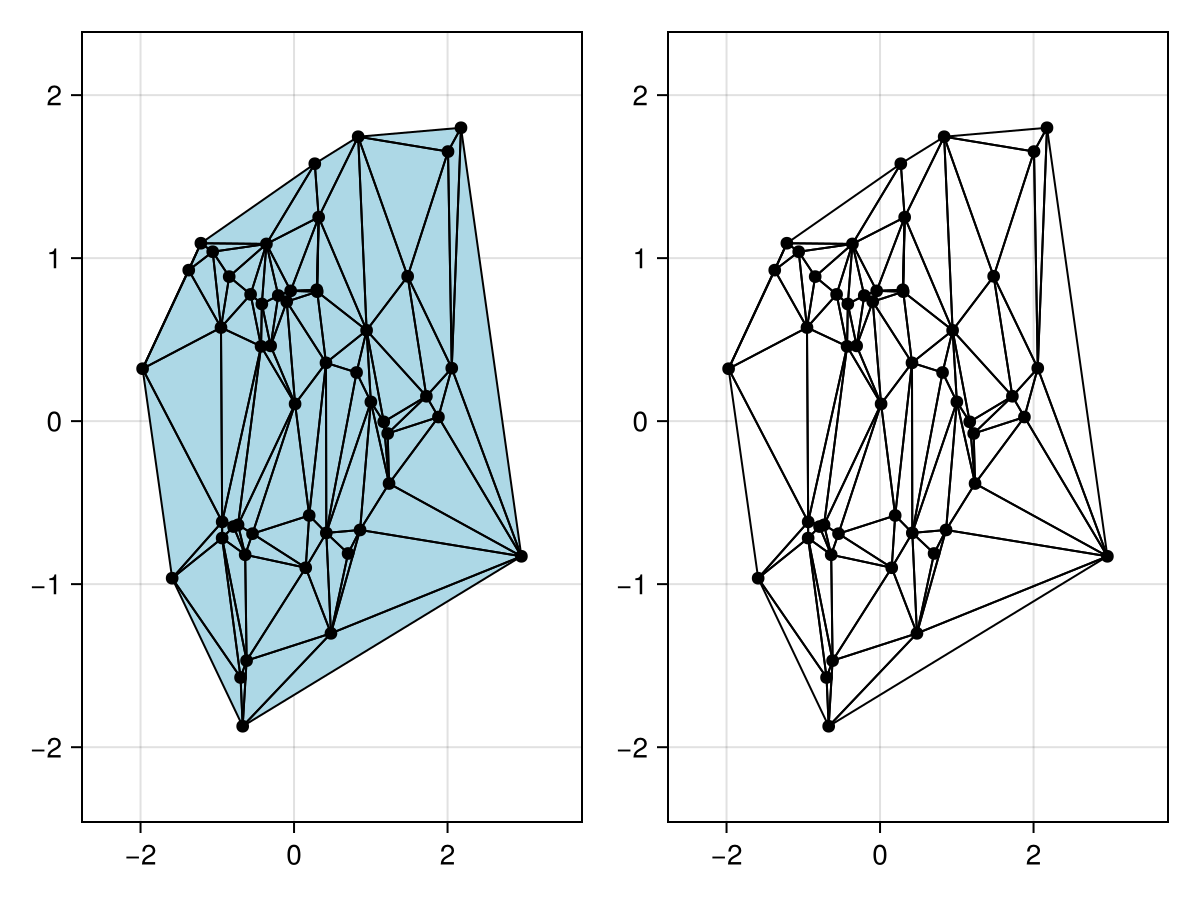
You can use triplot to visualise the ghost edges surrounding the boundary.
using CairoMakie
using DelaunayTriangulation

n = 20
angles = range(0, 2pi, length = n+1)[1:end-1]
x = [cos.(angles); 2 .* cos.(angles .+ pi/n)]
y = [sin.(angles); 2 .* sin.(angles .+ pi/n)]
inner = [n:-1:1; n] # clockwise inner
outer = [(n+1):(2n); n+1] # counter-clockwise outer
boundary_nodes = [[outer], [inner]]
points = [x'; y']
tri = triangulate(points; boundary_nodes = boundary_nodes)

f, ax, tr = triplot(tri; show_ghost_edges = true, show_points = true)
f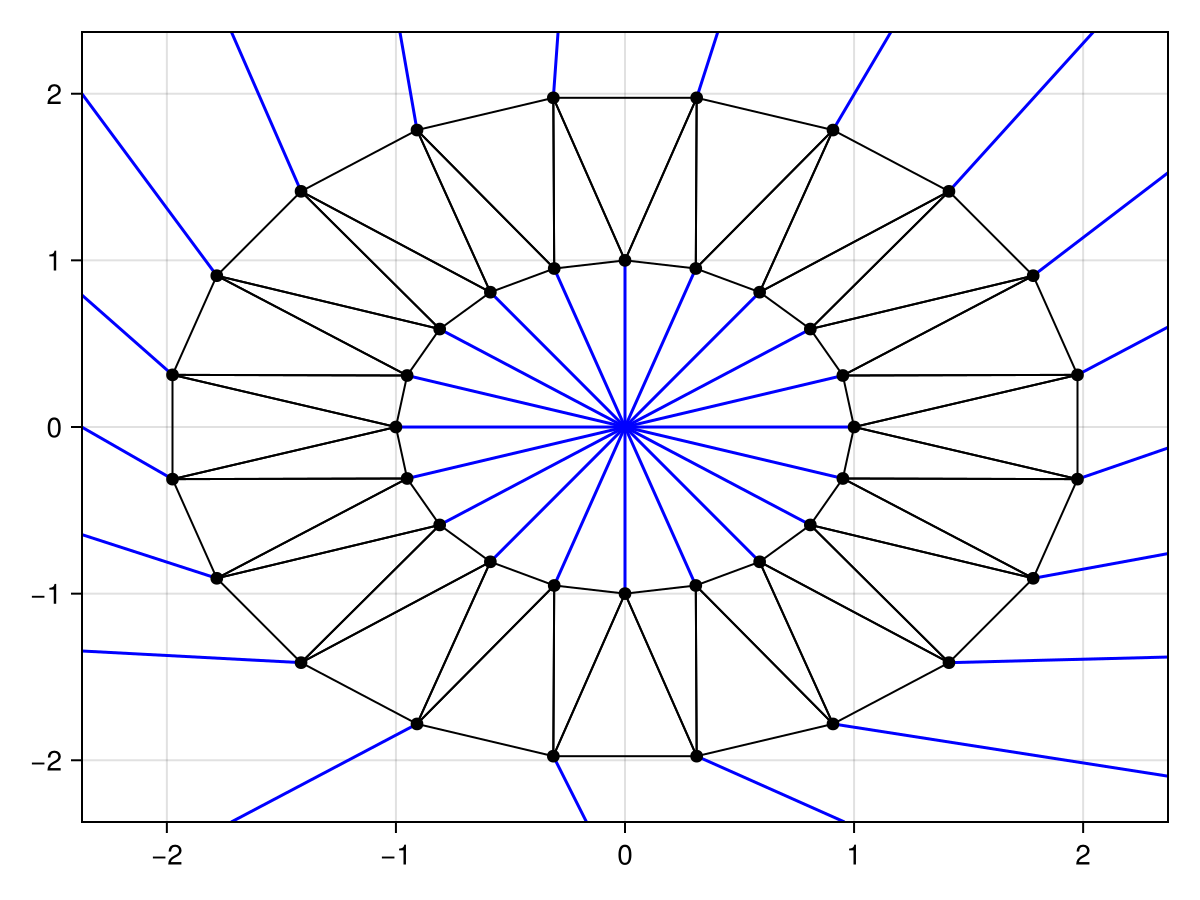
You can also highlight the constrained edges and display the convex hull, which is especially useful when the triangulation is no longer convex.
using CairoMakie
using DelaunayTriangulation

using Random
Random.seed!(1234)

outer = [
    (0.0,0.0),(2.0,1.0),(4.0,0.0),
    (6.0,2.0),(2.0,3.0),(3.0,4.0),
    (6.0,6.0),(0.0,6.0),(0.0,0.0)
]
inner = [
    (1.0,5.0),(2.0,4.0),(1.01,1.01),
    (1.0,1.0),(0.99,1.01),(1.0,5.0)
]
boundary_points = [[outer], [inner]]
boundary_nodes, points = convert_boundary_points_to_indices(boundary_points)
tri = triangulate(points; boundary_nodes = boundary_nodes)
refine!(tri; max_area=1e-3*get_area(tri))

f, ax, tr = triplot(tri, show_constrained_edges = true, constrained_edge_linewidth = 4, show_convex_hull = true)
f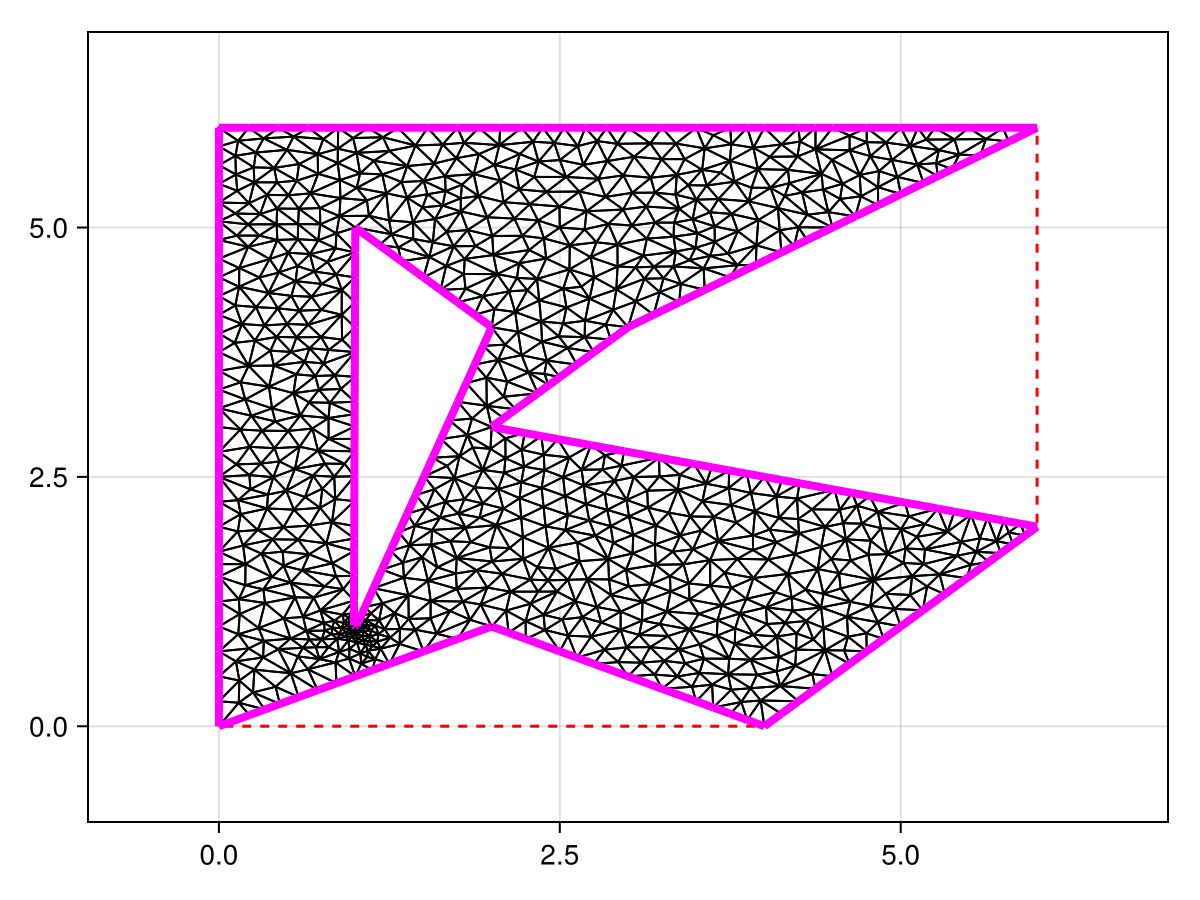
Attributes
bounding_box
Defaults to automatic
Sets the bounding box for truncating ghost edges which can be a Rect2 (or BBox) or a tuple of the form (xmin, xmax, ymin, ymax). By default, the rectangle will be given by [a - eΔx, b + eΔx] × [c - eΔy, d + eΔy] where e is the ghost_edge_extension_factor, Δx = b - a and Δy = d - c are the lengths of the sides of the rectangle, and [a, b] × [c, d] is the bounding box of the points in the triangulation.
constrained_edge_color
Defaults to :magenta
Sets the color of the constrained edges.
constrained_edge_linestyle
Defaults to @inherit linestyle
Sets the linestyle of the constrained edges.
constrained_edge_linewidth
Defaults to @inherit linewidth
Sets the width of the constrained edges.
convex_hull_color
Defaults to :red
Sets the color of the convex hull.
convex_hull_linestyle
Defaults to :dash
Sets the linestyle of the convex hull.
convex_hull_linewidth
Defaults to @inherit linewidth
Sets the width of the convex hull.
ghost_edge_color
Defaults to :blue
Sets the color of the ghost edges.
ghost_edge_extension_factor
Defaults to 0.1
Sets the extension factor for the rectangle that the exterior ghost edges are extended onto.
ghost_edge_linestyle
Defaults to @inherit linestyle
Sets the linestyle of the ghost edges.
ghost_edge_linewidth
Defaults to @inherit linewidth
Sets the width of the ghost edges.
joinstyle
Defaults to @inherit joinstyle
Controls the rendering at line corners. Options are :miter for sharp corners, :bevel for cut-off corners, and :round for rounded corners. If the corner angle is below miter_limit, :miter is equivalent to :bevel to avoid long spikes.
linecap
Defaults to @inherit linecap
Sets the type of line cap used for triangle edges. Options are :butt (flat without extrusion), :square (flat with half a linewidth extrusion) or :round.
linestyle
Defaults to :solid
Sets the linestyle of triangle edges.
marker
Defaults to @inherit marker
Sets the shape of the points.
markercolor
Defaults to @inherit markercolor
Sets the color of the points.
markersize
Defaults to @inherit markersize
Sets the size of the points.
miter_limit
Defaults to @inherit miter_limit
" Sets the minimum inner line join angle below which miter joins truncate. See also Makie.miter_distance_to_angle.
recompute_centers
Defaults to false
Determines whether to recompute the representative points for the ghost edge orientation. Note that this will mutate tri.representative_point_list directly.
show_constrained_edges
Defaults to false
Determines whether to plot the constrained edges.
show_convex_hull
Defaults to false
Determines whether to plot the convex hull.
show_ghost_edges
Defaults to false
Determines whether to plot the ghost edges.
show_points
Defaults to false
Determines whether to plot the individual points. Note that this will only plot points included in the triangulation.
strokecolor
Defaults to @inherit patchstrokecolor
Sets the color of triangle edges.
strokewidth
Defaults to 1
Sets the linewidth of triangle edges.
triangle_color
Defaults to :transparent
Sets the color of the triangles.