density
Makie.density Function
density(values)Plot a kernel density estimate of values.
Plot type
The plot type alias for the density function is Density.
Examples
using CairoMakie
f = Figure()
Axis(f[1, 1])

density!(randn(200))
density!(randn(200) .+ 2, alpha = 0.8)

f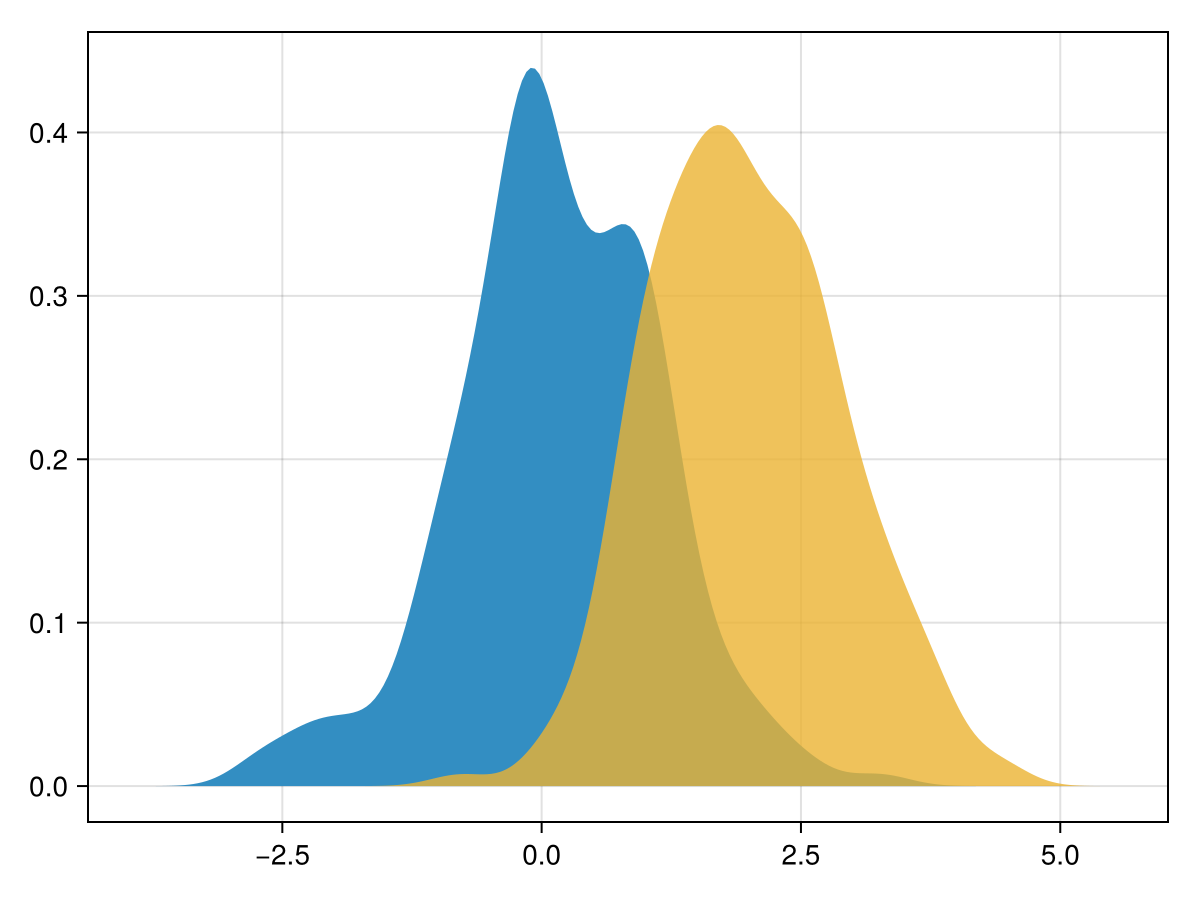
using CairoMakie
f = Figure()
Axis(f[1, 1])

density!(randn(200), direction = :y, npoints = 10)

f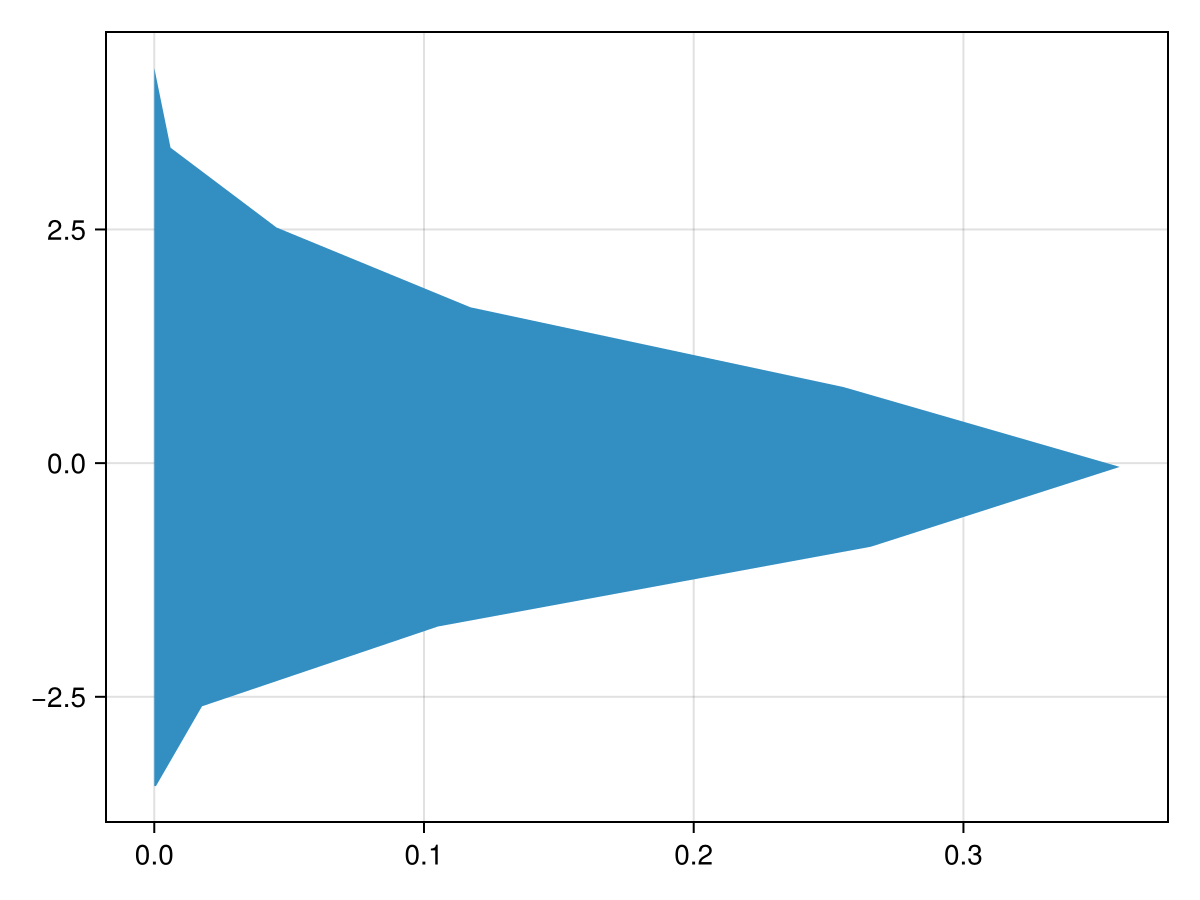
using CairoMakie
f = Figure()
Axis(f[1, 1])

density!(randn(200), color = (:red, 0.3),
    strokecolor = :red, strokewidth = 3, strokearound = true)

f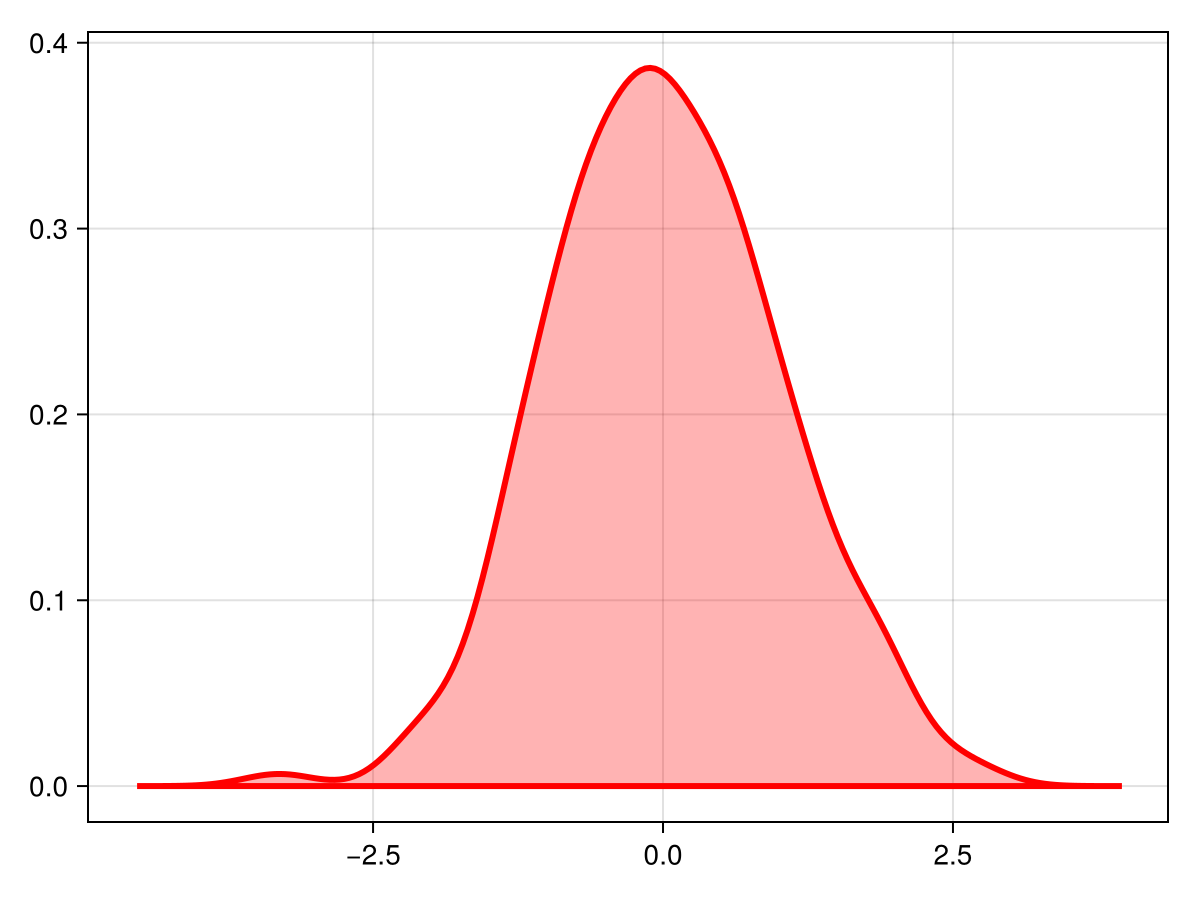
using CairoMakie
f = Figure()
Axis(f[1, 1])

vectors = [randn(1000) .+ i/2 for i in 0:5]

for (i, vector) in enumerate(vectors)
    density!(vector, offset = -i/4, color = (:slategray, 0.4),
        bandwidth = 0.1)
end

f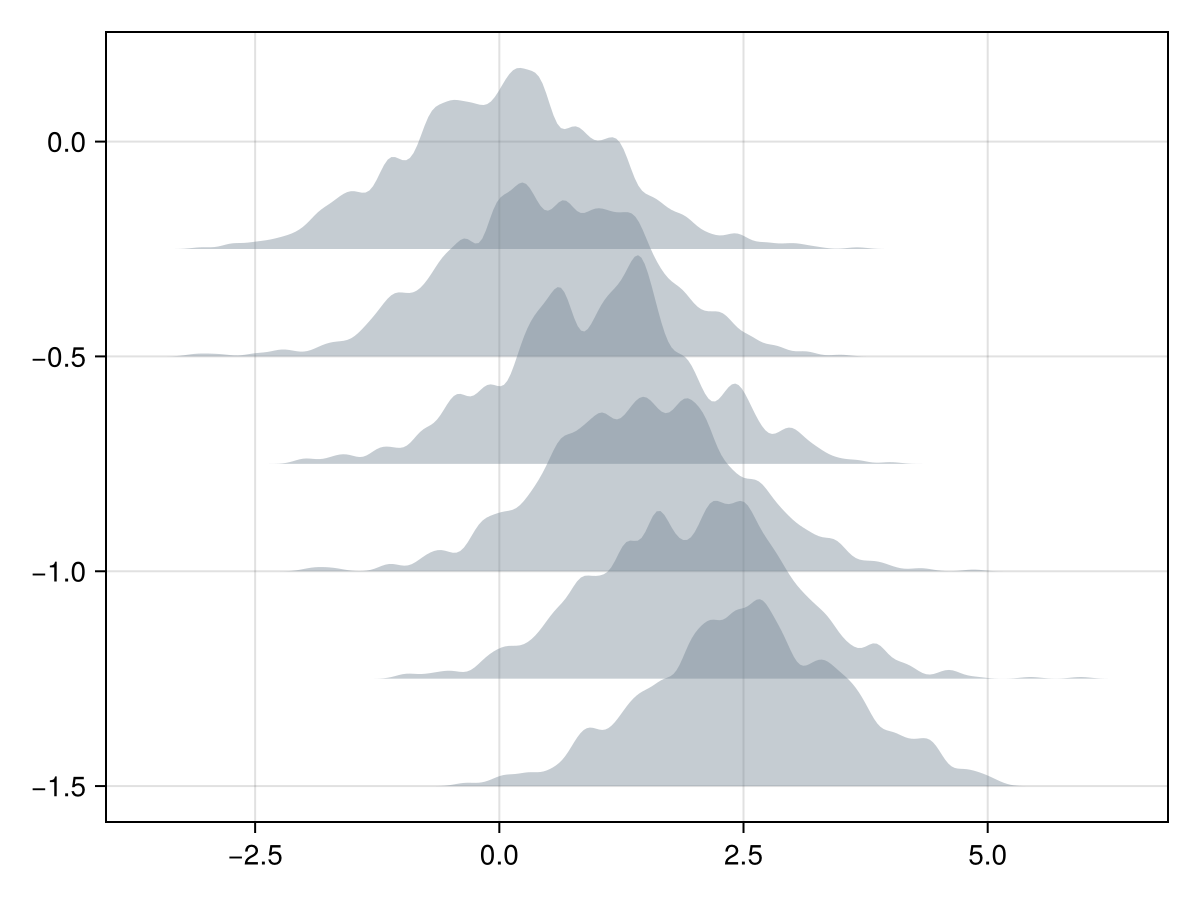
Gradients
You can color density plots with gradients by choosing color = :x or :y, depending on the direction attribute.
using CairoMakie
months = ["January", "February", "March", "April",
    "May", "June", "July", "August", "September",
    "October", "November", "December"]

f = Figure()
Axis(f[1, 1], title = "Fictive temperatures",
    yticks = ((1:12) ./ 4,  reverse(months)))

for i in 12:-1:1
    d = density!(randn(200) .- 2sin((i+3)/6*pi), offset = i / 4,
        color = :x, colormap = :thermal, colorrange = (-5, 5),
        strokewidth = 1, strokecolor = :black)
    # this helps with layering in GLMakie
    translate!(d, 0, 0, -0.1i)
end
f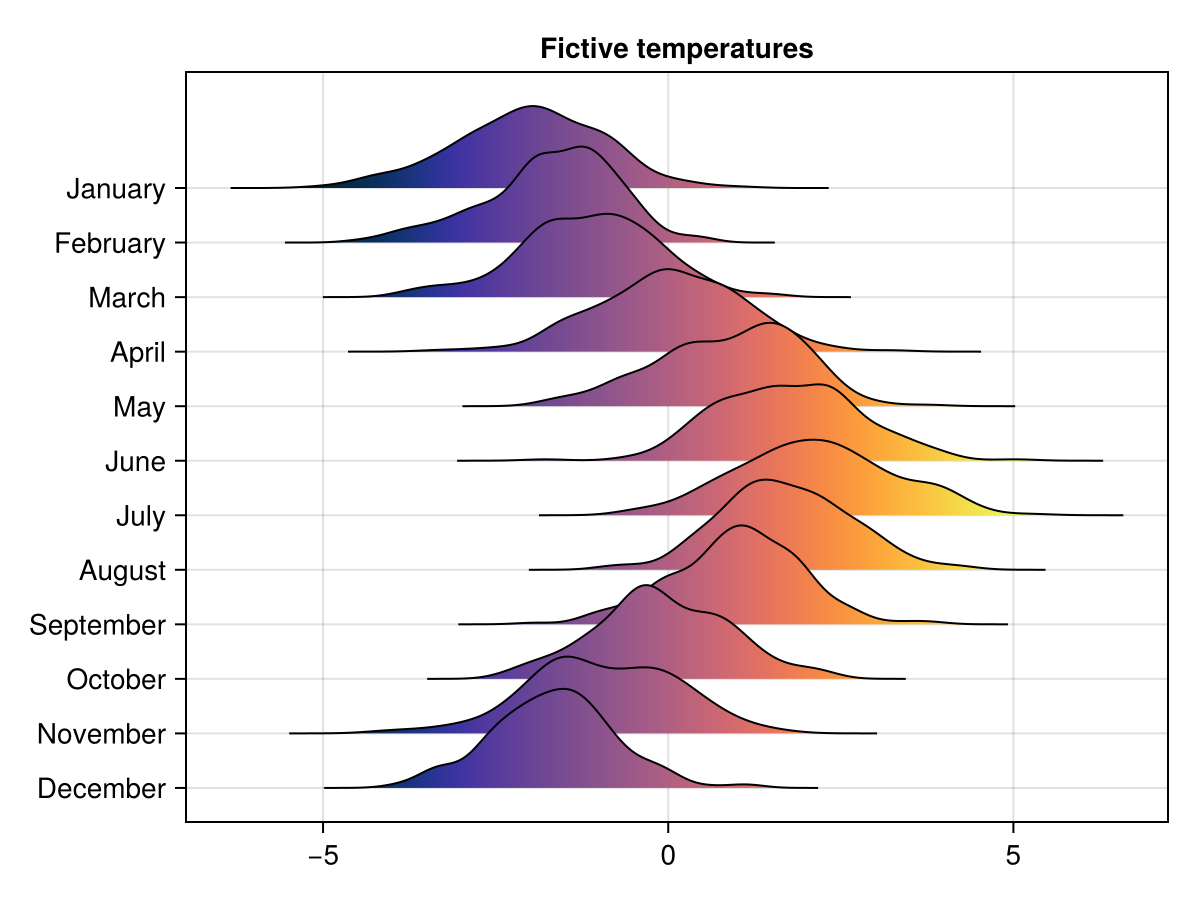
Due to technical limitations, if you color the :vertical dimension (or :horizontal with direction = :y), only a colormap made with just two colors can currently work:
using CairoMakie
f = Figure()
Axis(f[1, 1])
for x in 1:5
    d = density!(x * randn(200) .+ 3x,
        color = :y, colormap = [:darkblue, :gray95])
end
f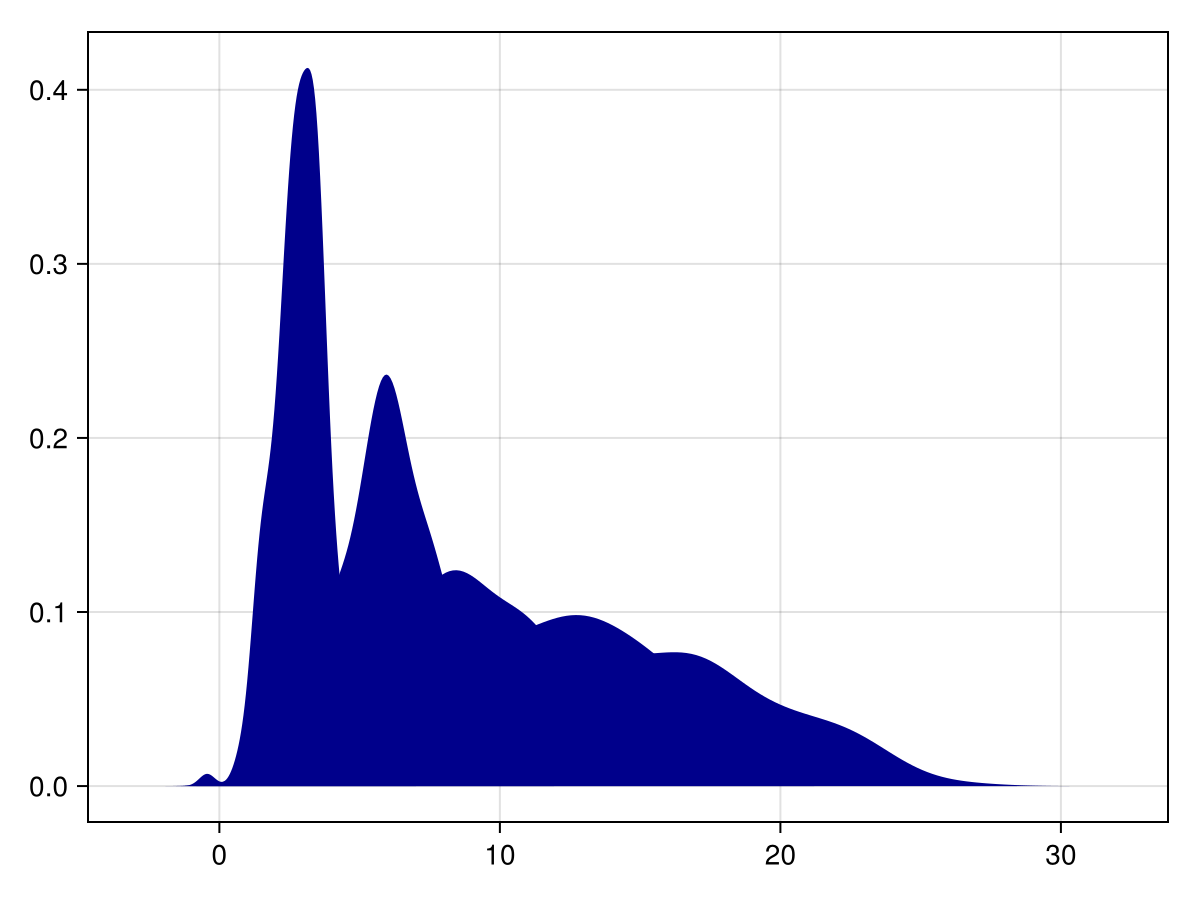
Using statistical weights
using CairoMakie
using Distributions


N = 100_000
x = rand(Uniform(-2, 2), N)

w = pdf.(Normal(), x)

fig = Figure()
density(fig[1,1], x)
density(fig[1,2], x, weights = w)

fig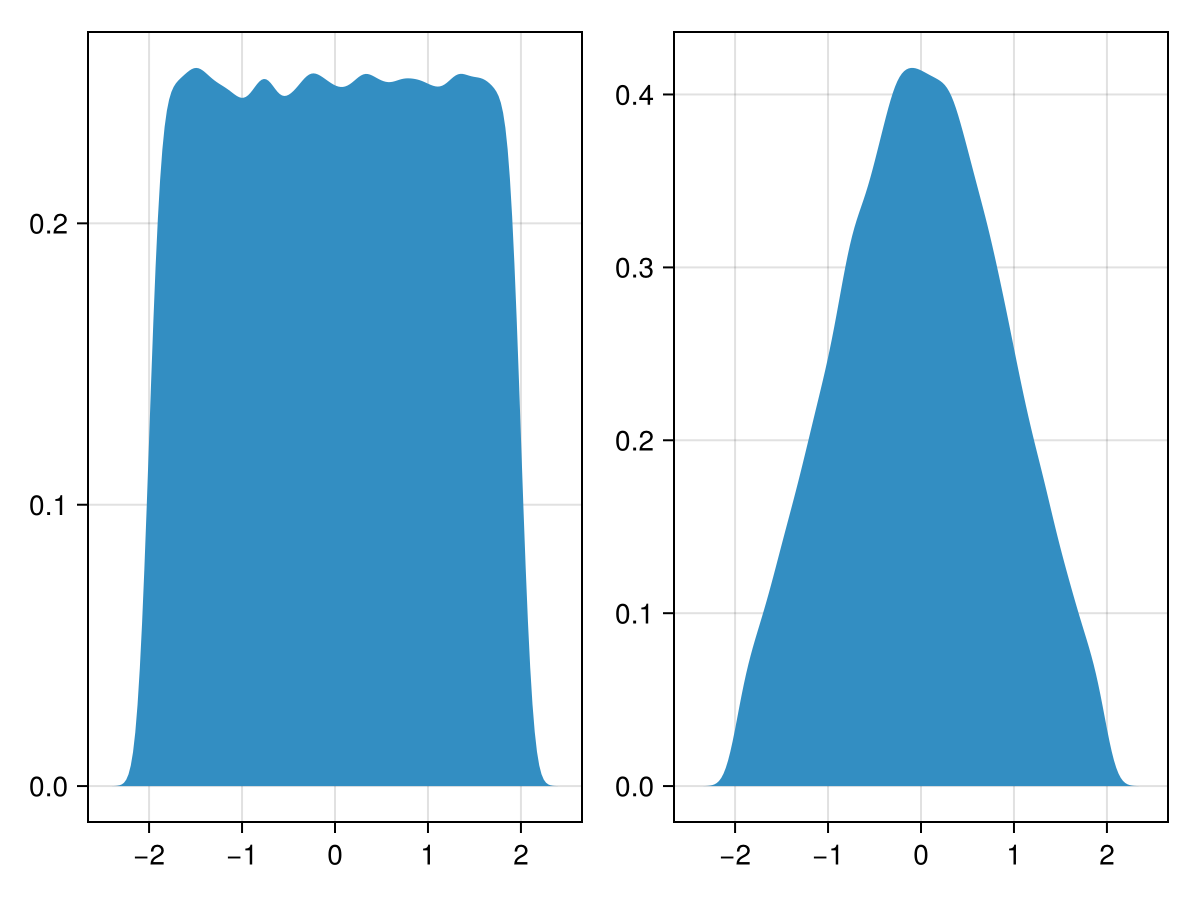
Attributes
alpha
Defaults to 1.0
The alpha value of the colormap or color attribute. Multiple alphas like in plot(alpha=0.2, color=(:red, 0.5)), will get multiplied.
bandwidth
Defaults to automatic
Kernel density bandwidth, determined automatically if automatic.
boundary
Defaults to automatic
Boundary of the density estimation, determined automatically if automatic.
clip_planes
Defaults to @inherit clip_planes automatic
Clip planes offer a way to do clipping in 3D space. You can set a Vector of up to 8 Plane3f planes here, behind which plots will be clipped (i.e. become invisible). By default clip planes are inherited from the parent plot or scene. You can remove parent clip_planes by passing Plane3f[].
color
Defaults to @inherit patchcolor
Sets the color of the density plot. This is usually a single color, but can also be :x or :y to color with a gradient.
colormap
Defaults to @inherit colormap :viridis
Sets the colormap that is sampled for numeric colors. PlotUtils.cgrad(...), Makie.Reverse(any_colormap) can be used as well, or any symbol from ColorBrewer or PlotUtils. To see all available color gradients, you can call Makie.available_gradients().
colorrange
Defaults to automatic
The values representing the start and end points of colormap.
colorscale
Defaults to identity
The color transform function. Can be any function, but only works well together with Colorbar for identity, log, log2, log10, sqrt, logit, Makie.pseudolog10, Makie.Symlog10, Makie.AsinhScale, Makie.SinhScale, Makie.LogScale, Makie.LuptonAsinhScale, and Makie.PowerScale.
cycle
Defaults to [:color => :patchcolor]
Sets which attributes to cycle when creating multiple plots. The values to cycle through are defined by the parent Theme. Multiple cycled attributes can be set by passing a vector. Elements can
directly refer to a cycled attribute, e.g.
:colormap a cycled attribute to a palette attribute, e.g.
:linecolor => :colormap multiple cycled attributes to a palette attribute, e.g.
[:linecolor, :markercolor] => :color
depth_shift
Defaults to 0.0
Adjusts the depth value of a plot after all other transformations, i.e. in clip space, where -1 <= depth <= 1. This only applies to GLMakie and WGLMakie and can be used to adjust render order (like a tunable overdraw).
direction
Defaults to :x
The dimension along which the values are distributed. Can be :x or :y.
fxaa
Defaults to true
Adjusts whether the plot is rendered with fxaa (fast approximate anti-aliasing, GLMakie only). Note that some plots implement a better native anti-aliasing solution (scatter, text, lines). For them fxaa = true generally lowers quality. Plots that show smoothly interpolated data (e.g. image, surface) may also degrade in quality as fxaa = true can cause blurring.
highclip
Defaults to automatic
The color for any value above the colorrange.
inspectable
Defaults to @inherit inspectable
Sets whether this plot should be seen by DataInspector. The default depends on the theme of the parent scene.
inspector_clear
Defaults to automatic
Sets a callback function (inspector, plot) -> ... for cleaning up custom indicators in DataInspector.
inspector_hover
Defaults to automatic
Sets a callback function (inspector, plot, index) -> ... which replaces the default show_data methods.
inspector_label
Defaults to automatic
Sets a callback function (plot, index, position) -> string which replaces the default label generated by DataInspector.
linestyle
Defaults to nothing
Sets the line pattern of the density outline.
lowclip
Defaults to automatic
The color for any value below the colorrange.
model
Defaults to automatic
Sets a model matrix for the plot. This overrides adjustments made with translate!, rotate! and scale!.
nan_color
Defaults to :transparent
The color for NaN values.
npoints
Defaults to 200
The resolution of the estimated curve along the dimension set in direction.
offset
Defaults to 0.0
Shift the density baseline, for layering multiple densities on top of each other.
overdraw
Defaults to false
Controls if the plot will draw over other plots. This specifically means ignoring depth checks in GL backends
space
Defaults to :data
Sets the transformation space for box encompassing the plot. See Makie.spaces() for possible inputs.
ssao
Defaults to false
Adjusts whether the plot is rendered with ssao (screen space ambient occlusion). Note that this only makes sense in 3D plots and is only applicable with fxaa = true.
strokearound
Defaults to false
Controls whether the outline only draws around the complete density (true) or just the maximum values (false).
strokecolor
Defaults to @inherit patchstrokecolor
Sets the color of the density outline. This requires strokewidth > 0.
strokewidth
Defaults to @inherit patchstrokewidth
Sets the linewidth of the density outline.
transformation
Defaults to :automatic
Controls the inheritance or directly sets the transformations of a plot. Transformations include the transform function and model matrix as generated by translate!(...), scale!(...) and rotate!(...). They can be set directly by passing a Transformation() object or inherited from the parent plot or scene. Inheritance options include:
:automatic: Inherit transformations if the parent and childspaceis compatible:inherit: Inherit transformations:inherit_model: Inherit only model transformations:inherit_transform_func: Inherit only the transform function:nothing: Inherit neither, fully disconnecting the child's transformations from the parent
Another option is to pass arguments to the transform!() function which then get applied to the plot. For example transformation = (:xz, 1.0) which rotates the xy plane to the xz plane and translates by 1.0. For this inheritance defaults to :automatic but can also be set through e.g. (:nothing, (:xz, 1.0)).
transparency
Defaults to false
Adjusts how the plot deals with transparency. In GLMakie transparency = true results in using Order Independent Transparency.
visible
Defaults to true
Controls whether the plot gets rendered or not.
weights
Defaults to automatic
Assign a vector of statistical weights to values.