
PolarAxis
The PolarAxis is an axis for data given in polar coordinates, i.e a radius and an angle. It is currently an experimental feature, meaning that some functionality might be missing or broken, and that the PolarAxis is (more) open to breaking changes.
Creating a PolarAxis
Creating a PolarAxis works the same way as creating an Axis.
using CairoMakie

f = Figure()

ax = PolarAxis(f[1, 1], title = "Title")

f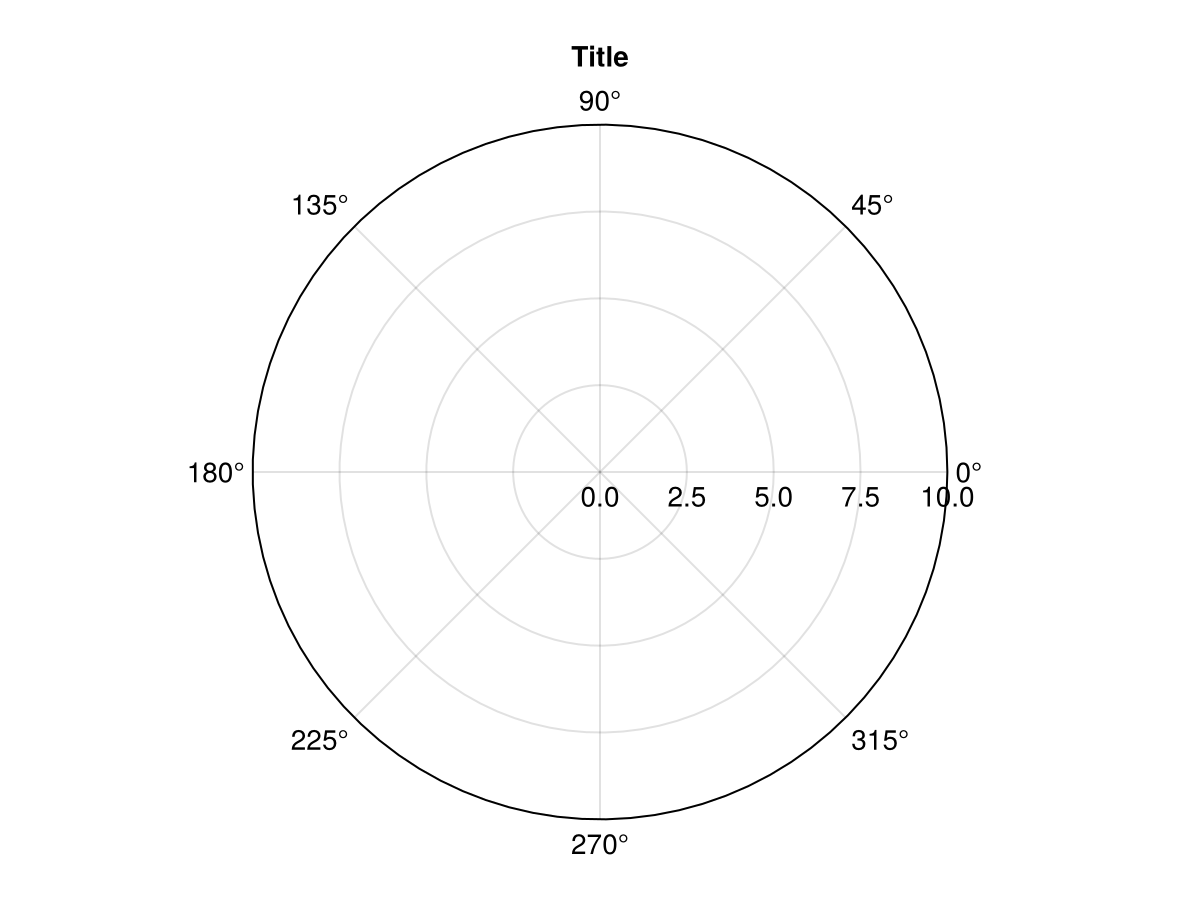
Plotting into an PolarAxis
Like with an Axis you can use mutating 2D plot functions directly on a PolarAxis. The input arguments of the plot functions will then be interpreted in polar coordinates, i.e. as an angle (in radians) and a radius. The order of a arguments can be changed with ax.theta_as_x.
using CairoMakie
f = Figure(size = (800, 400))

ax = PolarAxis(f[1, 1], title = "Theta as x")
lineobject = lines!(ax, 0..2pi, sin, color = :red)

ax = PolarAxis(f[1, 2], title = "R as x", theta_as_x = false)
scatobject = scatter!(range(0, 10, length=100), cos, color = :orange)

f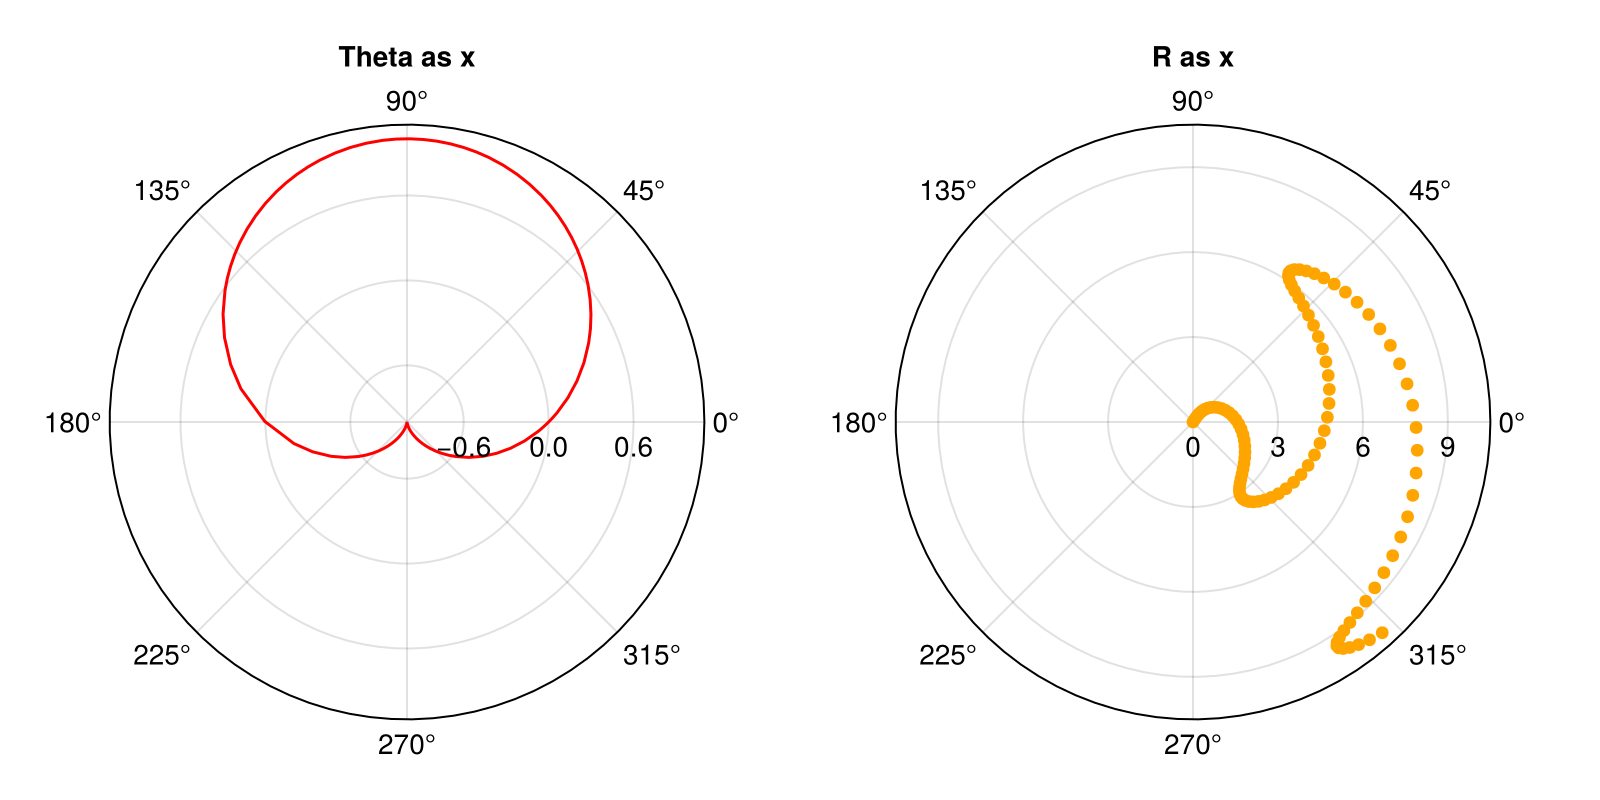
PolarAxis Limits
By default the PolarAxis will assume po.rlimits = (0.0, nothing) and po.thetalimits = (0.0, 2pi), showing a full circle. You can adjust these limits to show different cut-outs of the PolarAxis. For example, we can limit thetalimits to a smaller range to generate a circle sector and further limit rmin through rlimits to cut out the center to an arc.
using CairoMakie
f = Figure(size = (600, 600))

ax = PolarAxis(f[1, 1], title = "Default")
lines!(ax, range(0, 8pi, length=300), range(0, 10, length=300))
ax = PolarAxis(f[1, 2], title = "thetalimits", thetalimits = (-pi/6, pi/6))
lines!(ax, range(0, 8pi, length=300), range(0, 10, length=300))

ax = PolarAxis(f[2, 1], title = "rlimits", rlimits = (5, 10))
lines!(ax, range(0, 8pi, length=300), range(0, 10, length=300))
ax = PolarAxis(f[2, 2], title = "both")
lines!(ax, range(0, 8pi, length=300), range(0, 10, length=300))
thetalims!(ax, -pi/6, pi/6)
rlims!(ax, 5, 10)

f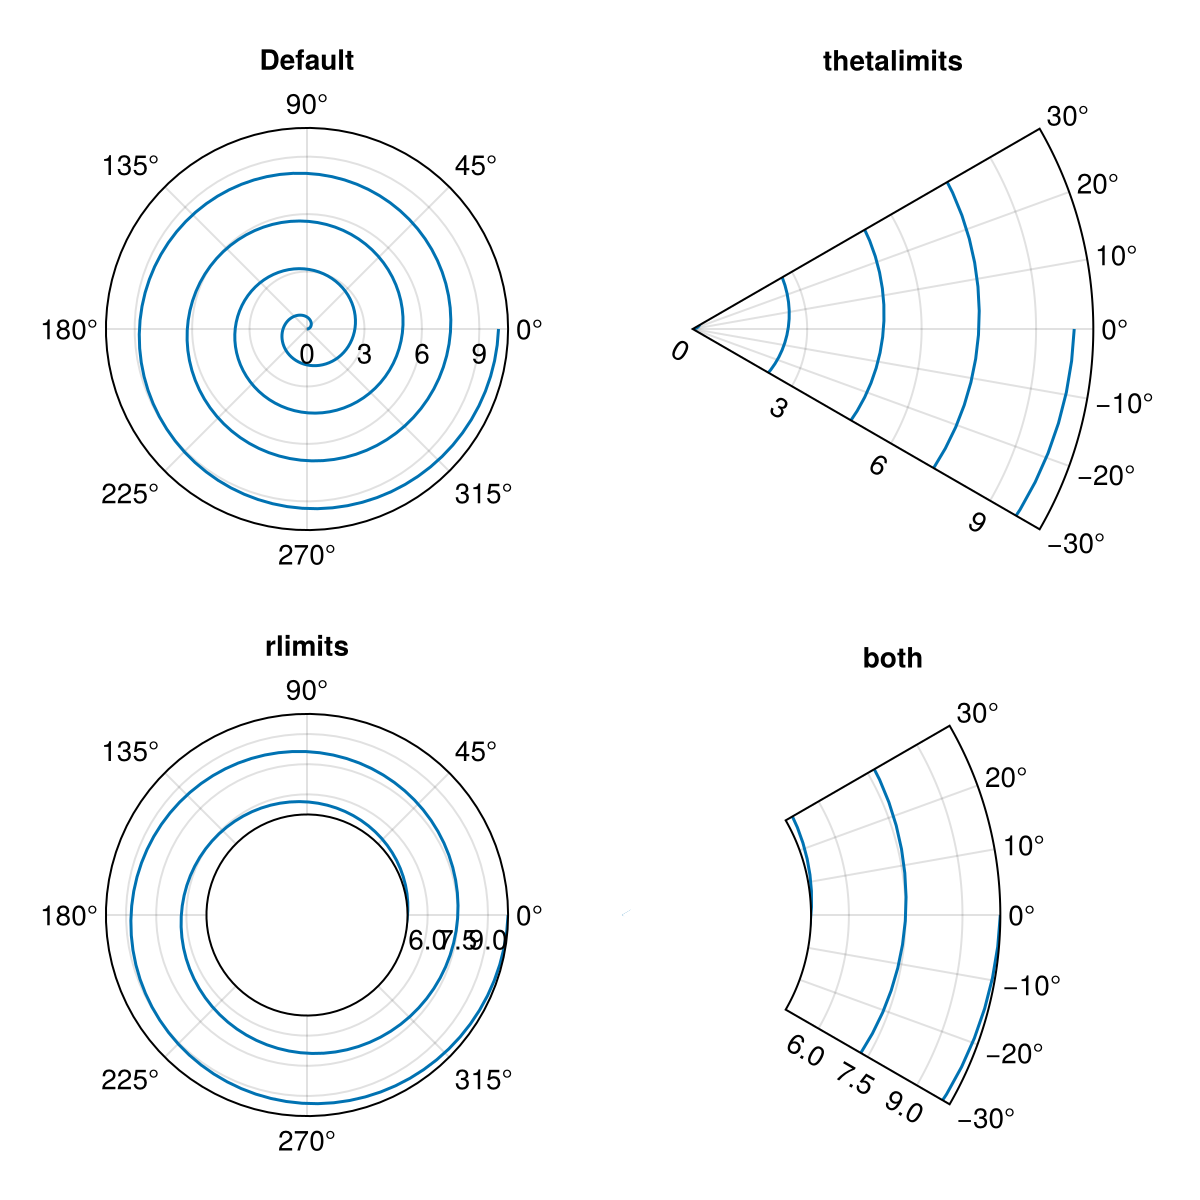
You can make further adjustments to the orientation of the PolarAxis by adjusting ax.theta_0 and ax.direction. These adjust how angles are interpreted by the polar transform following the formula output_angle = direction * (input_angle + theta_0).
using CairoMakie
f = Figure()

ax = PolarAxis(f[1, 1], title = "Reoriented Axis", theta_0 = -pi/2, direction = -1)
lines!(ax, range(0, 8pi, length=300), range(0, 10, length=300))
thetalims!(ax, -pi/6, pi/6)
rlims!(ax, 5, 10)

f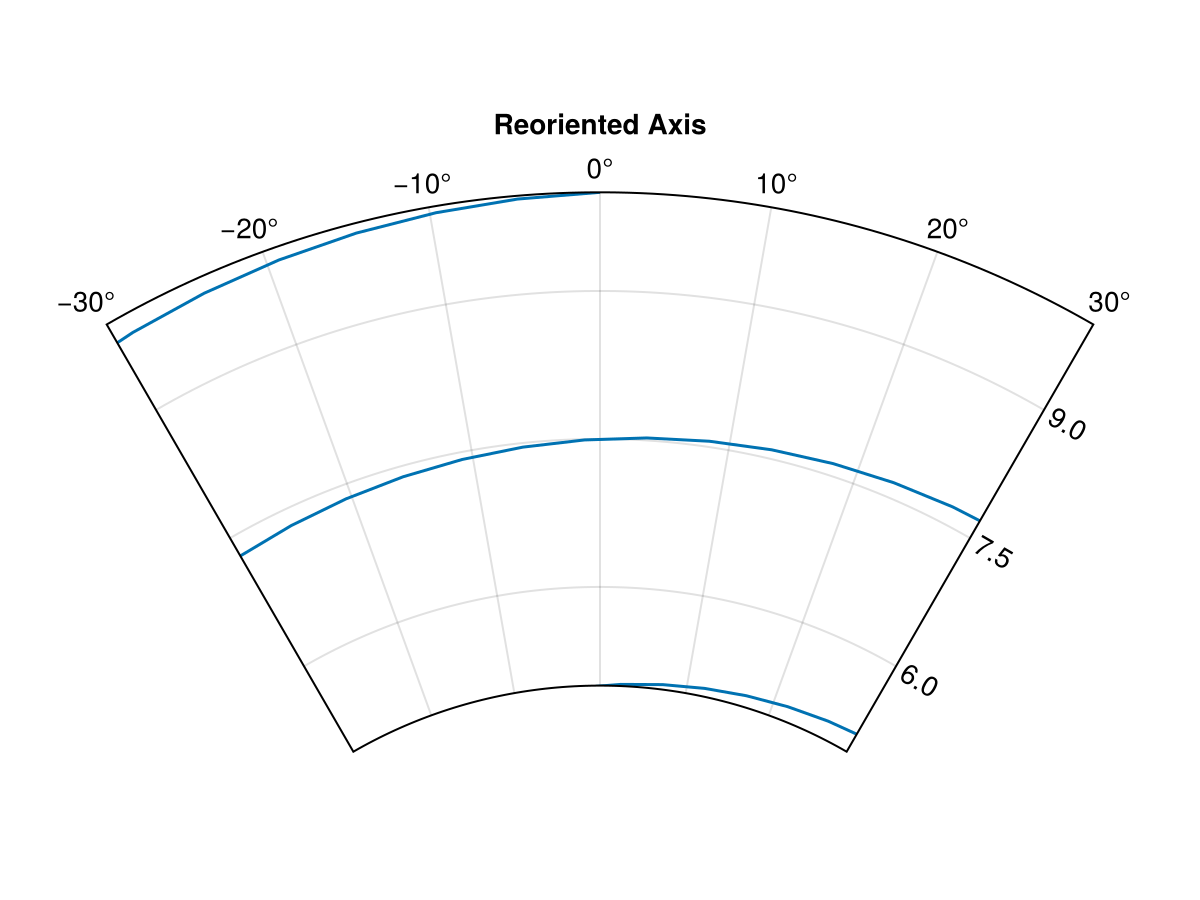
Note that by default translations in adjustments of rmin and thetalimits are blocked. These can be unblocked by calling autolimits!(ax[, true]) which also tells the PolarAxis to derive r- and thetalimits freely from data, or by setting ax.fixrmin = false and ax.thetazoomlock = false.
Plot type compatibility
Not every plot type is compatible with the polar transform. For example image is not as it expects to be drawn on a rectangle. heatmap works to a degree in CairoMakie, but not GLMakie due to differences in the backend implementation. surface can be used as a replacement for image as it generates a triangle mesh. To avoid having the surface plot extend in z-direction and thus messing with render order it is recommended to pass the color-data through the color attribute and use a matrix of zeros for the z-data. As a replacement for heatmap you can use voronoiplot, which generates cells of arbitrary shape around points given to it. Here you will generally need to set rlims!(ax, rmax) yourself.
using CairoMakie
f = Figure(size = (800, 500))

ax = PolarAxis(f[1, 1], title = "Surface")
rs = 0:10
phis = range(0, 2pi, 37)
cs = [r+cos(4phi) for phi in phis, r in rs]
p = surface!(ax, 0..2pi, 0..10, zeros(size(cs)), color = cs, shading = NoShading, colormap = :coolwarm)
ax.gridz = 100
tightlimits!(ax) # surface plots include padding by default
Colorbar(f[2, 1], p, vertical = false, flipaxis = false)

ax = PolarAxis(f[1, 2], title = "Voronoi")
rs = 1:10
phis = range(0, 2pi, 37)[1:36]
cs = [r+cos(4phi) for phi in phis, r in rs]
p = voronoiplot!(ax, phis, rs, cs, show_generators = false, strokewidth = 0)
rlims!(ax, 0.0, 10.5)
Colorbar(f[2, 2], p, vertical = false, flipaxis = false)

f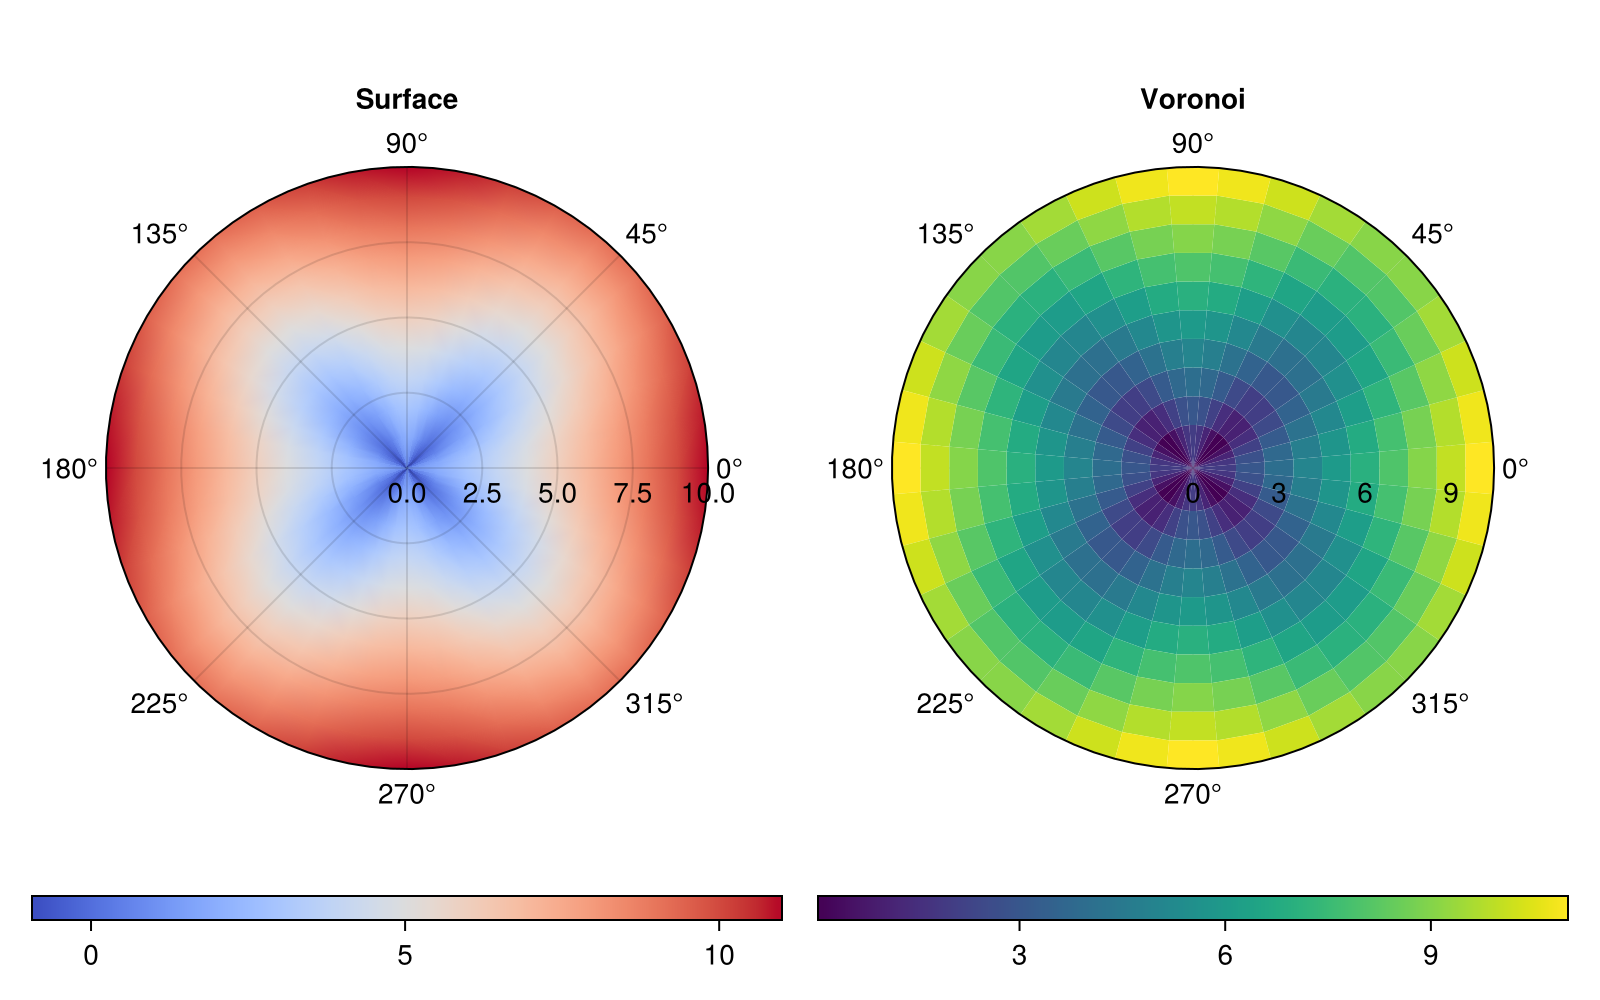
Note that in order to see the grid we need to adjust its depth with ax.gridz = 100 (higher z means lower depth). The hard limits for ax.gridz are (-10_000, 10_000) with 9000 being a soft limit where axis components may order incorrectly.
Hiding spines and decorations
For a PolarAxis we interpret the outer ring limiting the plotting area as the axis spine. You can manipulate it with the spine... attributes.
using CairoMakie
f = Figure(size = (800, 400))
ax1 = PolarAxis(f[1, 1], title = "No spine", spinevisible = false)
scatterlines!(ax1, range(0, 1, length=100), range(0, 10pi, length=100), color = 1:100)

ax2 = PolarAxis(f[1, 2], title = "Modified spine")
ax2.spinecolor = :red
ax2.spinestyle = :dash
ax2.spinewidth = 5
scatterlines!(ax2, range(0, 1, length=100), range(0, 10pi, length=100), color = 1:100)

f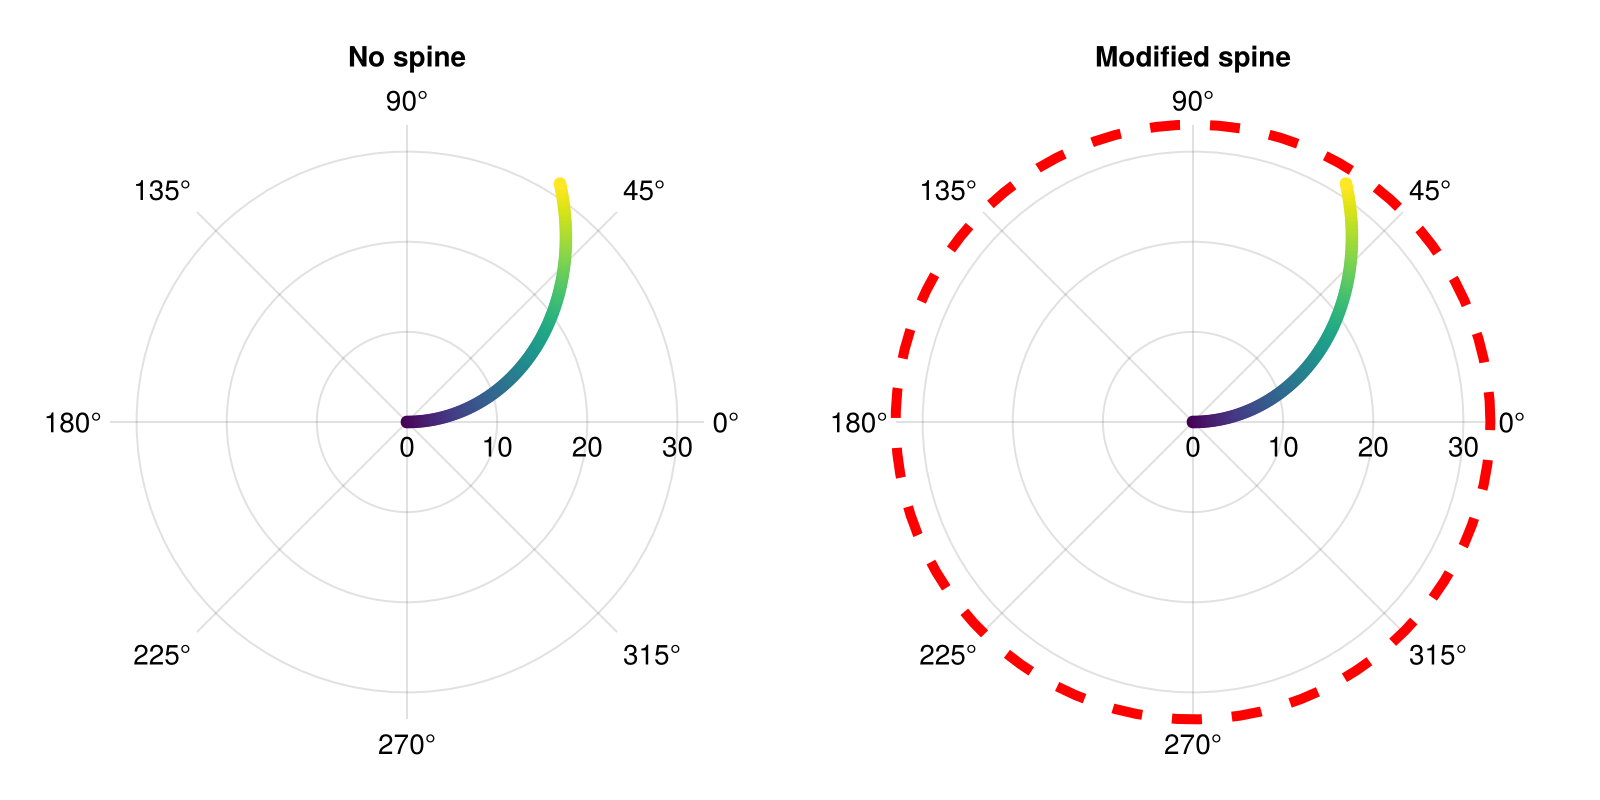
Decorations such as grid lines and tick labels can be adjusted through attributes in much the same way.
using CairoMakie
f = Figure(size = (600, 600), backgroundcolor = :black)
ax = PolarAxis(
    f[1, 1],
    backgroundcolor = :black,
    # r minor grid
    rminorgridvisible = true, rminorgridcolor = :red,
    rminorgridwidth = 1.0, rminorgridstyle = :dash,
    # theta minor grid
    thetaminorgridvisible = true, thetaminorgridcolor = :lightblue,
    thetaminorgridwidth = 1.0, thetaminorgridstyle = :dash,
    # major grid
    rgridwidth = 2, rgridcolor = :red,
    thetagridwidth = 2, thetagridcolor = :lightblue,
    # r labels
    rticklabelsize = 18, rticklabelcolor = :red,
    rticklabelstrokewidth = 1.0, rticklabelstrokecolor = :white,
    # theta labels
    thetaticklabelsize = 18, thetaticklabelcolor = :lightblue
)

f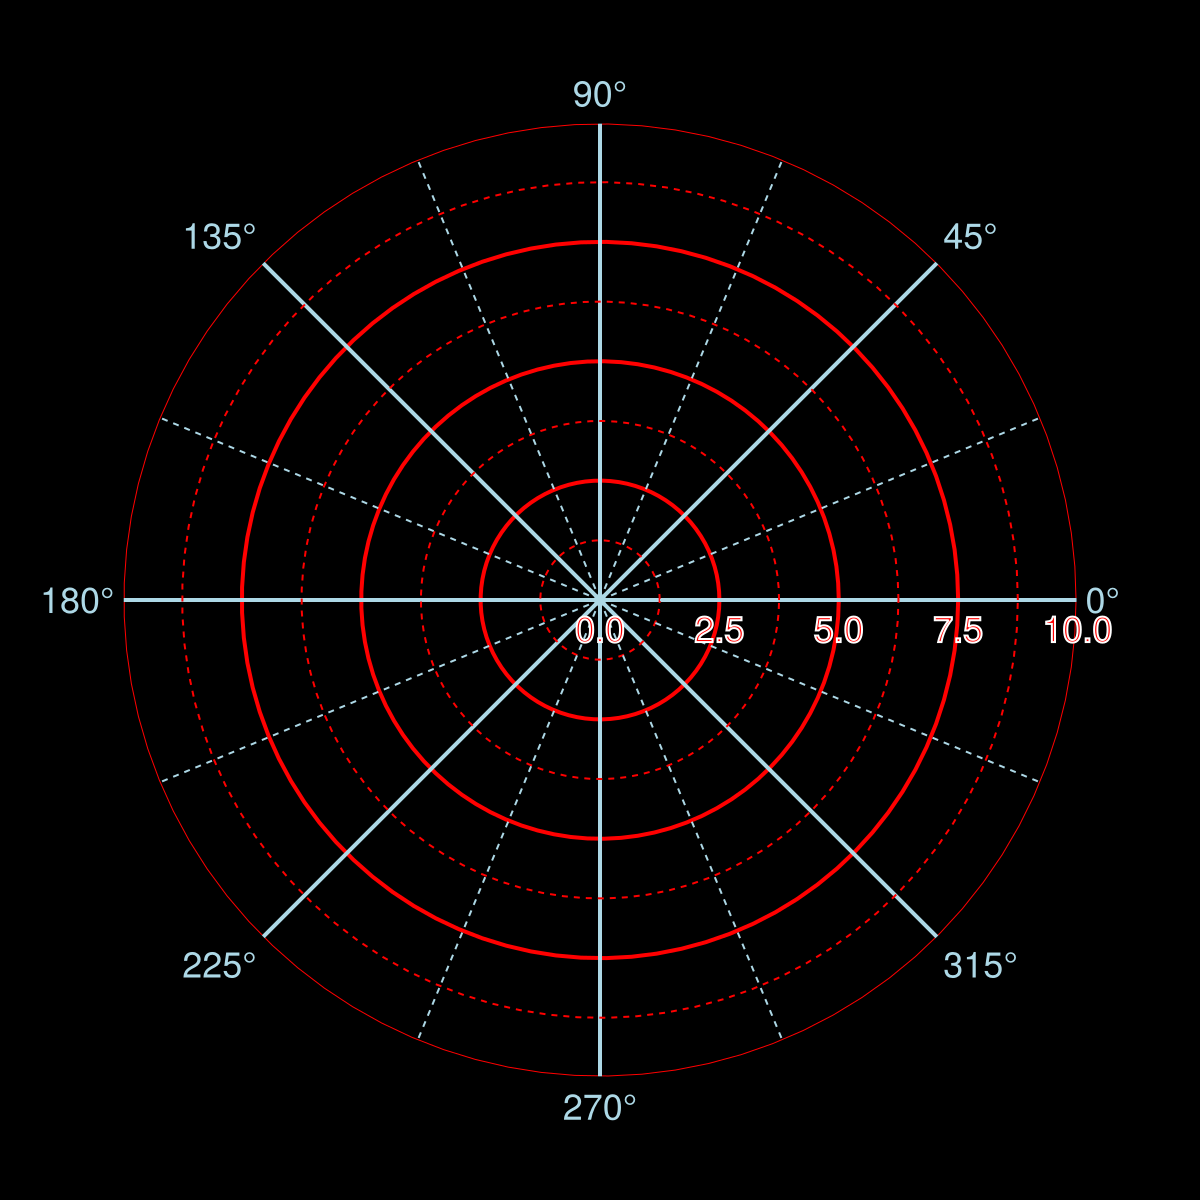
We can also hide the spine after creation with hidespines!(ax). And, hide the ticklabels, grid, and/or minorgrid with hidedecorations!, hiderdecorations, and hidethetadecorations!.
using CairoMakie
fig = Figure()
fullaxis(figpos, title) = PolarAxis(figpos;
                                    title,
                                    thetaminorgridvisible=true,
                                    rminorgridvisible=true,
                                    rticklabelrotation=deg2rad(-90),
                                    rticklabelsize=12,
                                    )
ax1 = fullaxis(fig[1, 1][1, 1], "all decorations")
ax2 = fullaxis(fig[1, 1][1, 2], "hide spine")
hidespines!(ax2)
ax3 = fullaxis(fig[2, 1][1, 1], "hide r decorations")
hiderdecorations!(ax3)
ax4 = fullaxis(fig[2, 1][1, 2], "hide theta decorations")
hidethetadecorations!(ax4)
ax5 = fullaxis(fig[2, 1][1, 3], "hide all decorations")
hidedecorations!(ax5)
fig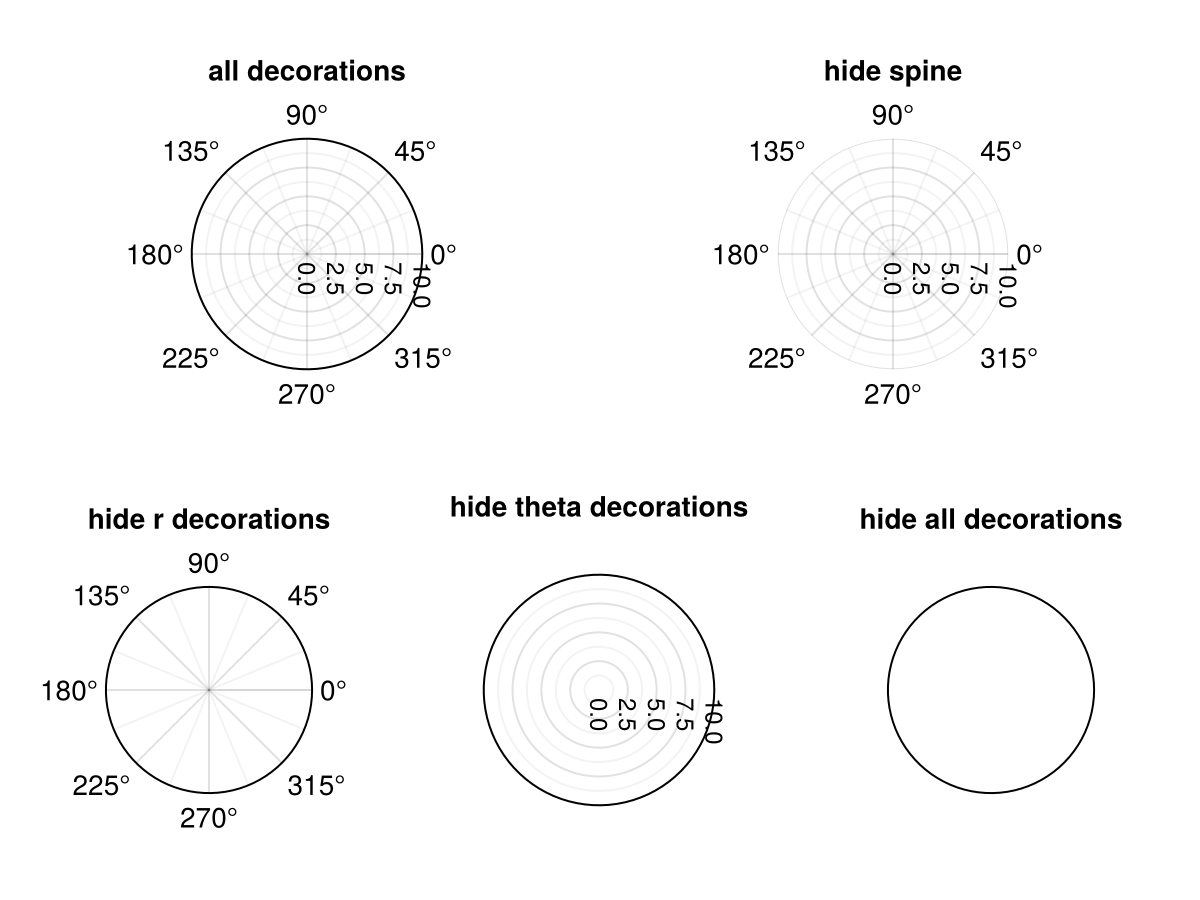
Ticks and Minorticks
Ticks and minor ticks are hidden by default. They are made visible with the tickvisible attributes.
using CairoMakie
f = Figure()
a = PolarAxis(f[1,1],
    rticksvisible = true, thetaticksvisible = true,
    rminorticksvisible = true,
    thetaminorticksvisible = true,
)
f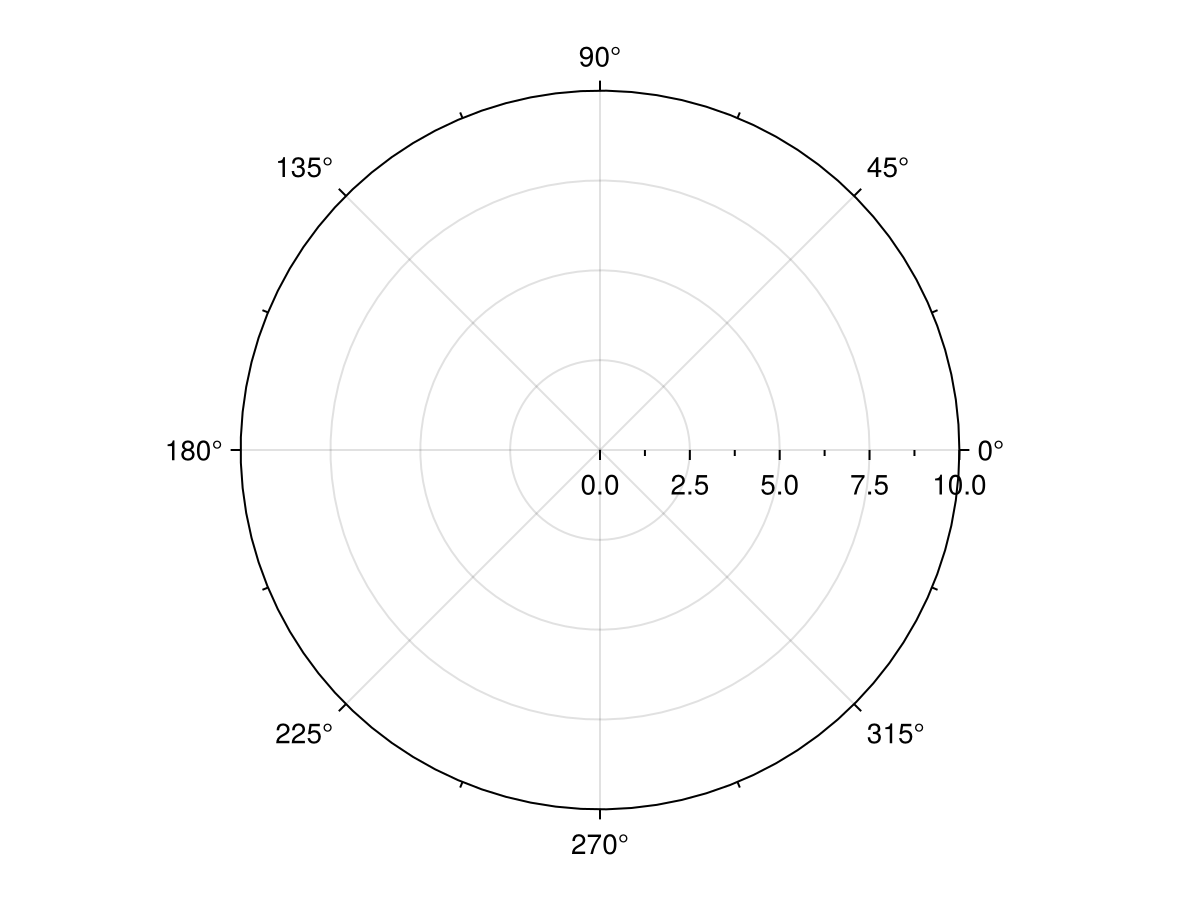
They can be styled with various other tick attributes. They can also be mirrored to the other side of a sector-style PolarAxis with ticksmirrored.
using CairoMakie
f = Figure(size = (800, 400))
kwargs = (
    rticksvisible = true, rticksize = 12, rtickwidth = 4, rtickcolor = :red, rtickalign = 0.5,
    thetaticksvisible = true, thetaticksize = 12, thetatickwidth = 4, thetatickcolor = :blue, thetatickalign = 0.5,
    rminorticksvisible = true, rminorticksize = 8, rminortickwidth = 3, rminortickcolor = :orange, rminortickalign = 1.0,
    thetaminorticksvisible = true, thetaminorticksize = 8, thetaminortickwidth = 3, thetaminortickcolor = :cyan, thetaminortickalign = 1.0,
)
a = PolarAxis(f[1,1], title = "normal", rticksmirrored = false, thetaticksmirrored = false; kwargs...)
rlims!(a, 0.5, 0.9)
thetalims!(a, 1pi/5, 2pi/5)
a = PolarAxis(f[1,2], title = "mirrored", rticksmirrored = true, thetaticksmirrored = true; kwargs...)
rlims!(a, 0.5, 0.9)
thetalims!(a, 1pi/5, 2pi/5)
f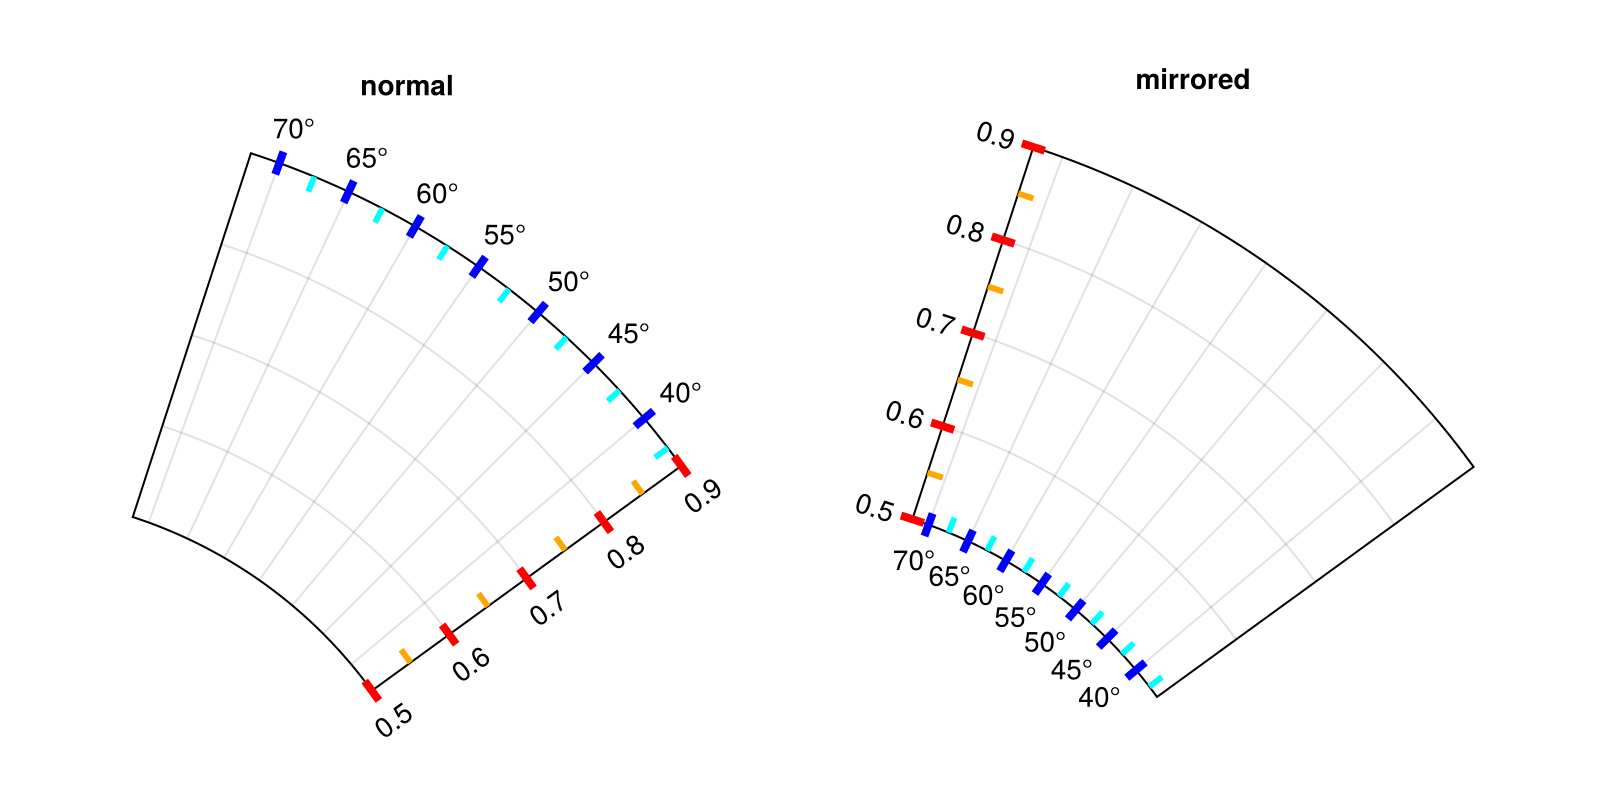
Interactivity
The PolarAxis currently implements zooming, translation and resetting. Zooming is implemented via scrolling, with ax.rzoomkey = Keyboard.r restricting zooming to the radial direction and ax.thetazoomkey = Keyboard.t restring to angular zooming. You can block zooming in the r-direction by setting ax.rzoomlock = true and ax.thetazoomlock = true for theta direction. Furthermore you can disable zooming from changing just rmin with ax.fixrmin = true and adjust its speed with ax.zoomspeed = 0.1.
Translations are implemented with mouse drag. By default radial translations use ax.r_translation_button = Mouse.right and angular translations also use ax.theta_translation_button = Mouse.right. If ax.fixrmin = true translation in the r direction are not allowed. If you want to disable one of these interaction you can set corresponding button to false.
There is also an interaction for rotating the whole axis using ax.axis_rotation_button = Keyboard.left_control & Mouse.right and resetting the axis view uses ax.reset_button = Keyboard.left_control & Mouse.left, matching Axis. You can adjust whether this resets the rotation of the axis with ax.reset_axis_orientation = false.
Note that PolarAxis currently does not implement the interaction interface used by Axis.
Other Notes
Plotting outside a PolarAxis
Currently there are two poly plots outside the area of the PolarAxis which clip the content to the relevant area. If you want to draw outside the clip limiting the polar axis but still within it's scene area, you need to translate those plots to a z range between 9000 and 10_000 or disable clipping via the clip attribute.
For reference, the z values used by PolarAxis are po.griddepth = 8999 for grid lines, 9000 for the clip polygons, 9001 for spines and 9002 for tick labels.
Radial Offset
If you have a plot with rlimits far away from 0 you will end up with a lot of empty space in the PolarAxis. Consider for example:
using CairoMakie
fig = Figure()
ax = PolarAxis(fig[1, 1], thetalimits = (0, pi))
lines!(ax, range(0, pi, length=100), 10 .+ sin.(0.3 .* (1:100)))
fig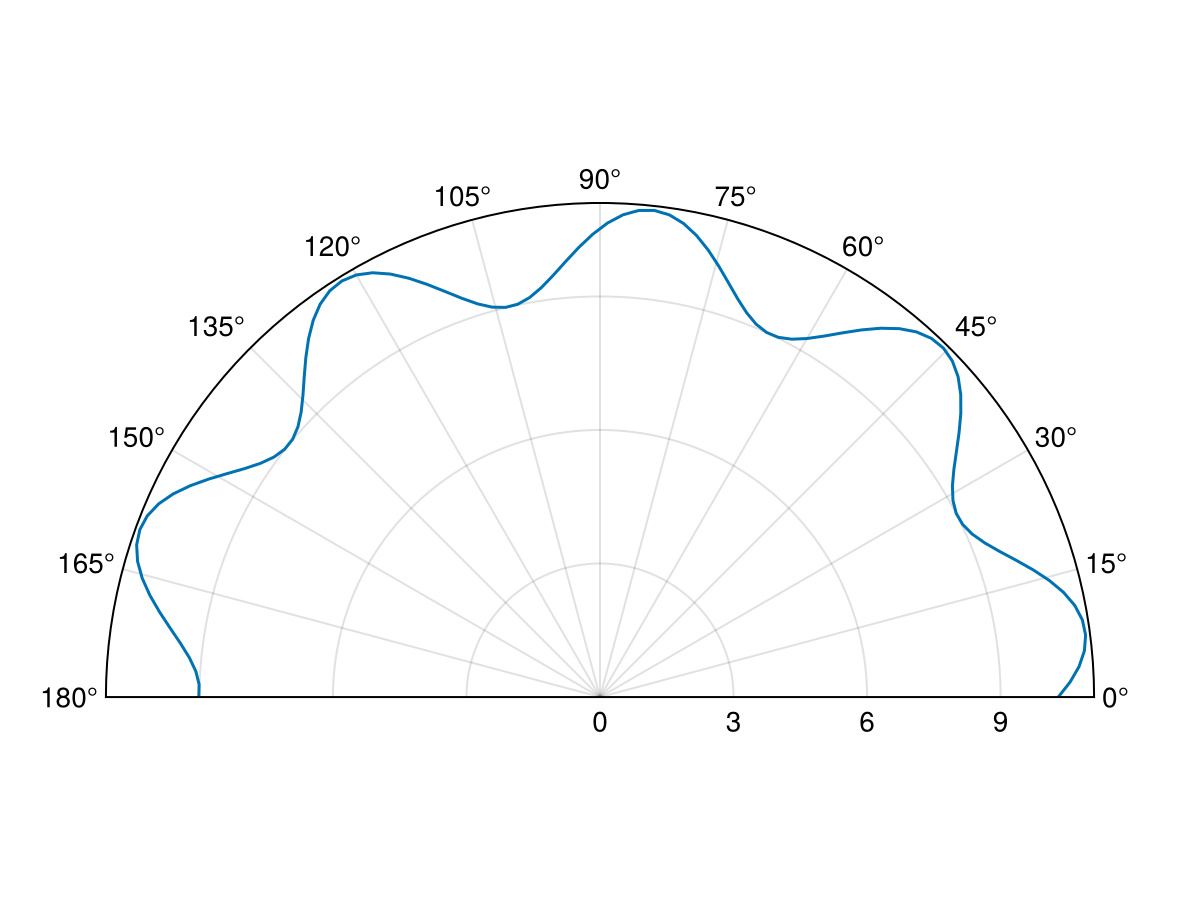
In this case you may want to offset the r-direction to make more of your data visible. This can be done by setting ax.radius_at_origin which translates radii as r_out = r_in - radius_at_origin.
using CairoMakie
fig = Figure()
ax = PolarAxis(fig[1, 1], thetalimits = (0, pi), radius_at_origin = 8)
lines!(ax, range(0, pi, length=100), 10 .+ sin.(0.3 .* (1:100)))
fig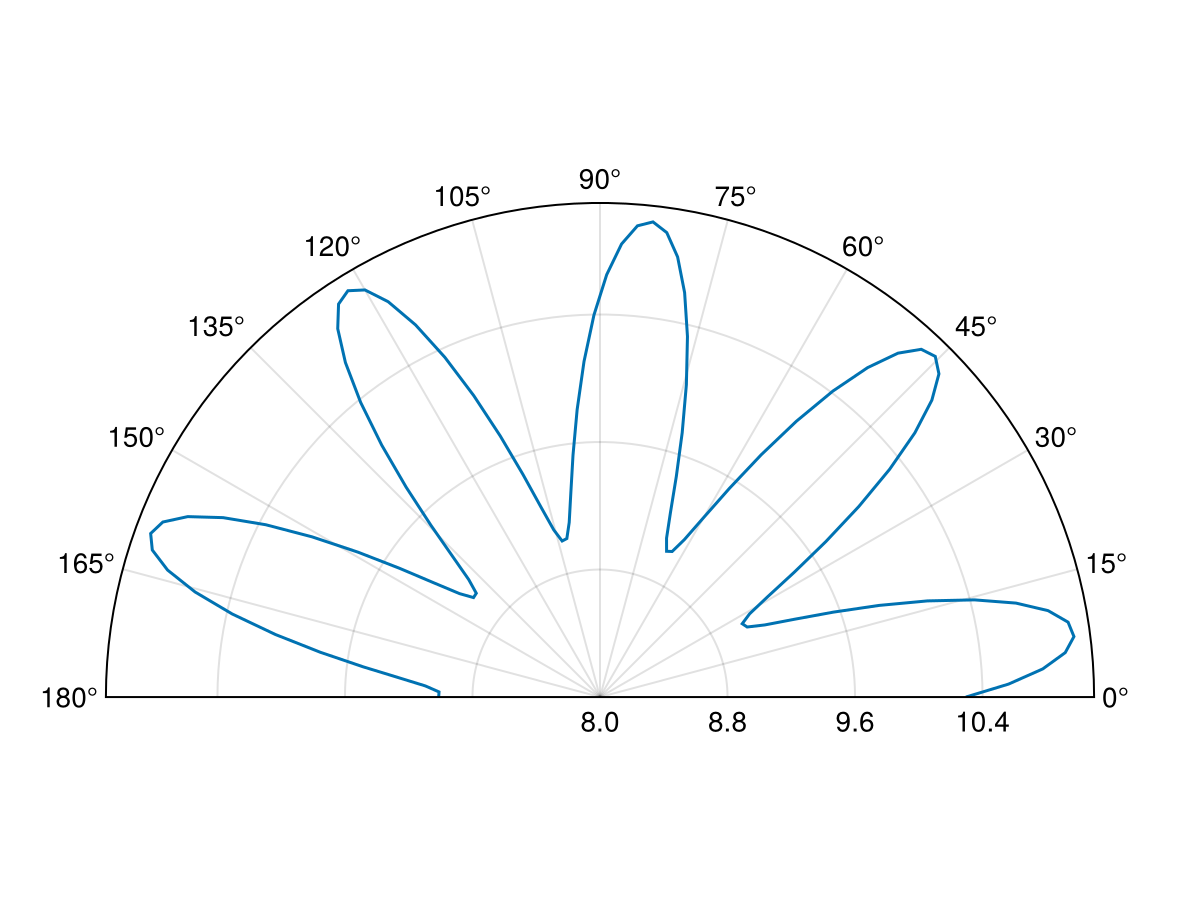
This can also be used to show a plot with negative radii:
using CairoMakie
fig = Figure()
ax = PolarAxis(fig[1, 1], thetalimits = (0, pi), radius_at_origin = -12)
lines!(ax, range(0, pi, length=100), sin.(0.3 .* (1:100)) .- 10)
fig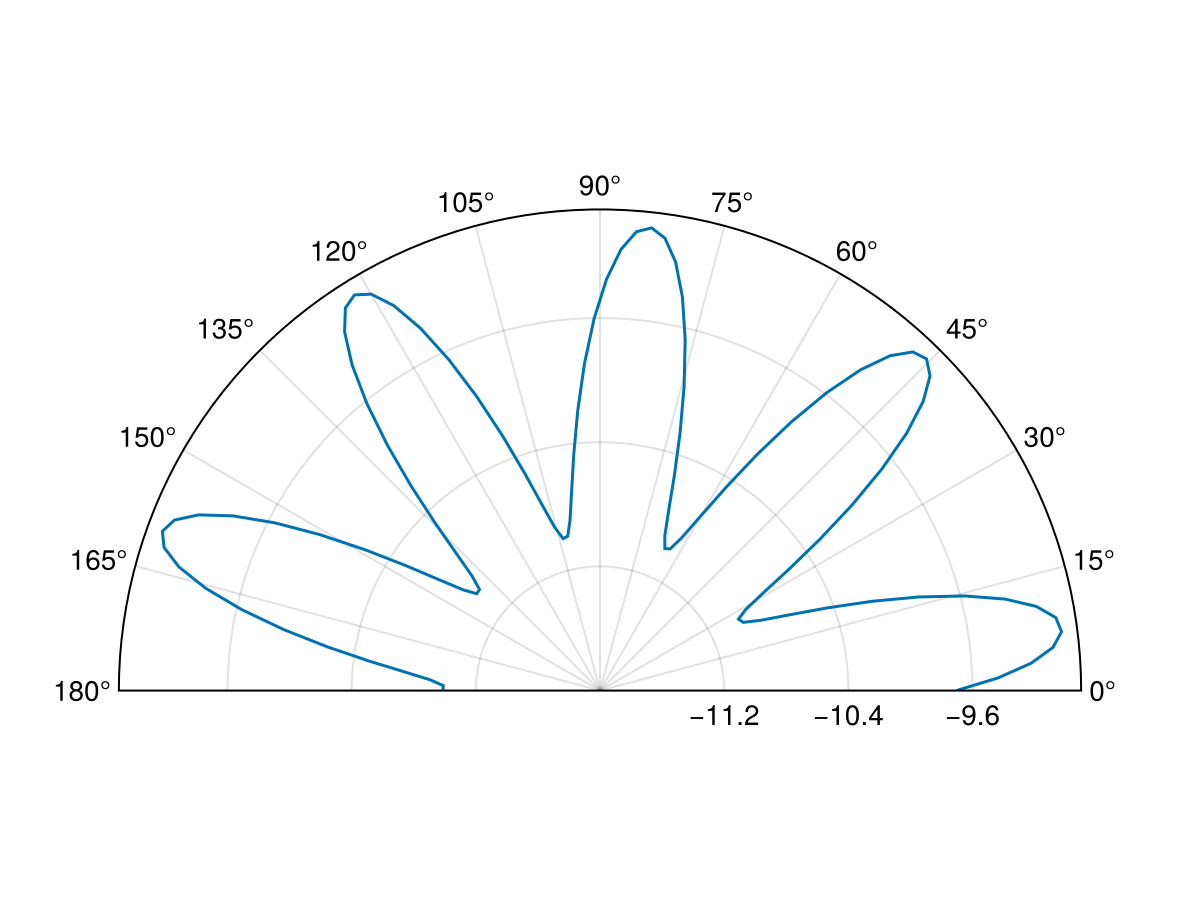
Note however that translating radii results in some level of distortion:
using CairoMakie
phis = range(pi/4, 9pi/4, length=201)
rs = 1.0 ./ sin.(range(pi/4, 3pi/4, length=51)[1:end-1])
rs = vcat(rs, rs, rs, rs, rs[1])

fig = Figure(size = (900, 300))
ax1 = PolarAxis(fig[1, 1], radius_at_origin = -2,  title = "radius_at_origin = -2")
ax2 = PolarAxis(fig[1, 2], radius_at_origin = 0,   title = "radius_at_origin = 0")
ax3 = PolarAxis(fig[1, 3], radius_at_origin = 0.5, title = "radius_at_origin = 0.5")
for ax in (ax1, ax2, ax3)
    lines!(ax, phis, rs .- 2, color = :red, linewidth = 4)
    lines!(ax, phis, rs, color = :black, linewidth = 4)
    lines!(ax, phis, rs .+ 0.5, color = :blue, linewidth = 4)
end
fig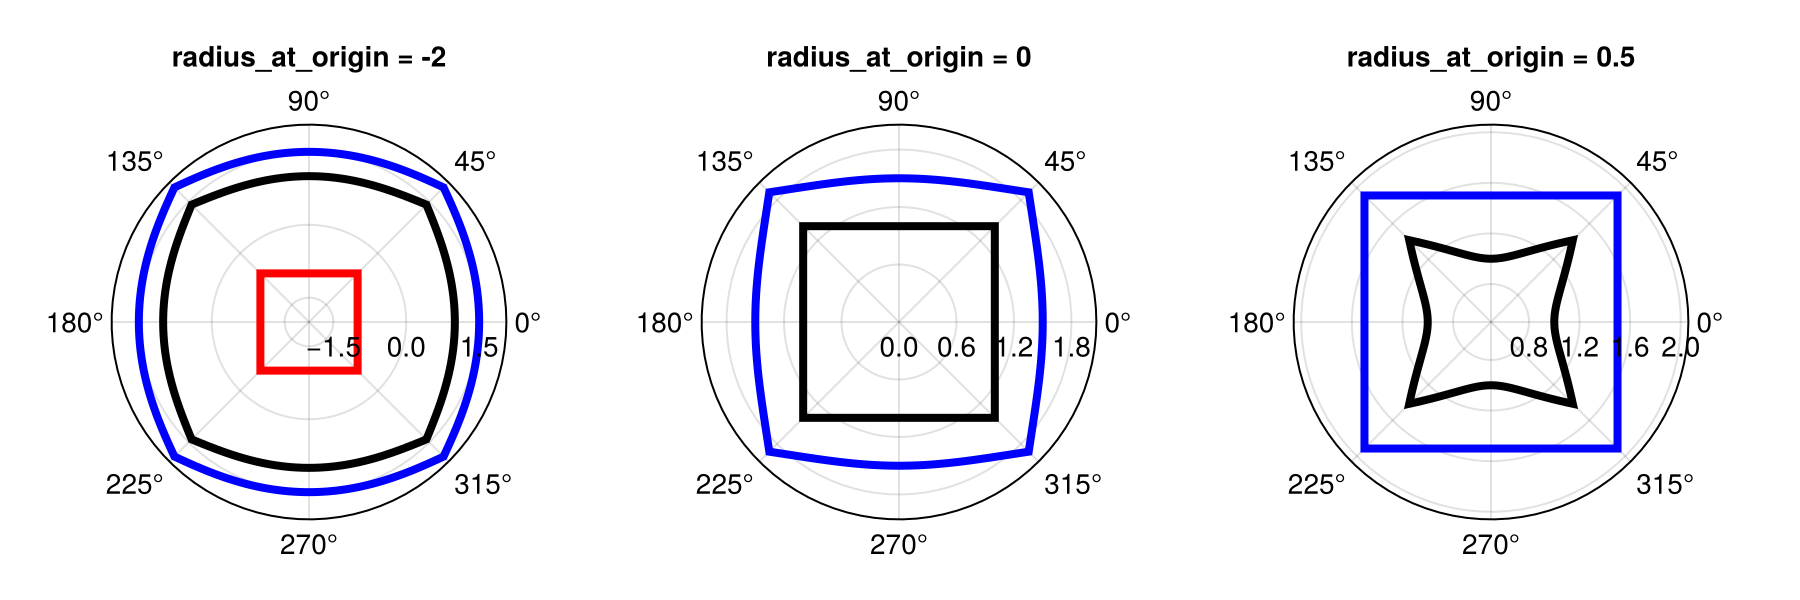
Radial clipping
By default radii r_out = r_in - radius_at_origin < 0 are clipped by the Polar transform. This can be disabled by setting ax.clip_r = false. With that setting r_out < 0 will pass through the polar transform as is, resulting in a coordinate at
using CairoMakie
fig = Figure(size = (600, 300))
ax1 = PolarAxis(fig[1, 1], radius_at_origin = 0.0, clip_r = true, title = "clip_r = true")
ax2 = PolarAxis(fig[1, 2], radius_at_origin = 0.0, clip_r = false, title = "clip_r = false")
for ax in (ax1, ax2)
    lines!(ax, 0..2pi, phi -> cos(2phi) - 0.5, color = :red, linewidth = 4)
    lines!(ax, 0..2pi, phi -> sin(2phi), color = :black, linewidth = 4)
end
fig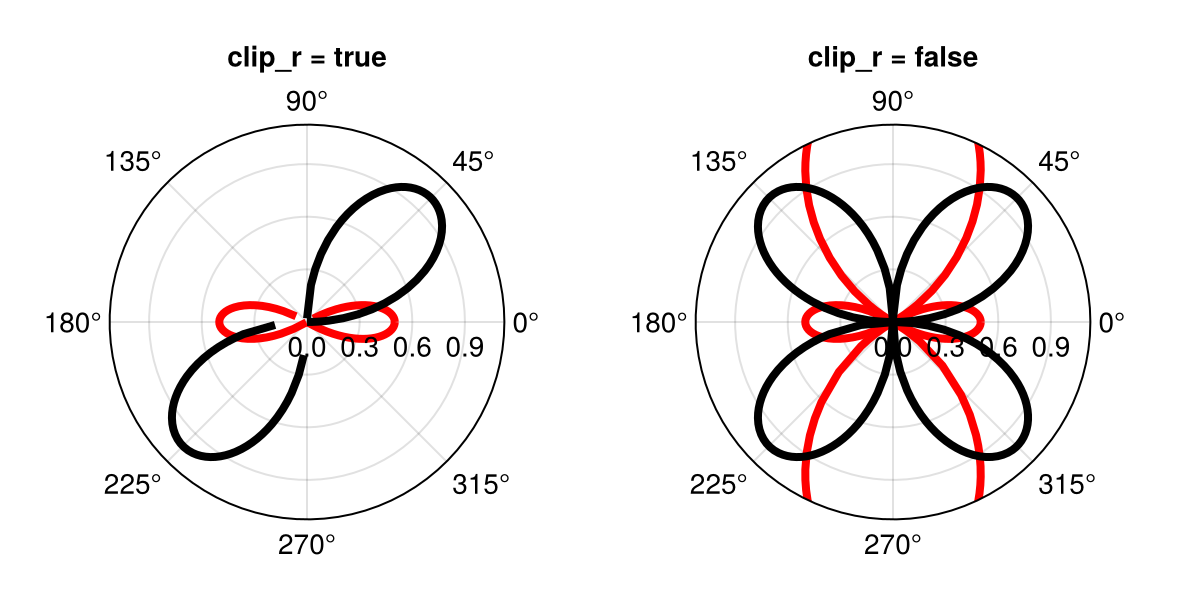
Attributes
alignmode
Defaults to Inside()
The alignment of the scene in its suggested bounding box.
axis_rotation_button
Defaults to Keyboard.left_control & Mouse.right
Sets the button for rotating the PolarAxis as a whole. This replaces theta translation when triggered and must include a mouse button.
backgroundcolor
Defaults to inherit(scene, :backgroundcolor, :white)
The background color of the axis.
clip
Defaults to true
Controls whether to activate the nonlinear clip feature. Note that this should not be used when the background is ultimately transparent.
clip_r
Defaults to true
Controls whether r < 0 (after applying radius_at_origin) gets clipped (true) or not (false).
clipcolor
Defaults to automatic
Sets the color of the clip polygon. Mainly for debug purposes.
dim1_conversion
Defaults to nothing
Global state for the x dimension conversion.
dim2_conversion
Defaults to nothing
Global state for the y dimension conversion.
direction
Defaults to 1
The direction of rotation. Can be -1 (clockwise) or 1 (counterclockwise).
fixrmin
Defaults to true
Controls whether rmin remains fixed during zooming and translation. (The latter will be turned off by setting this to true.)
gridz
Defaults to -100
Sets the z value of grid lines. To place the grid above plots set this to a value between 1 and 8999.
halign
Defaults to :center
The horizontal alignment of the scene in its suggested bounding box.
height
Defaults to nothing
The height setting of the scene.
normalize_theta_ticks
Defaults to true
Sets whether shown theta ticks get normalized to a -2pi to 2pi range. If not, the limits such as (2pi, 4pi) will be shown as that range.
r_translation_button
Defaults to Mouse.right
Sets the mouse button for translating the plot in r-direction.
radius_at_origin
Defaults to automatic
Sets the radius at the origin of the PolarAxis such that r_out = r_in - radius_at_origin. Can be set to automatic to match rmin. Note that this will affect the shape of plotted objects.
rautolimitmargin
Defaults to (0.05, 0.05)
The relative margins added to the autolimits in r direction.
reset_axis_orientation
Defaults to false
Sets whether the axis orientation (changed with the axis_rotation_button) gets reset when resetting the axis. If set to false only the limits will reset.
reset_button
Defaults to Keyboard.left_control & Mouse.left
Sets the button or button combination for resetting the axis view. (This should be compatible with ispressed.)
rgridcolor
Defaults to inherit(scene, (:Axis, :xgridcolor), RGBAf(0, 0, 0, 0.12))
The color of the r grid.
rgridstyle
Defaults to inherit(scene, (:Axis, :xgridstyle), nothing)
The linestyle of the r grid.
rgridvisible
Defaults to inherit(scene, (:Axis, :xgridvisible), true)
Controls if the r grid is visible.
rgridwidth
Defaults to inherit(scene, (:Axis, :xgridwidth), 1)
The linewidth of the r grid.
rlimits
Defaults to (:origin, nothing)
The radial limits of the PolarAxis.
rminorgridcolor
Defaults to inherit(scene, (:Axis, :xminorgridcolor), RGBAf(0, 0, 0, 0.05))
The color of the r minor grid.
rminorgridstyle
Defaults to inherit(scene, (:Axis, :xminorgridstyle), nothing)
The linestyle of the r minor grid.
rminorgridvisible
Defaults to inherit(scene, (:Axis, :xminorgridvisible), false)
Controls if the r minor grid is visible.
rminorgridwidth
Defaults to inherit(scene, (:Axis, :xminorgridwidth), 1)
The linewidth of the r minor grid.
rminortickalign
Defaults to 0.0
The alignment of r minor ticks on the axis spine
rminortickcolor
Defaults to :black
The tick color of r minor ticks
rminorticks
Defaults to IntervalsBetween(2)
The specifier for the minor r ticks.
rminorticksize
Defaults to 3.0
The tick size of r minor ticks
rminorticksvisible
Defaults to false
Controls if minor ticks on the r axis are visible
rminortickwidth
Defaults to 1.0
The tick width of r minor ticks
rtickalign
Defaults to 0.0
The alignment of the rtick marks relative to the axis spine (0 = out, 1 = in).
rtickangle
Defaults to automatic
The angle in radians along which the r ticks are printed.
rtickcolor
Defaults to RGBf(0, 0, 0)
The color of the rtick marks.
rtickformat
Defaults to Makie.automatic
The formatter for the r ticks
rticklabelcolor
Defaults to inherit(scene, (:Axis, :xticklabelcolor), inherit(scene, :textcolor, :black))
The color of the r tick labels.
rticklabelfont
Defaults to inherit(scene, (:Axis, :xticklabelfont), inherit(scene, :font, Makie.defaultfont()))
The font of the r tick labels.
rticklabelpad
Defaults to 4.0
Padding of the r ticks label.
rticklabelrotation
Defaults to automatic
Sets the rotation of r tick labels.
Options:
:radialrotates labels based on the angle they appear at:horizontalkeeps labels at a horizontal orientation:alignedrotates labels based on the angle they appear at but keeps them up-right and close to horizontalautomaticuses:horizontalwhen theta limits span >1.9pi and:alignedotherwise::Realsets the label rotation to a specific value
rticklabelsize
Defaults to inherit(scene, (:Axis, :yticklabelsize), inherit(scene, :fontsize, 16))
The fontsize of the r tick labels.
rticklabelstrokecolor
Defaults to automatic
The color of the outline of r ticks. By default this uses the background color.
rticklabelstrokewidth
Defaults to 0.0
The width of the outline of r ticks. Setting this to 0 will remove the outline.
rticklabelsvisible
Defaults to inherit(scene, (:Axis, :xticklabelsvisible), true)
Controls if the r ticks are visible.
rticks
Defaults to LinearTicks(4)
The specifier for the radial (r) ticks, similar to xticks for a normal Axis.
rticksize
Defaults to 5.0
The size of the rtick marks.
rticksmirrored
Defaults to false
If set to true and theta range is below 2pi, mirrors r ticks to the other side in a PolarAxis.
rticksvisible
Defaults to false
Controls if the rtick marks are visible.
rtickwidth
Defaults to 1.0
The width of the rtick marks.
rzoomkey
Defaults to Keyboard.r
Sets the key used to restrict zooming to the r-direction. Can be set to true to always restrict zooming or false to disable the interaction.
rzoomlock
Defaults to false
Controls whether adjusting the rlimits through interactive zooming is blocked.
sample_density
Defaults to 90
The density at which curved lines are sampled. (grid lines, spine lines, clip)
spinecolor
Defaults to :black
The color of the spine.
spinestyle
Defaults to nothing
The linestyle of the spine.
spinevisible
Defaults to true
Controls whether the spine is visible.
spinewidth
Defaults to 1
The width of the spine.
tellheight
Defaults to true
Controls if the parent layout can adjust to this element's height
tellwidth
Defaults to true
Controls if the parent layout can adjust to this element's width
theta_0
Defaults to 0.0
The angular offset for (1, 0) in the PolarAxis. This rotates the axis.
theta_as_x
Defaults to true
Controls the argument order of the Polar transform. If theta_as_x = true it is (θ, r), otherwise (r, θ).
theta_translation_button
Defaults to Mouse.right
Sets the mouse button for translating the plot in theta-direction. Note that this can be the same as radial_translation_button.
thetaautolimitmargin
Defaults to (0.05, 0.05)
The relative margins added to the autolimits in theta direction.
thetagridcolor
Defaults to inherit(scene, (:Axis, :ygridcolor), RGBAf(0, 0, 0, 0.12))
The color of the theta grid.
thetagridstyle
Defaults to inherit(scene, (:Axis, :ygridstyle), nothing)
The linestyle of the theta grid.
thetagridvisible
Defaults to inherit(scene, (:Axis, :ygridvisible), true)
Controls if the theta grid is visible.
thetagridwidth
Defaults to inherit(scene, (:Axis, :ygridwidth), 1)
The linewidth of the theta grid.
thetalimits
Defaults to (0.0, 2pi)
The angle limits of the PolarAxis. (0.0, 2pi) results a full circle. (nothing, nothing) results in limits picked based on plot limits.
thetaminorgridcolor
Defaults to inherit(scene, (:Axis, :yminorgridcolor), RGBAf(0, 0, 0, 0.05))
The color of the theta minor grid.
thetaminorgridstyle
Defaults to inherit(scene, (:Axis, :yminorgridstyle), nothing)
The linestyle of the theta minor grid.
thetaminorgridvisible
Defaults to inherit(scene, (:Axis, :yminorgridvisible), false)
Controls if the theta minor grid is visible.
thetaminorgridwidth
Defaults to inherit(scene, (:Axis, :yminorgridwidth), 1)
The linewidth of the theta minor grid.
thetaminortickalign
Defaults to 0.0
The alignment of theta minor ticks on the axis spine
thetaminortickcolor
Defaults to :black
The tick color of theha minor ticks
thetaminorticks
Defaults to IntervalsBetween(2)
The specifier for the minor theta ticks.
thetaminorticksize
Defaults to 3.0
The tick size of theta minor ticks
thetaminorticksvisible
Defaults to false
Controls if minor ticks on the theta axis are visible
thetaminortickwidth
Defaults to 1.0
The tick width of theta minor ticks
thetatickalign
Defaults to 0.0
The alignment of the theta tick marks relative to the axis spine (0 = out, 1 = in).
thetatickcolor
Defaults to RGBf(0, 0, 0)
The color of the theta tick marks.
thetatickformat
Defaults to Makie.automatic
The formatter for the theta ticks.
thetaticklabelcolor
Defaults to inherit(scene, (:Axis, :yticklabelcolor), inherit(scene, :textcolor, :black))
The color of the theta tick labels.
thetaticklabelfont
Defaults to inherit(scene, (:Axis, :yticklabelfont), inherit(scene, :font, Makie.defaultfont()))
The font of the theta tick labels.
thetaticklabelpad
Defaults to 4.0
Padding of the theta ticks label.
thetaticklabelsize
Defaults to inherit(scene, (:Axis, :xticklabelsize), inherit(scene, :fontsize, 16))
The fontsize of the theta tick labels.
thetaticklabelstrokecolor
Defaults to automatic
The color of the outline of theta ticks. By default this uses the background color.
thetaticklabelstrokewidth
Defaults to 0.0
The width of the outline of theta ticks. Setting this to 0 will remove the outline.
thetaticklabelsvisible
Defaults to inherit(scene, (:Axis, :yticklabelsvisible), true)
Controls if the theta ticks are visible.
thetaticks
Defaults to AngularTicks(180 / pi, "°")
The specifier for the angular (theta) ticks, similar to yticks for a normal Axis.
thetaticksize
Defaults to 5.0
The size of the theta tick marks.
thetaticksmirrored
Defaults to false
If set to true and rmin > 0, mirrors theta ticks to the other side of the PolarAxis.
thetaticksvisible
Defaults to false
Controls if the theta tick marks are visible.
thetatickwidth
Defaults to 1.0
The width of the theta tick marks.
thetazoomkey
Defaults to Keyboard.t
Sets the key used to restrict zooming to the theta-direction. Can be set to true to always restrict zooming or false to disable the interaction.
thetazoomlock
Defaults to true
Controls whether adjusting the thetalimits through interactive zooming is blocked.
title
Defaults to ""
The title of the plot
titlealign
Defaults to :center
The alignment of the title. Can be any of :center, :left, or :right.
titlecolor
Defaults to inherit(scene, (:Axis, :titlecolor), inherit(scene, :textcolor, :black))
The color of the title.
titlefont
Defaults to inherit(scene, (:Axis, :titlefont), :bold)
The font of the title.
titlegap
Defaults to inherit(scene, (:Axis, :titlegap), 4)
The gap between the title and the top of the axis
titlesize
Defaults to inherit(scene, (:Axis, :titlesize), inherit(scene, :fontsize, 16))
The fontsize of the title.
titlevisible
Defaults to inherit(scene, (:Axis, :titlevisible), true)
Controls if the title is visible.
valign
Defaults to :center
The vertical alignment of the scene in its suggested bounding box.
width
Defaults to nothing
The width setting of the scene.
zoomspeed
Defaults to 0.1
Sets the speed of scroll based zooming. Setting this to 0 effectively disables zooming.