voronoiplot
Makie.voronoiplot Function
voronoiplot(x, y, values; kwargs...)
voronoiplot(values; kwargs...)
voronoiplot(x, y; kwargs...)
voronoiplot(positions; kwargs...)
voronoiplot(vorn::VoronoiTessellation; kwargs...)
Generates and plots a Voronoi tessalation from heatmap- or point-like data. The tessellation can also be passed directly as a VoronoiTessellation from DelaunayTriangulation.jl.
Plot type
The plot type alias for the voronoiplot function is Voronoiplot.
Examples
A voronoiplot generates a cell for each passed position similar to heatmap, however the cells are not restricted to a rectangular shape. It can be called with point based (like scatter or lines) or heatmap-like inputs.
using CairoMakie
using Random
Random.seed!(1234)


f = Figure(size=(1200, 450))
ax = Axis(f[1, 1])
voronoiplot!(ax, rand(Point2f, 50))

ax = Axis(f[1, 2])
voronoiplot!(ax, rand(10, 10), rand(10, 10), rand(10, 10))
f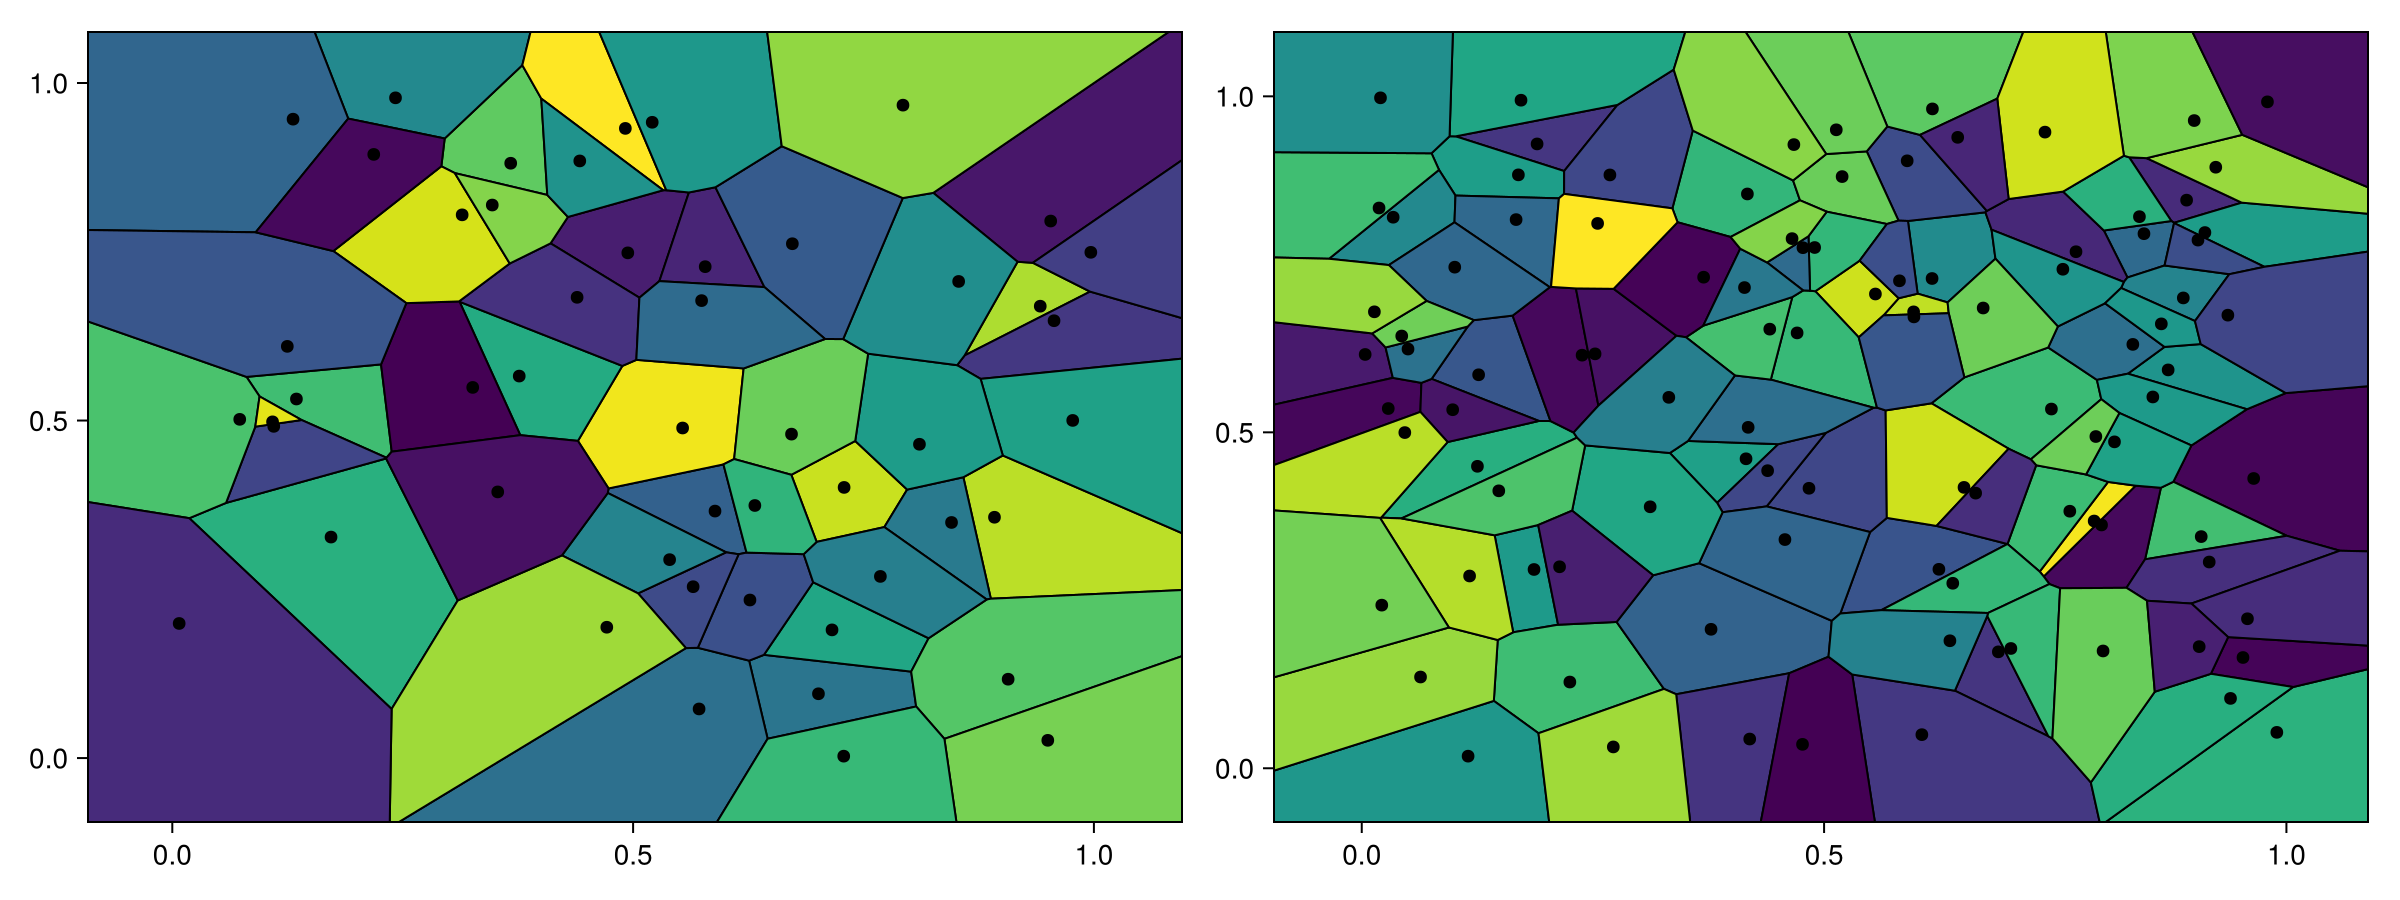
voronoiplot uses the Voronoi tessellation from DelaunayTriangulation.jl to generate the cells. You can also do this yourself and directly plot the VoronoiTessellation object returned.
using CairoMakie
using DelaunayTriangulation

using Random
Random.seed!(1234)

points = rand(2, 50)
tri = triangulate(points)
vorn = voronoi(tri)
f, ax, tr = voronoiplot(vorn)
f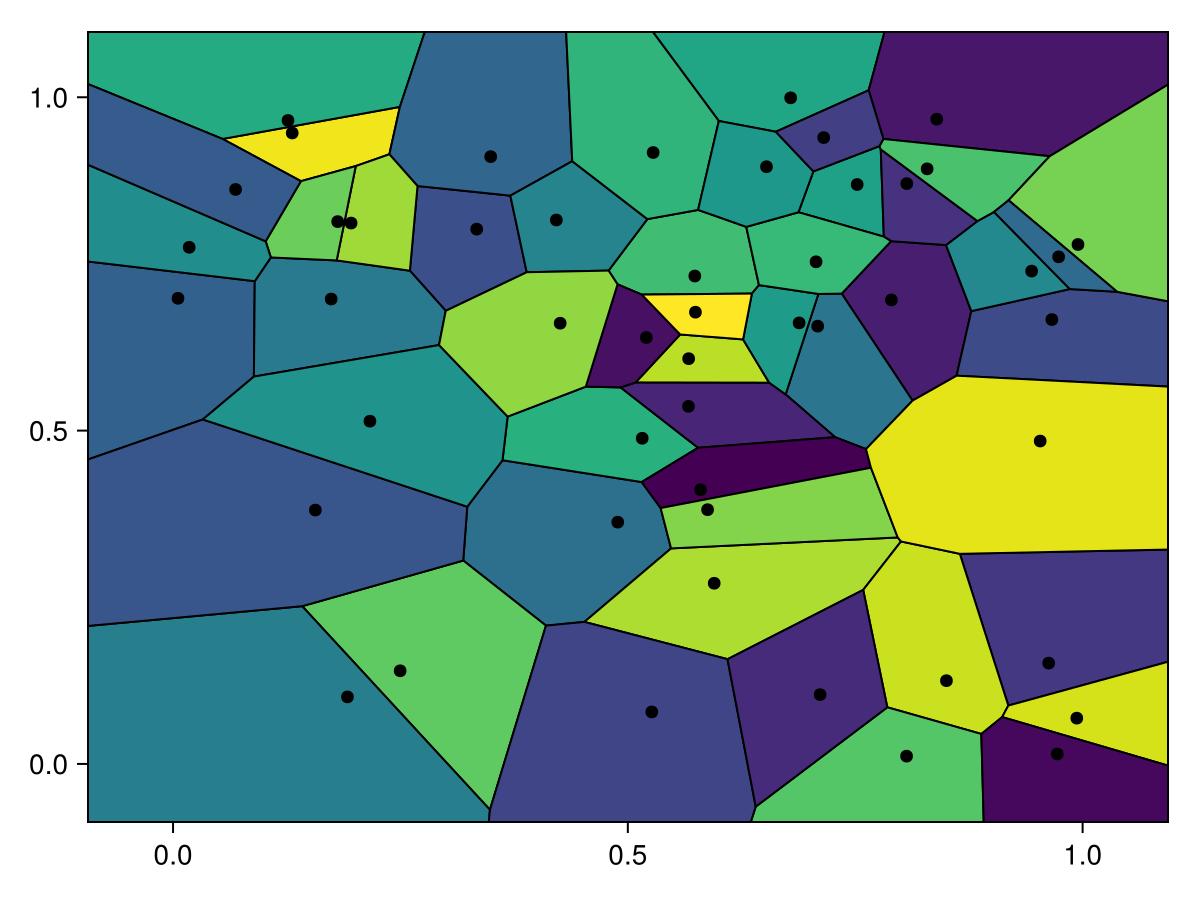
When considering standard tessellations the unbounded polygons are clipped at a bounding box determined automatically by default, or from a user-provided clipping shape (a rectangle or circle). The automatic bounding box is determined by the bounding box of generators of the tessellation, meaning the provided points, extended out by some factor unbounded_edge_extension_factor (default 0.1) proportional to the lengths of the bounding box's sides.
using CairoMakie
using DelaunayTriangulation

using Random
Random.seed!(1234)

z = LinRange(0, 1, 250) .* exp.(LinRange(0, 16pi, 250) .* im)
f, ax, tr = voronoiplot(real(z), imag(z), unbounded_edge_extension_factor = 0.4, markersize = 7)
f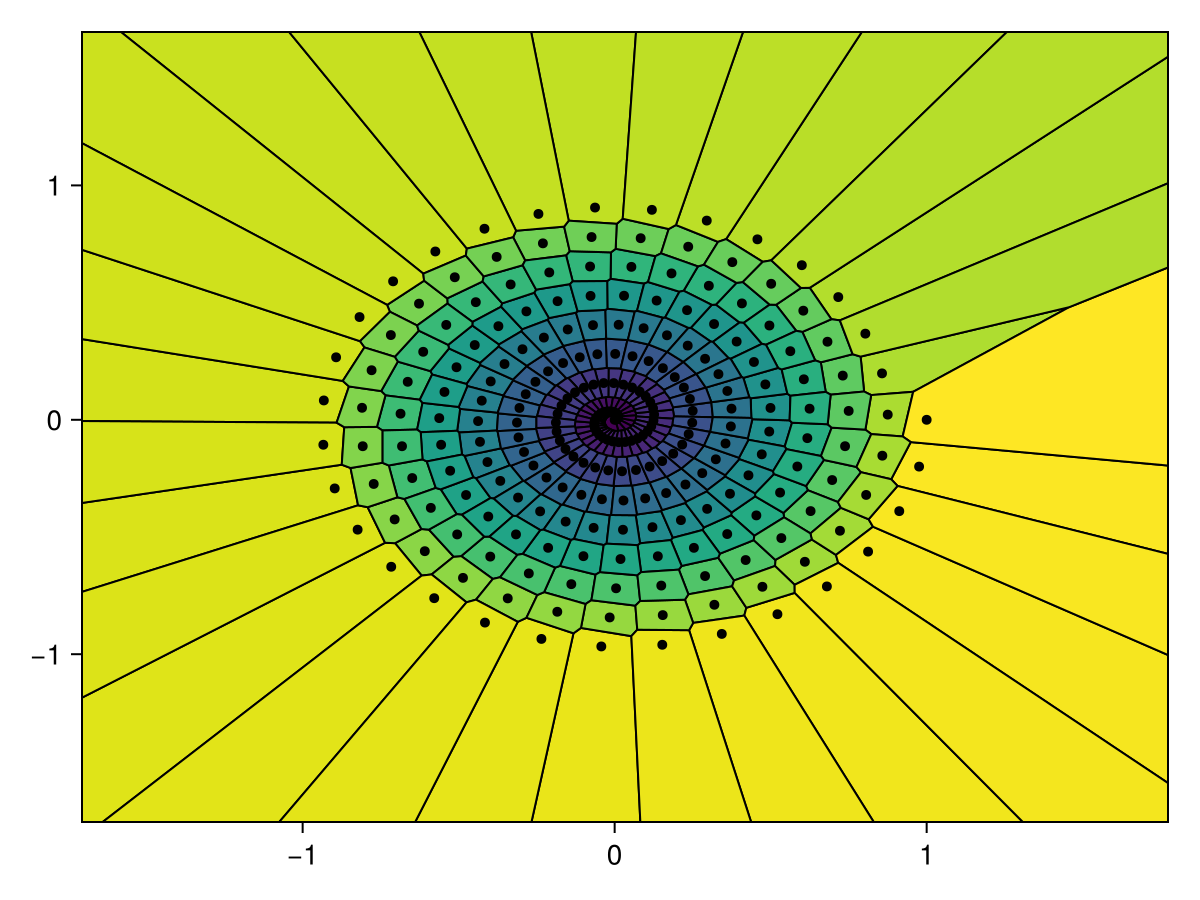
using CairoMakie
using DelaunayTriangulation

using Random
Random.seed!(1234)

x = LinRange(0, 16pi, 50)
y = sin.(x)
bb = BBox(-1, 16pi + 1, -30, 30) # (xmin, xmax, ymin, ymax)
f, ax, tr = voronoiplot(x, y, show_generators=false,
    clip=bb, color=:white, strokewidth=2)
f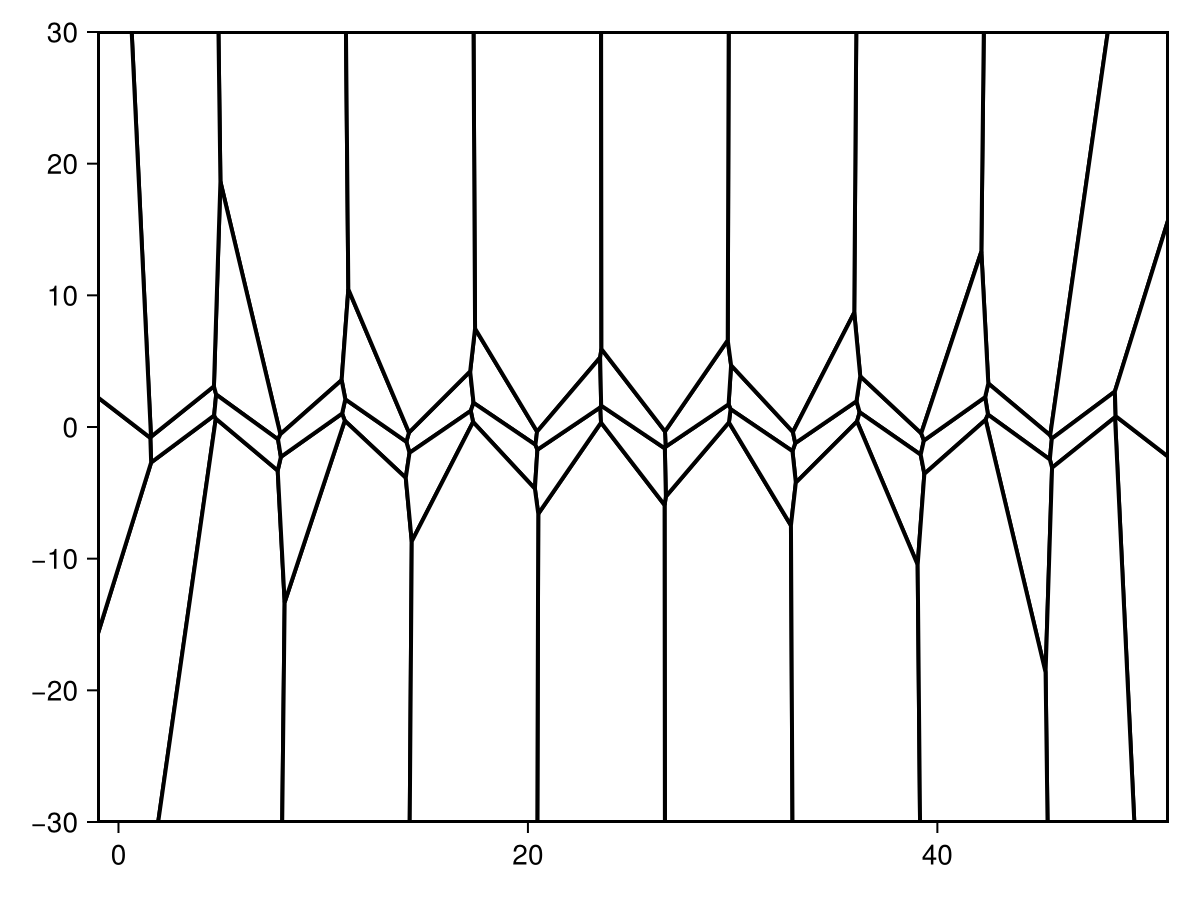
For clipped and centroidal tessellations, there are no unbounded polygons.
using CairoMakie
using DelaunayTriangulation

using Random
Random.seed!(1234)

points = [(0.0, 0.0), (1.0, 0.0), (1.0, 1.0), (0.0, 1.0)]
tri = triangulate(points)
refine!(tri; max_area = 0.001)
vorn = voronoi(tri, clip = true)
f, ax, tr = voronoiplot(vorn, show_generators = true, markersize = 13, marker = 'x')
f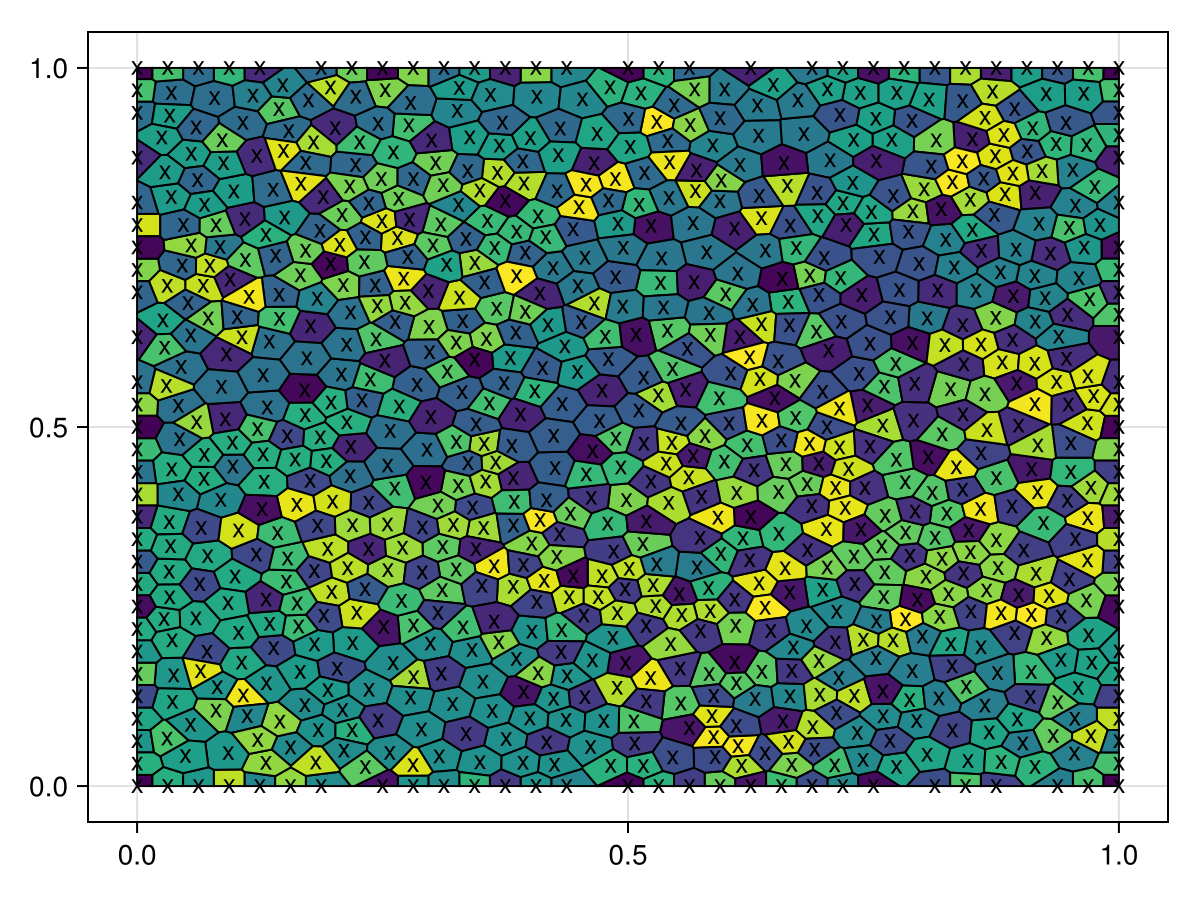
using CairoMakie
using DelaunayTriangulation

using Random
Random.seed!(1234)

angles = range(0, 2pi, length = 251)[1:end-1]
x = cos.(angles)
y = sin.(angles)
points = tuple.(x, y)
tri = triangulate(points)
refine!(tri; max_area = 0.001)
vorn = voronoi(tri, clip = true)
smooth_vorn = centroidal_smooth(vorn)
f, ax, tr = voronoiplot(smooth_vorn, show_generators=false)
f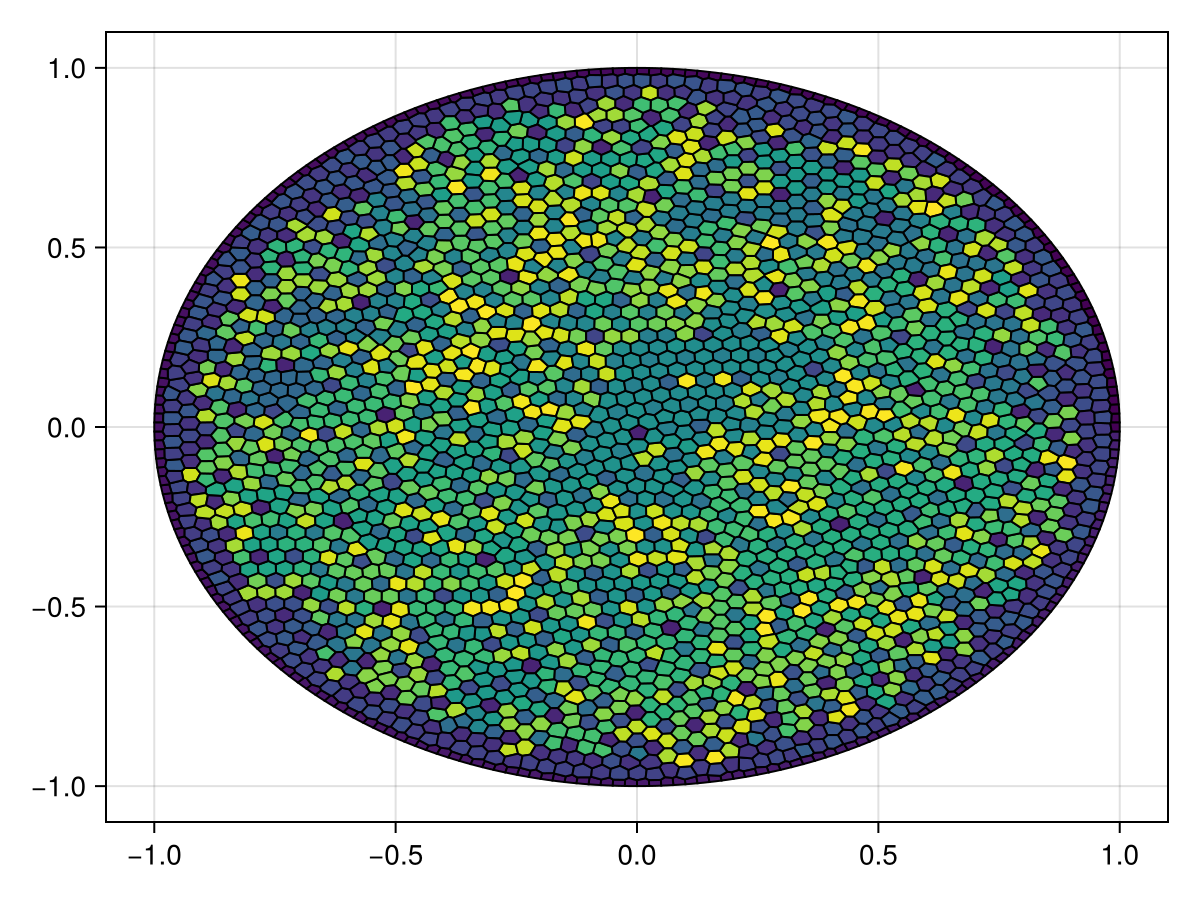
Attributes
alpha
Defaults to 1.0
The alpha value of the colormap or color attribute. Multiple alphas like in plot(alpha=0.2, color=(:red, 0.5), will get multiplied.
clip
Defaults to automatic
Sets the clipping area for the generated polygons which can be a Rect2 (or BBox), Tuple with entries (xmin, xmax, ymin, ymax) or as a Circle. Anything outside the specified area will be removed. If the clip is not set it is automatically determined using unbounded_edge_extension_factor as a Rect.
color
Defaults to automatic
Sets the color of the polygons. If automatic, the polygons will be individually colored according to the colormap.
colormap
Defaults to @inherit colormap :viridis
Sets the colormap that is sampled for numeric colors. PlotUtils.cgrad(...), Makie.Reverse(any_colormap) can be used as well, or any symbol from ColorBrewer or PlotUtils. To see all available color gradients, you can call Makie.available_gradients().
colorrange
Defaults to automatic
The values representing the start and end points of colormap.
colorscale
Defaults to identity
The color transform function. Can be any function, but only works well together with Colorbar for identity, log, log2, log10, sqrt, logit, Makie.pseudolog10 and Makie.Symlog10.
highclip
Defaults to automatic
The color for any value above the colorrange.
lowclip
Defaults to automatic
The color for any value below the colorrange.
marker
Defaults to @inherit marker
Sets the shape of the points.
markercolor
Defaults to @inherit markercolor
Sets the color of the points.
markersize
Defaults to @inherit markersize
Sets the size of the points.
nan_color
Defaults to :transparent
The color for NaN values.
show_generators
Defaults to true
Determines whether to plot the individual generators.
smooth
Defaults to false
No docs available.
strokecolor
Defaults to @inherit patchstrokecolor
Sets the strokecolor of the polygons.
strokewidth
Defaults to 1.0
Sets the width of the polygon stroke.
unbounded_edge_extension_factor
Defaults to 0.1
Sets the extension factor for the unbounded edges, used in DelaunayTriangulation.polygon_bounds.