boxplot
Makie.boxplot Function
boxplot(x, y; kwargs...)Draw a Tukey style boxplot. The boxplot has 3 components:
a
crossbarspanning the interquartile (IQR) range with a midline marking the medianan
errorbarwhose whiskers spanrange * iqrpoints marking outliers, that is, data outside the whiskers
Arguments
x: positions of the categoriesy: variables within the boxes
Plot type
The plot type alias for the boxplot function is BoxPlot.
Examples
using CairoMakie
categories = rand(1:3, 1000)
values = randn(1000)

boxplot(categories, values)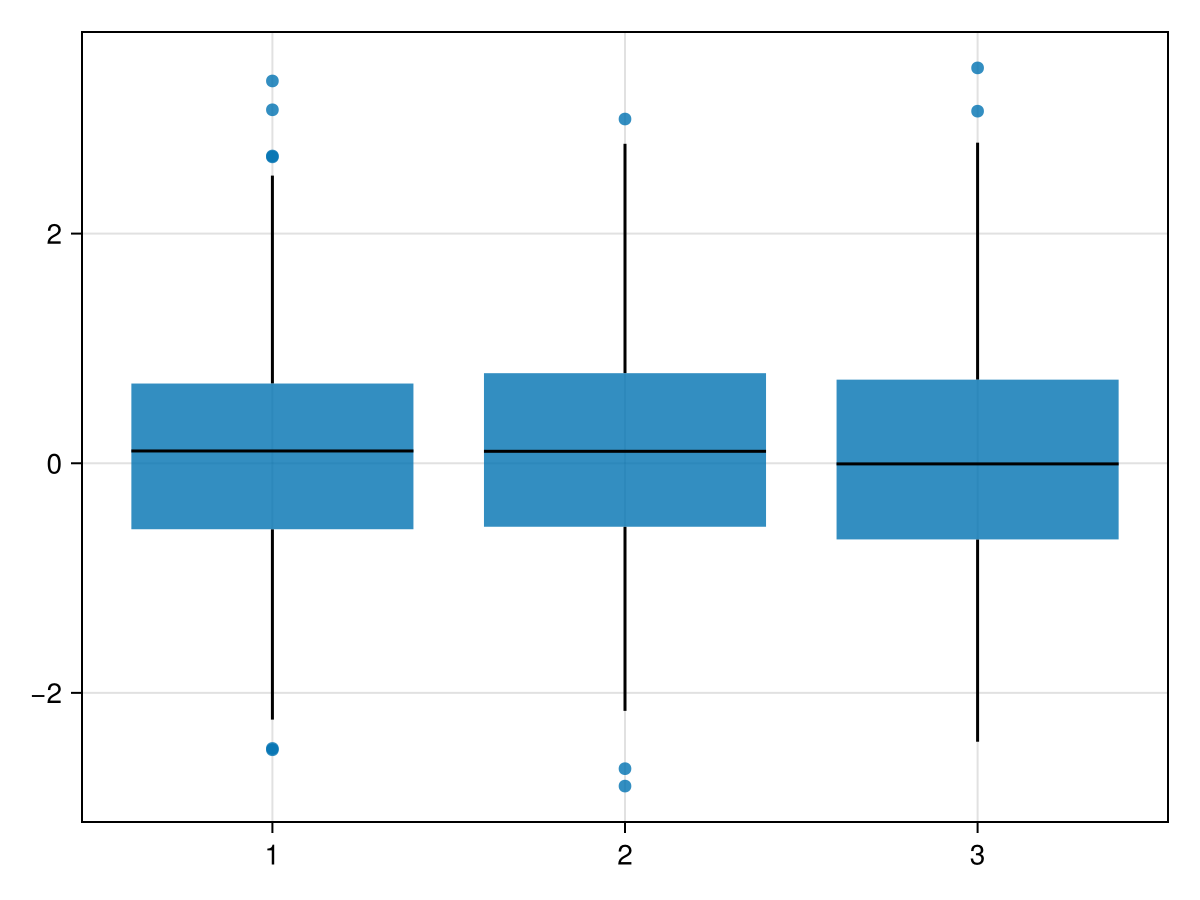
using CairoMakie
categories = rand(1:3, 1000)
values = randn(1000)
dodge = rand(1:2, 1000)

boxplot(categories, values, dodge = dodge, show_notch = true, color = dodge)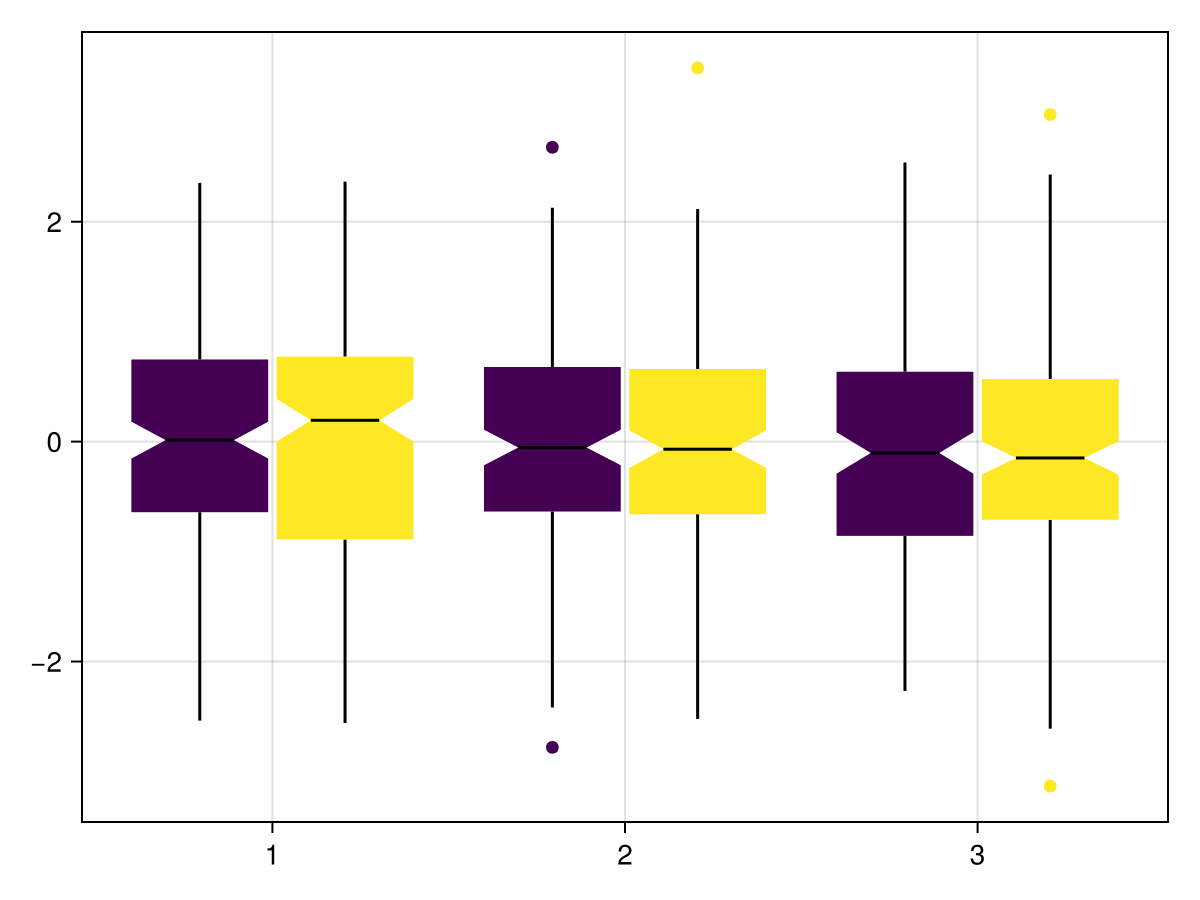
Colors are customizable. The color attribute refers to the color of the boxes, whereas outliercolor refers to the color of the outliers. If not scalars (e.g. :red), these attributes must have the length of the data. If outliercolor is not provided, outliers will have the same color as their box, as shown above.
Note
For all indices corresponding to points within the same box, color (but not outliercolor) must have the same value.
using CairoMakie
categories = rand(1:3, 1000)
values = randn(1000)
dodge = rand(1:2, 1000)

boxplot(categories, values, dodge = dodge, show_notch = true, color = map(d->d==1 ? :blue : :red, dodge) , outliercolor = rand([:red, :green, :blue, :black, :yellow], 1000))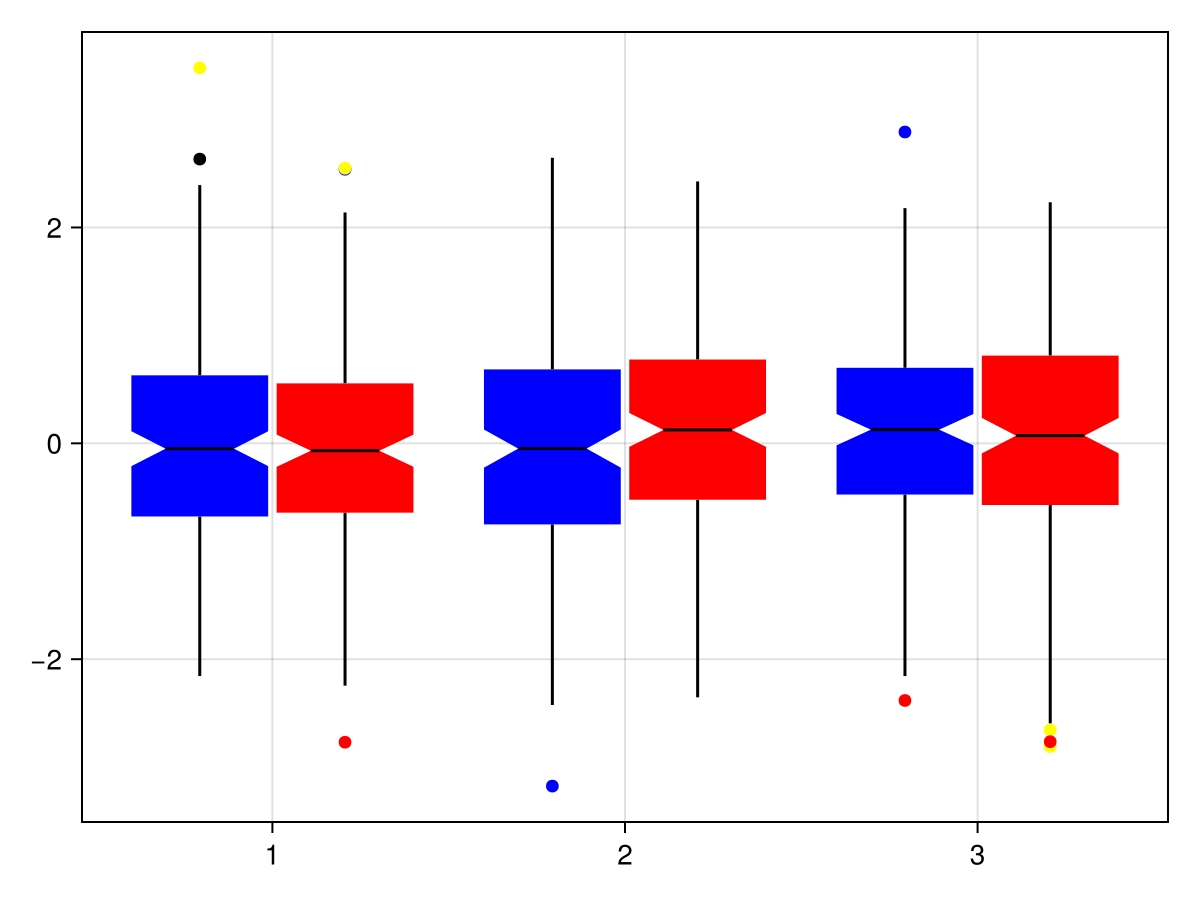
Using statistical weights
using CairoMakie
using Distributions

N = 100_000
x = rand(1:3, N)
y = rand(Uniform(-1, 5), N)

w = pdf.(Normal(), x .- y)

fig = Figure()

boxplot(fig[1,1], x, y)
boxplot(fig[1,2], x, y, weights = w)

fig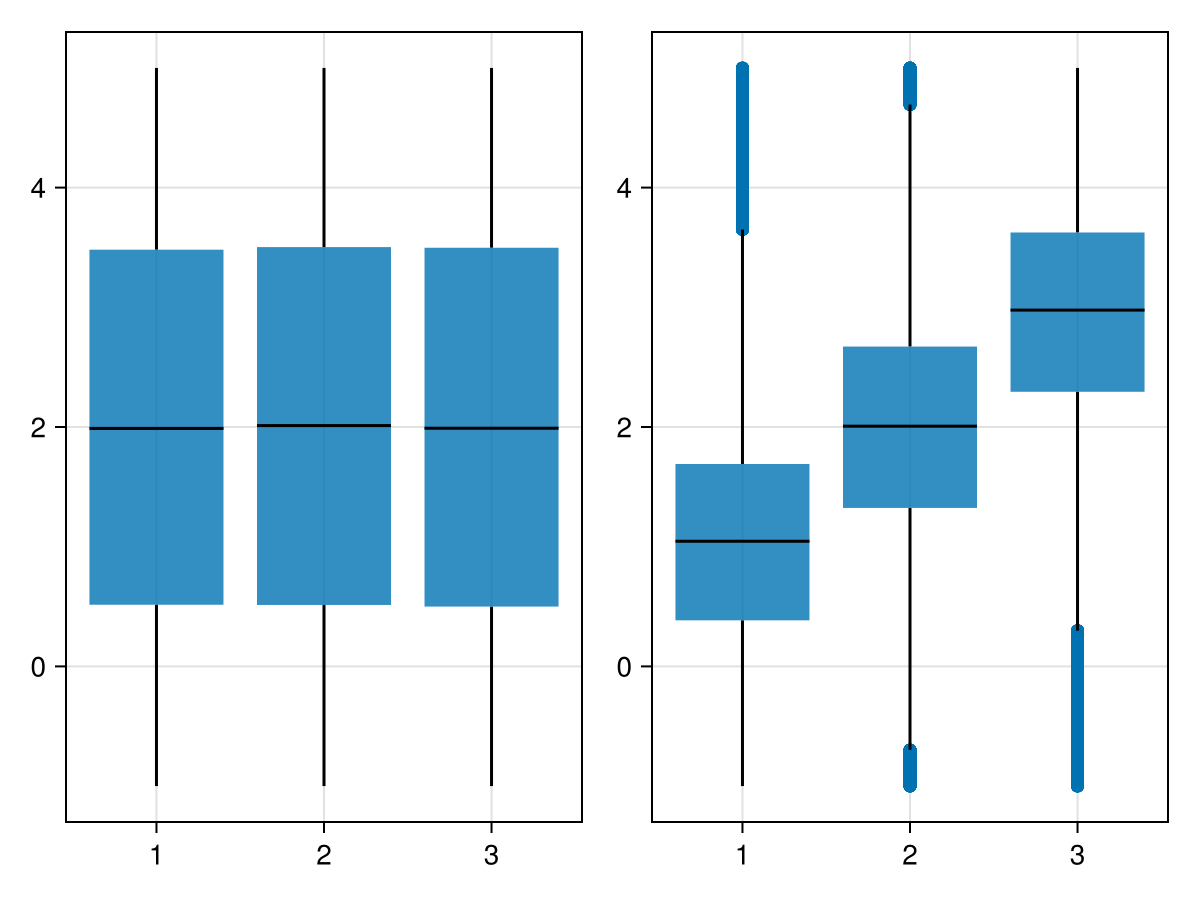
Horizontal axis
using CairoMakie
fig = Figure()

categories = rand(1:3, 1000)
values = randn(1000)

ax_vert = Axis(fig[1,1];
    xlabel = "categories",
    ylabel = "values",
    xticks = (1:3, ["one", "two", "three"])
)
ax_horiz = Axis(fig[1,2];
    xlabel="values", # note that x/y still correspond to horizontal/vertical axes respectively
    ylabel="categories",
    yticks=(1:3, ["one", "two", "three"])
)

# Note: same order of category/value, despite different axes
boxplot!(ax_vert, categories, values) # `orientation=:vertical` is default
boxplot!(ax_horiz, categories, values; orientation=:horizontal)

fig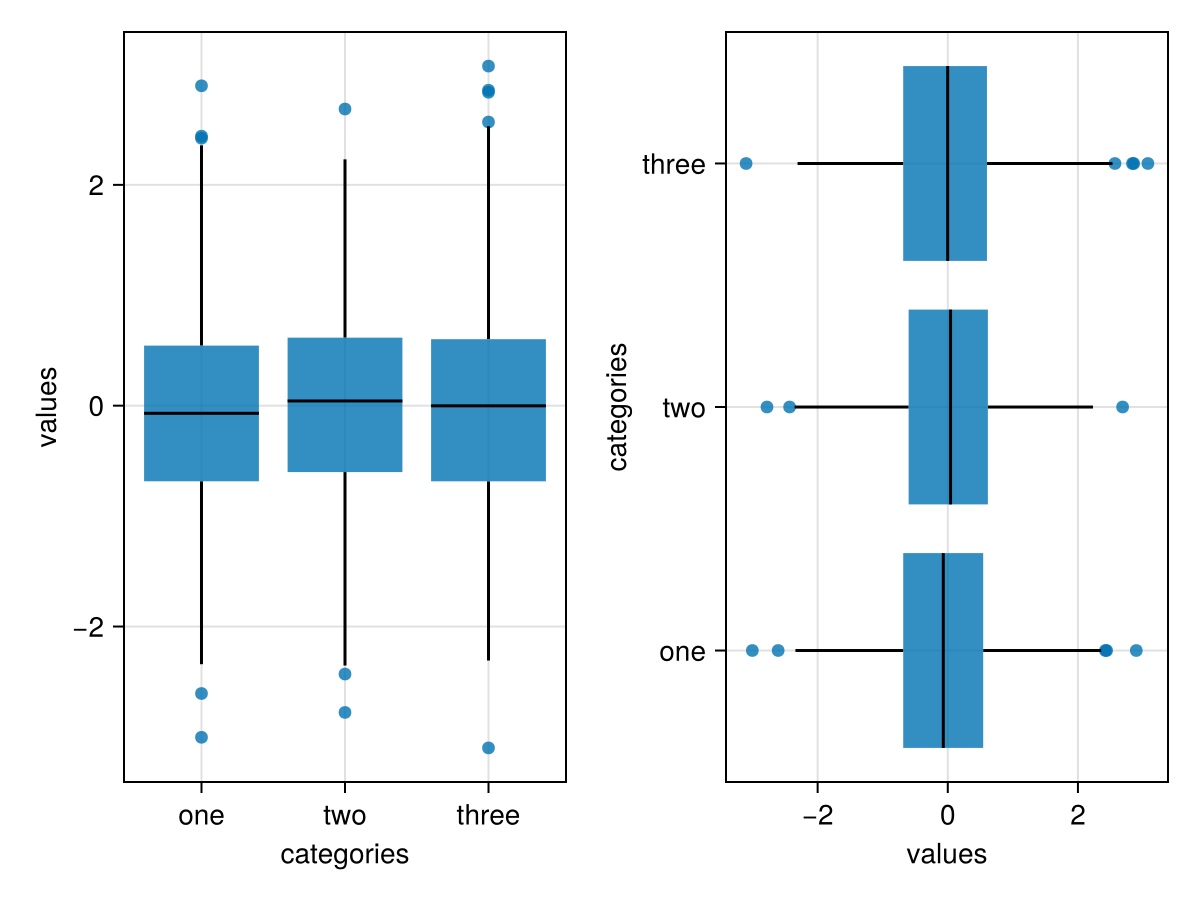
Attributes
color
Defaults to @inherit patchcolor
No docs available.
colormap
Defaults to @inherit colormap
No docs available.
colorrange
Defaults to automatic
No docs available.
colorscale
Defaults to identity
No docs available.
cycle
Defaults to [:color => :patchcolor]
No docs available.
dodge
Defaults to automatic
Vector of Integer (length of data) of grouping variable to create multiple side-by-side boxes at the same x position.
dodge_gap
Defaults to 0.03
Spacing between dodged boxes.
gap
Defaults to 0.2
Shrinking factor, width -> width * (1 - gap).
inspectable
Defaults to @inherit inspectable
No docs available.
marker
Defaults to @inherit marker
No docs available.
markersize
Defaults to @inherit markersize
No docs available.
mediancolor
Defaults to @inherit linecolor
No docs available.
medianlinewidth
Defaults to @inherit linewidth
No docs available.
n_dodge
Defaults to automatic
No docs available.
notchwidth
Defaults to 0.5
Multiplier of width for narrowest width of notch.
orientation
Defaults to :vertical
Orientation of box (:vertical or :horizontal).
outliercolor
Defaults to automatic
No docs available.
outlierstrokecolor
Defaults to @inherit markerstrokecolor
No docs available.
outlierstrokewidth
Defaults to @inherit markerstrokewidth
No docs available.
range
Defaults to 1.5
Multiple of IQR controlling whisker length.
show_median
Defaults to true
Show median as midline.
show_notch
Defaults to false
Draw the notch.
show_outliers
Defaults to true
Show outliers as points.
strokecolor
Defaults to @inherit patchstrokecolor
No docs available.
strokewidth
Defaults to @inherit patchstrokewidth
No docs available.
weights
Defaults to automatic
Vector of statistical weights (length of data). By default, each observation has weight 1.
whiskercolor
Defaults to @inherit linecolor
No docs available.
whiskerlinewidth
Defaults to @inherit linewidth
No docs available.
whiskerwidth
Defaults to 0.0
Multiplier of width for width of T's on whiskers, or :match to match width.
width
Defaults to automatic
Width of the box before shrinking.