poly
MakieCore.poly Function
poly(vertices, indices; kwargs...)
poly(points; kwargs...)
poly(shape; kwargs...)
poly(mesh; kwargs...)
Plots a polygon based on the arguments given. When vertices and indices are given, it functions similarly to mesh. When points are given, it draws one polygon that connects all the points in order. When a shape is given (essentially anything decomposable by GeometryBasics), it will plot decompose(shape).
poly(coordinates, connectivity; kwargs...)Plots polygons, which are defined by coordinates (the coordinates of the vertices) and connectivity (the edges between the vertices).
Plot type
The plot type alias for the poly function is Poly.
Examples
using CairoMakie
using Makie.GeometryBasics


f = Figure()
Axis(f[1, 1])

poly!(Point2f[(0, 0), (2, 0), (3, 1), (1, 1)], color = :red, strokecolor = :black, strokewidth = 1)

f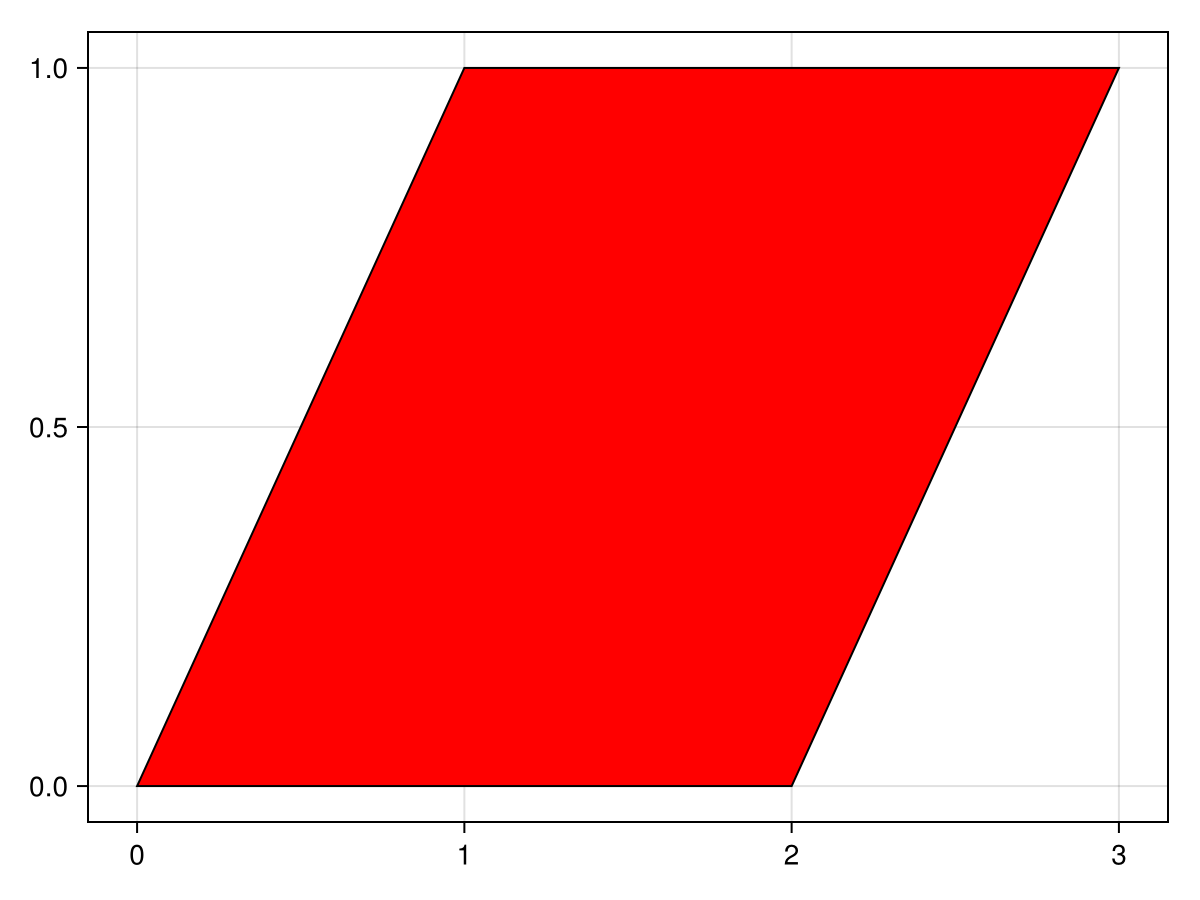
using CairoMakie
using Makie.GeometryBasics


f = Figure()
Axis(f[1, 1])

# polygon with hole
p = Polygon(
    Point2f[(0, 0), (2, 0), (3, 1), (1, 1)],
    [Point2f[(0.75, 0.25), (1.75, 0.25), (2.25, 0.75), (1.25, 0.75)]]
)

poly!(p, color = :blue)

f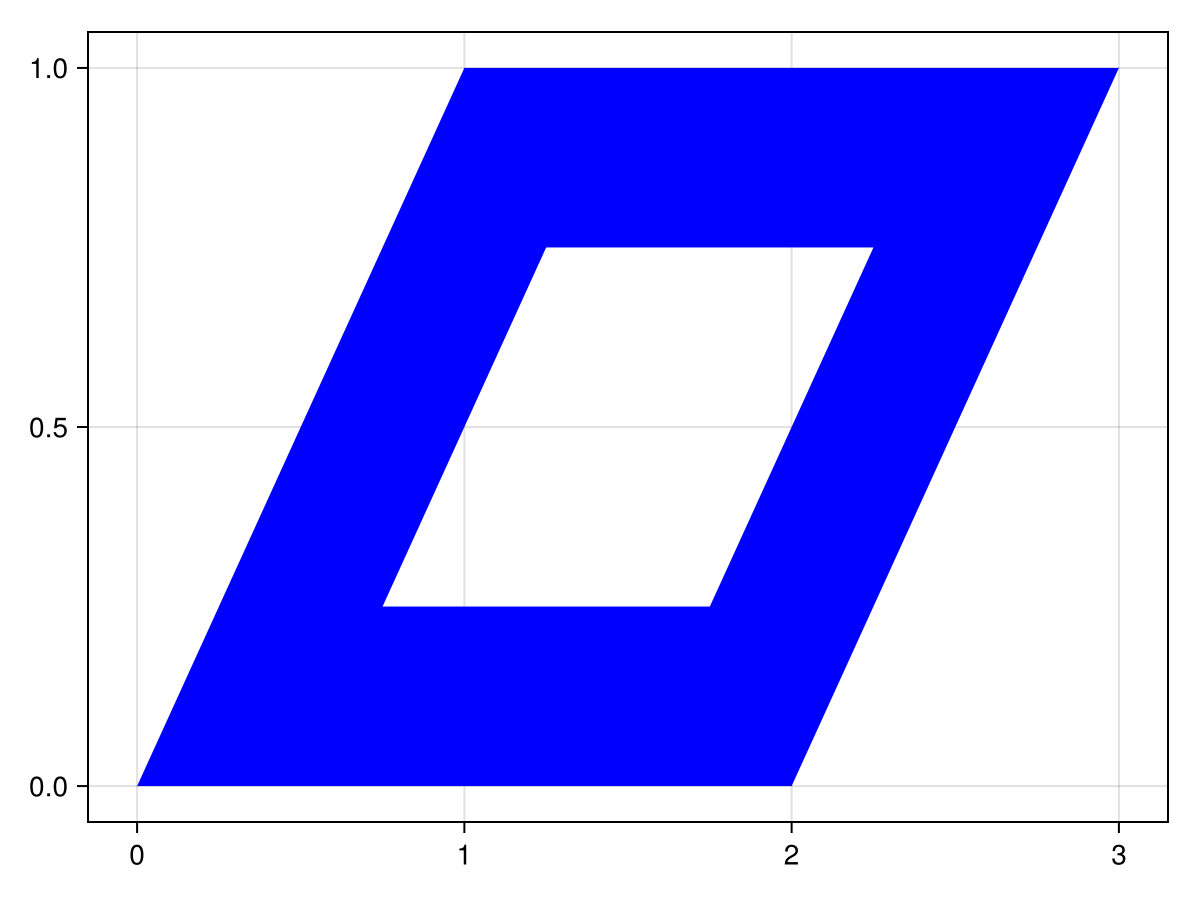
using CairoMakie
using Makie.GeometryBasics


f = Figure()
Axis(f[1, 1])

# vector of shapes
poly!(
    [Rect(i, j, 0.75, 0.5) for i in 1:5 for j in 1:3],
    color = 1:15,
    colormap = :heat
)

f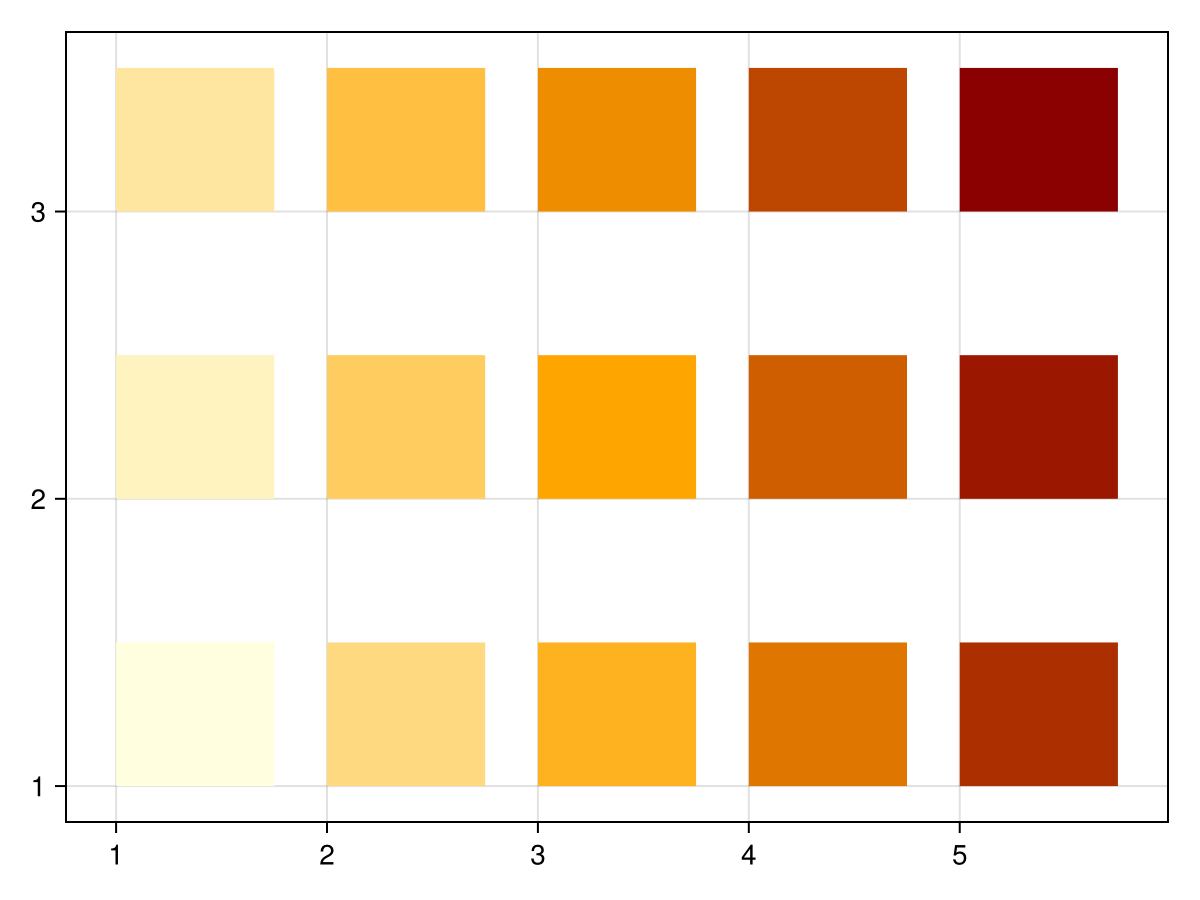
using CairoMakie
using Makie.GeometryBasics


f = Figure()
Axis(f[1, 1], aspect = DataAspect())

# shape decomposition
poly!(Circle(Point2f(0, 0), 15f0), color = :pink)

f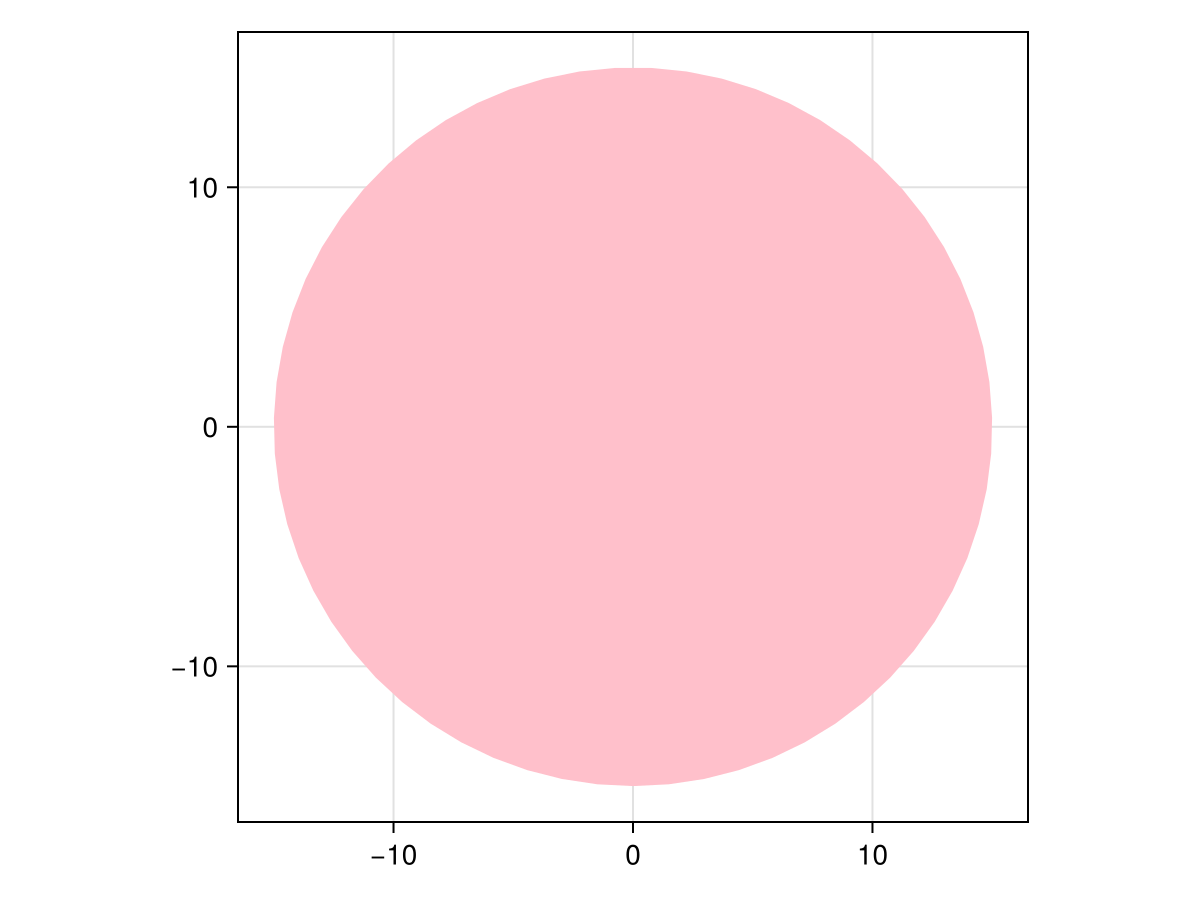
using CairoMakie
using Makie.GeometryBasics


f = Figure()
Axis(f[1, 1]; backgroundcolor = :gray15)

# vector of polygons
ps = [Polygon(rand(Point2f, 3) .+ Point2f(i, j))
    for i in 1:5 for j in 1:10]

poly!(ps, color = rand(RGBf, length(ps)))

f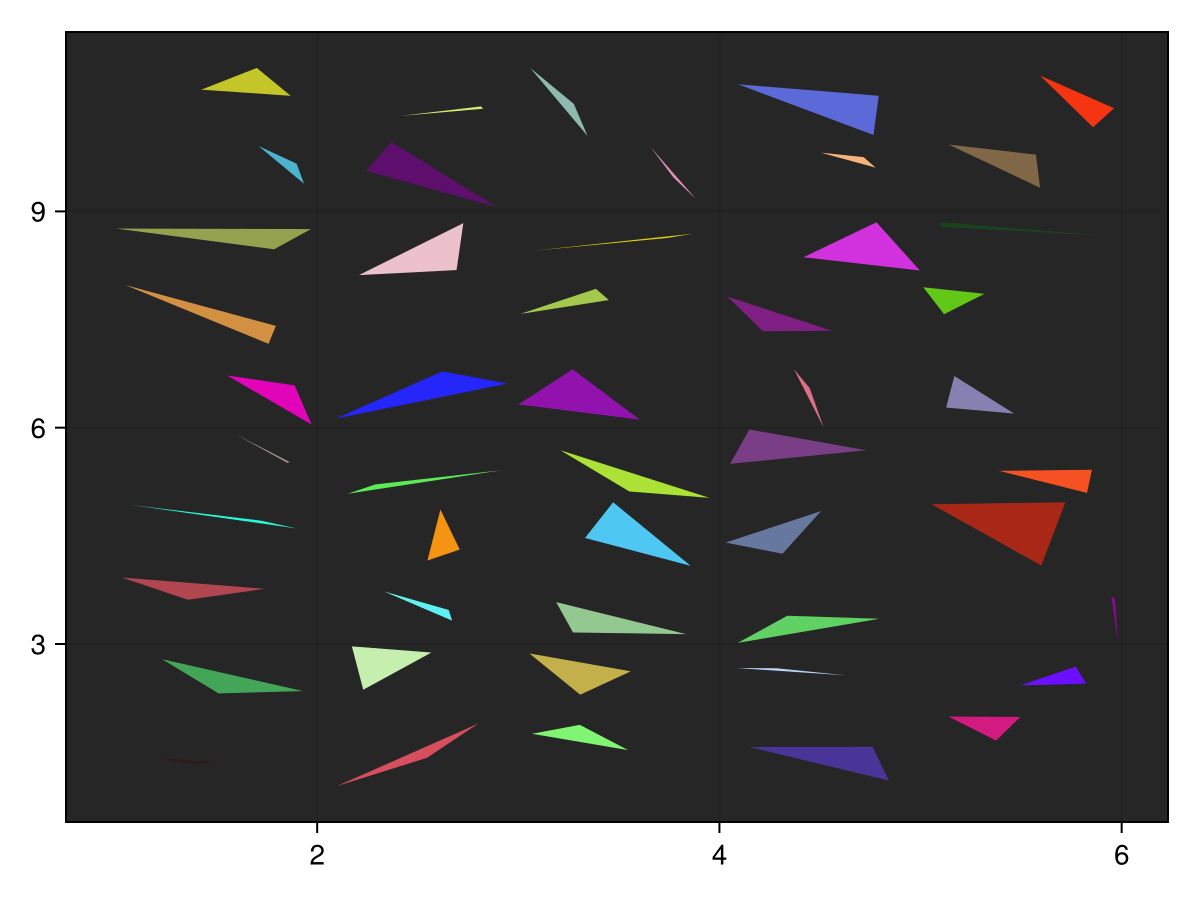
using CairoMakie
using Makie.GeometryBasics


f = Figure()
Axis(f[1, 1])

# vector of shapes
poly!(
    [Rect(i, j, 0.75, 0.5) for i in 1:5 for j in 1:3],
    color = :white,
    strokewidth = 2,
    strokecolor = 1:15,
    strokecolormap=:plasma,
)

f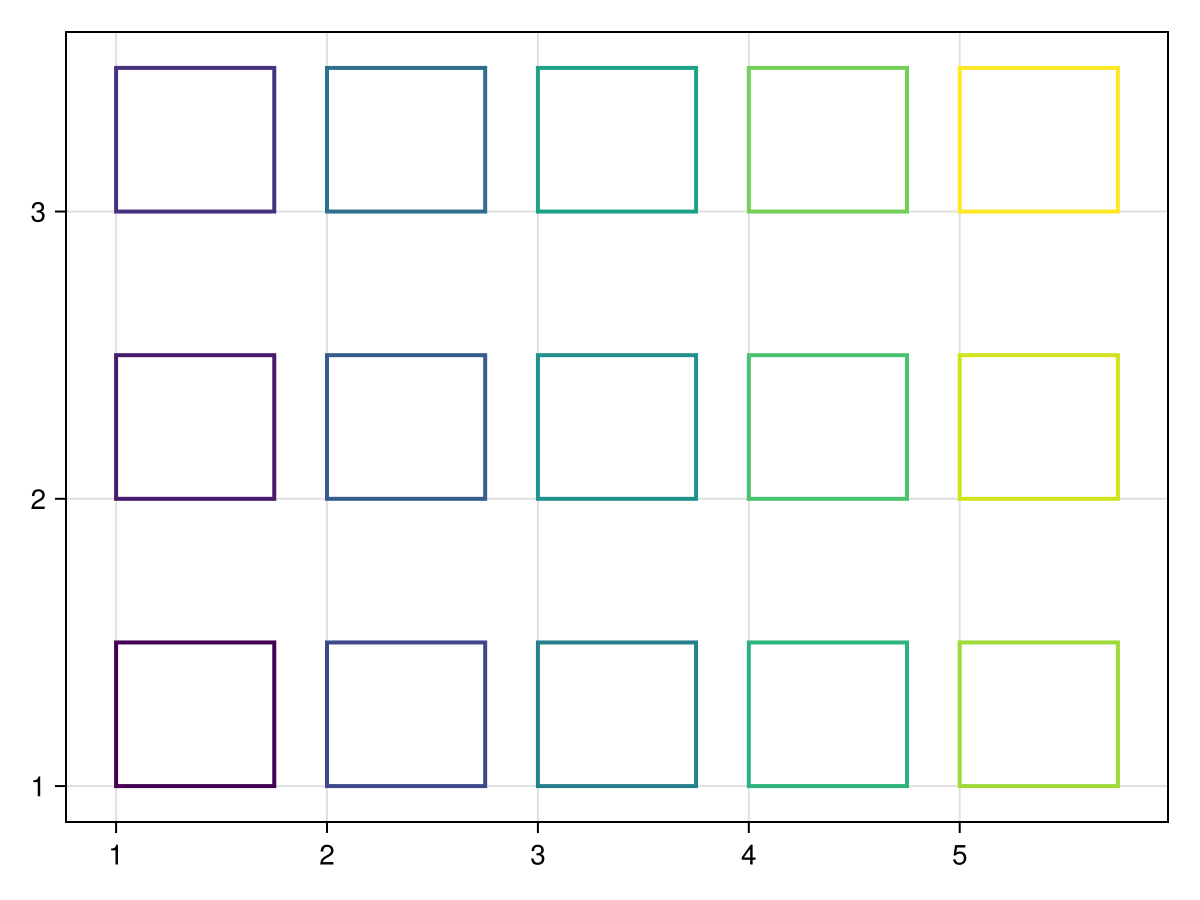
Attributes
alpha
Defaults to 1.0
The alpha value of the colormap or color attribute. Multiple alphas like in plot(alpha=0.2, color=(:red, 0.5), will get multiplied.
clip_planes
Defaults to automatic
Clip planes offer a way to do clipping in 3D space. You can set a Vector of up to 8 Plane3f planes here, behind which plots will be clipped (i.e. become invisible). By default clip planes are inherited from the parent plot or scene. You can remove parent clip_planes by passing Plane3f[].
color
Defaults to @inherit patchcolor
Sets the color of the poly. Can be a Vector{<:Colorant} for per vertex colors or a single Colorant. A Matrix{<:Colorant} can be used to color the mesh with a texture, which requires the mesh to contain texture coordinates. Vector or Matrices of numbers can be used as well, which will use the colormap arguments to map the numbers to colors. One can also use Makie.LinePattern, to cover the poly with a regular stroke pattern.
colormap
Defaults to @inherit colormap :viridis
Sets the colormap that is sampled for numeric colors. PlotUtils.cgrad(...), Makie.Reverse(any_colormap) can be used as well, or any symbol from ColorBrewer or PlotUtils. To see all available color gradients, you can call Makie.available_gradients().
colorrange
Defaults to automatic
The values representing the start and end points of colormap.
colorscale
Defaults to identity
The color transform function. Can be any function, but only works well together with Colorbar for identity, log, log2, log10, sqrt, logit, Makie.pseudolog10 and Makie.Symlog10.
cycle
Defaults to [:color => :patchcolor]
No docs available.
depth_shift
Defaults to 0.0
adjusts the depth value of a plot after all other transformations, i.e. in clip space, where 0 <= depth <= 1. This only applies to GLMakie and WGLMakie and can be used to adjust render order (like a tunable overdraw).
fxaa
Defaults to true
adjusts whether the plot is rendered with fxaa (anti-aliasing, GLMakie only).
highclip
Defaults to automatic
The color for any value above the colorrange.
inspectable
Defaults to true
sets whether this plot should be seen by DataInspector.
inspector_clear
Defaults to automatic
Sets a callback function (inspector, plot) -> ... for cleaning up custom indicators in DataInspector.
inspector_hover
Defaults to automatic
Sets a callback function (inspector, plot, index) -> ... which replaces the default show_data methods.
inspector_label
Defaults to automatic
Sets a callback function (plot, index, position) -> string which replaces the default label generated by DataInspector.
joinstyle
Defaults to @inherit joinstyle
No docs available.
linecap
Defaults to @inherit linecap
No docs available.
linestyle
Defaults to nothing
Sets the dash pattern of the line. Options are :solid (equivalent to nothing), :dot, :dash, :dashdot and :dashdotdot. These can also be given in a tuple with a gap style modifier, either :normal, :dense or :loose. For example, (:dot, :loose) or (:dashdot, :dense).
For custom patterns have a look at Makie.Linestyle.
lowclip
Defaults to automatic
The color for any value below the colorrange.
miter_limit
Defaults to @inherit miter_limit
No docs available.
model
Defaults to automatic
Sets a model matrix for the plot. This overrides adjustments made with translate!, rotate! and scale!.
nan_color
Defaults to :transparent
The color for NaN values.
overdraw
Defaults to false
Controls if the plot will draw over other plots. This specifically means ignoring depth checks in GL backends
shading
Defaults to NoShading
No docs available.
space
Defaults to :data
sets the transformation space for box encompassing the plot. See Makie.spaces() for possible inputs.
ssao
Defaults to false
Adjusts whether the plot is rendered with ssao (screen space ambient occlusion). Note that this only makes sense in 3D plots and is only applicable with fxaa = true.
stroke_depth_shift
Defaults to -1.0e-5
Depth shift of stroke plot. This is useful to avoid z-fighting between the stroke and the fill.
strokecolor
Defaults to @inherit patchstrokecolor
Sets the color of the outline around a marker.
strokecolormap
Defaults to @inherit colormap
Sets the colormap that is sampled for numeric colors.
strokewidth
Defaults to @inherit patchstrokewidth
Sets the width of the outline.
transformation
Defaults to automatic
No docs available.
transparency
Defaults to false
Adjusts how the plot deals with transparency. In GLMakie transparency = true results in using Order Independent Transparency.
visible
Defaults to true
Controls whether the plot will be rendered or not.