stephist
Makie.stephist Function
stephist(values)Plot a step histogram of values.
Plot type
The plot type alias for the stephist function is StepHist.
Examples
using GLMakie
data = randn(1000)

f = Figure()
stephist(f[1, 1], data, bins = 10)
stephist(f[1, 2], data, bins = 20, color = :red, linewidth = 3)
stephist(f[2, 1], data, bins = [-5, -2, -1, 0, 1, 2, 5], color = :gray)
stephist(f[2, 2], data, normalization = :pdf)
f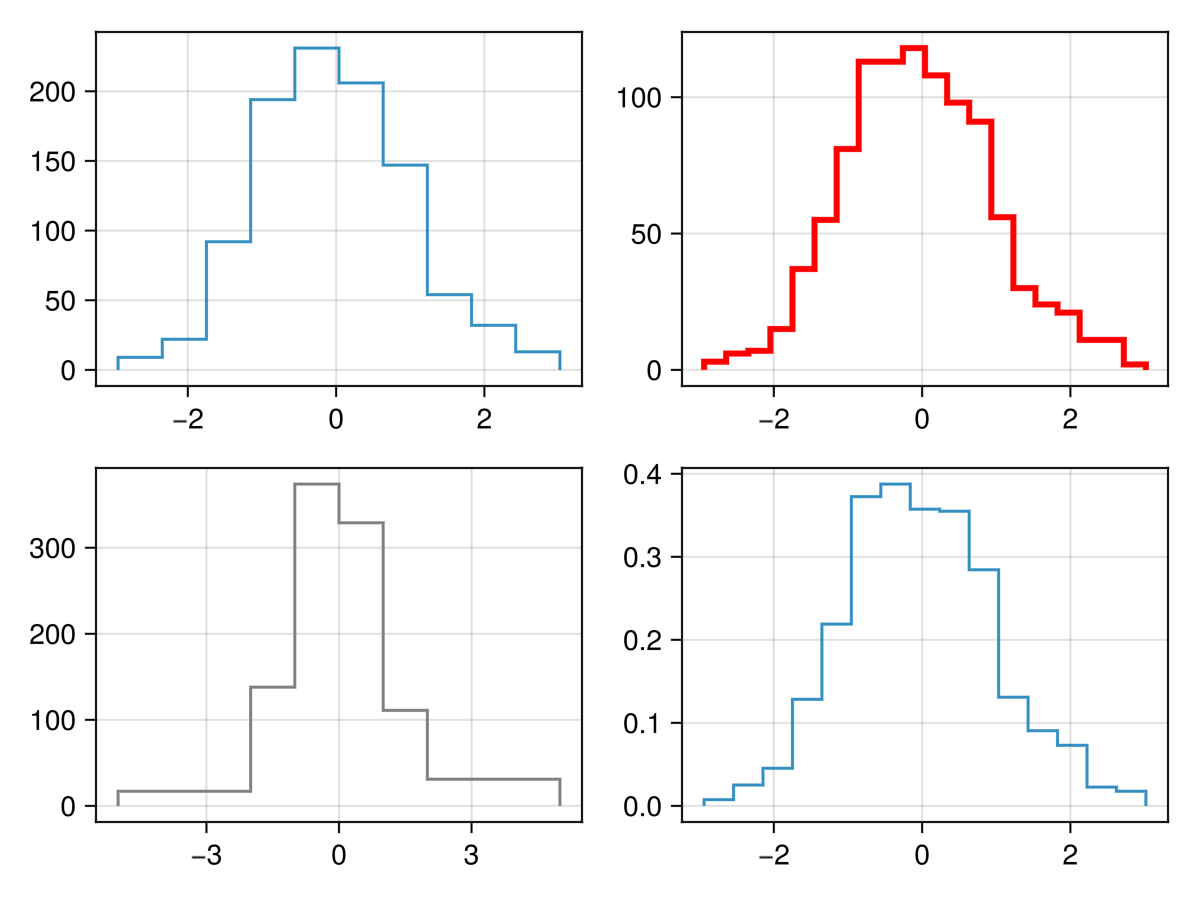
For more examples, see hist.
Attributes
bins
Defaults to 15
Can be an Int to create that number of equal-width bins over the range of values. Alternatively, it can be a sorted iterable of bin edges.
color
Defaults to @inherit patchcolor
No docs available.
cycle
Defaults to [:color => :patchcolor]
No docs available.
linestyle
Defaults to :solid
No docs available.
linewidth
Defaults to @inherit linewidth
No docs available.
normalization
Defaults to :none
Allows to apply a normalization to the histogram. Possible values are:
:pdf: Normalize by sum of weights and bin sizes. Resulting histogram
has norm 1 and represents a PDF.
:density: Normalize by bin sizes only. Resulting histogram represents
count density of input and does not have norm 1. Will not modify the histogram if it already represents a density (h.isdensity == 1).
:probability: Normalize by sum of weights only. Resulting histogram
represents the fraction of probability mass for each bin and does not have norm 1.
:none: Do not normalize.
scale_to
Defaults to nothing
Allows to scale all values to a certain height.
weights
Defaults to automatic
Allows to provide statistical weights.