hist
Makie.hist Function
hist(values)Plot a histogram of values.
Plot type
The plot type alias for the hist function is Hist.
Examples
using GLMakie
data = randn(1000)

f = Figure()
hist(f[1, 1], data, bins = 10)
hist(f[1, 2], data, bins = 20, color = :red, strokewidth = 1, strokecolor = :black)
hist(f[2, 1], data, bins = [-5, -2, -1, 0, 1, 2, 5], color = :gray)
hist(f[2, 2], data, normalization = :pdf)
f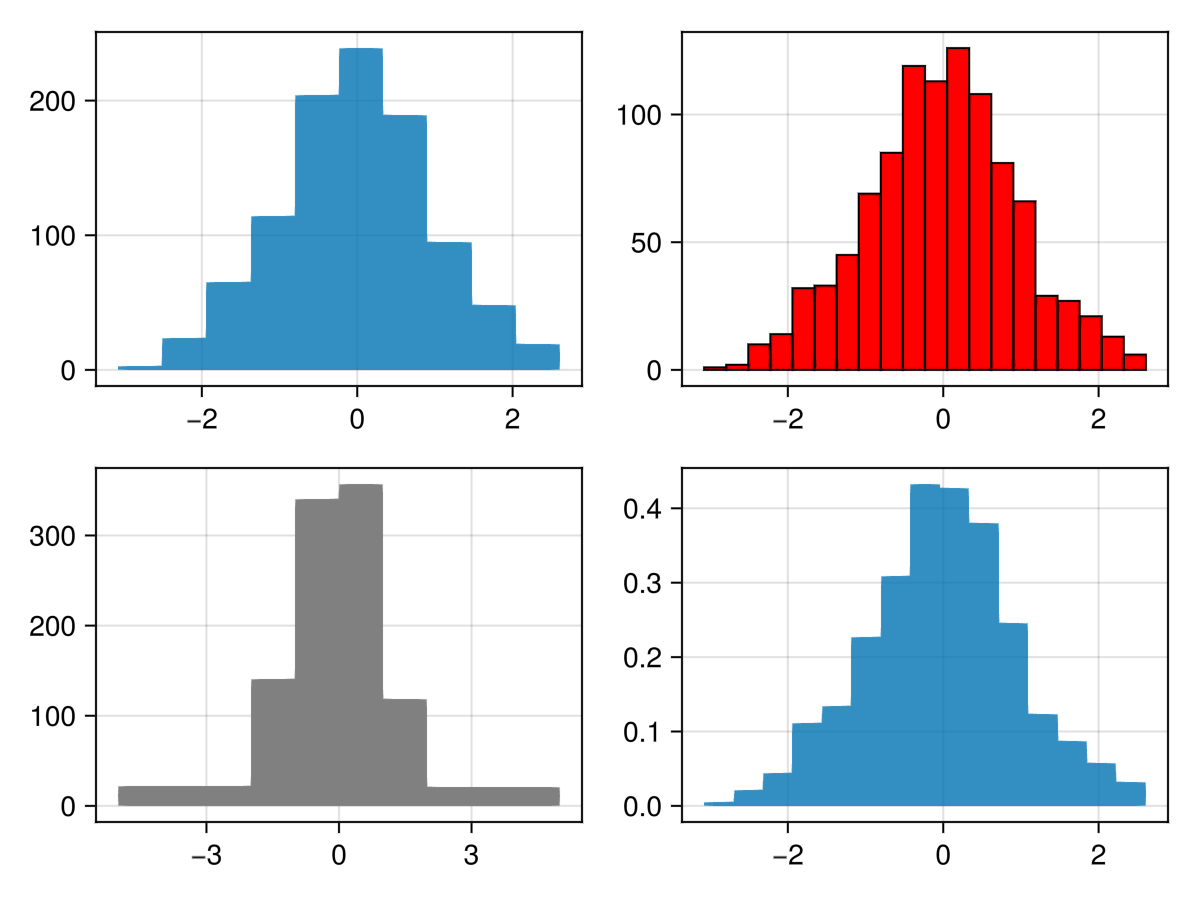
Histogram with labels
You can use all the same arguments as barplot:
using CairoMakie
data = randn(1000)

hist(data, normalization = :pdf, bar_labels = :values,
     label_formatter=x-> round(x, digits=2), label_size = 15,
     strokewidth = 0.5, strokecolor = (:black, 0.5), color = :values)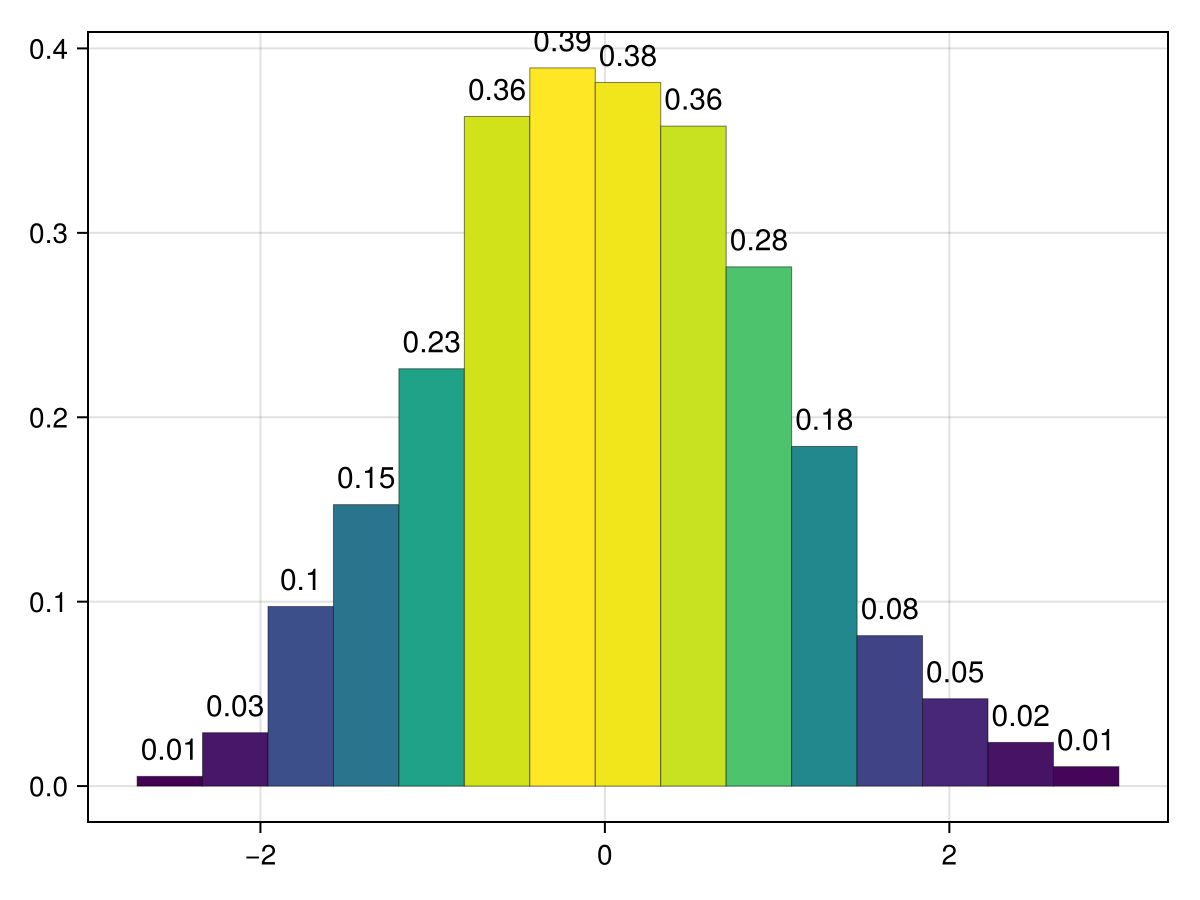
Moving histograms
With scale_to, and offset, one can put multiple histograms into the same plot. Note, that offset automatically sets fillto, to move the whole barplot. Also, one can use a negative scale_to amount to flip the histogram, or scale_to=:flip to flip the direction of the bars without changing their height.
using CairoMakie
fig = Figure()
ax = Axis(fig[1, 1])
for i in 1:5
     hist!(ax, randn(1000), scale_to=-0.6, offset=i, direction=:x)
end
fig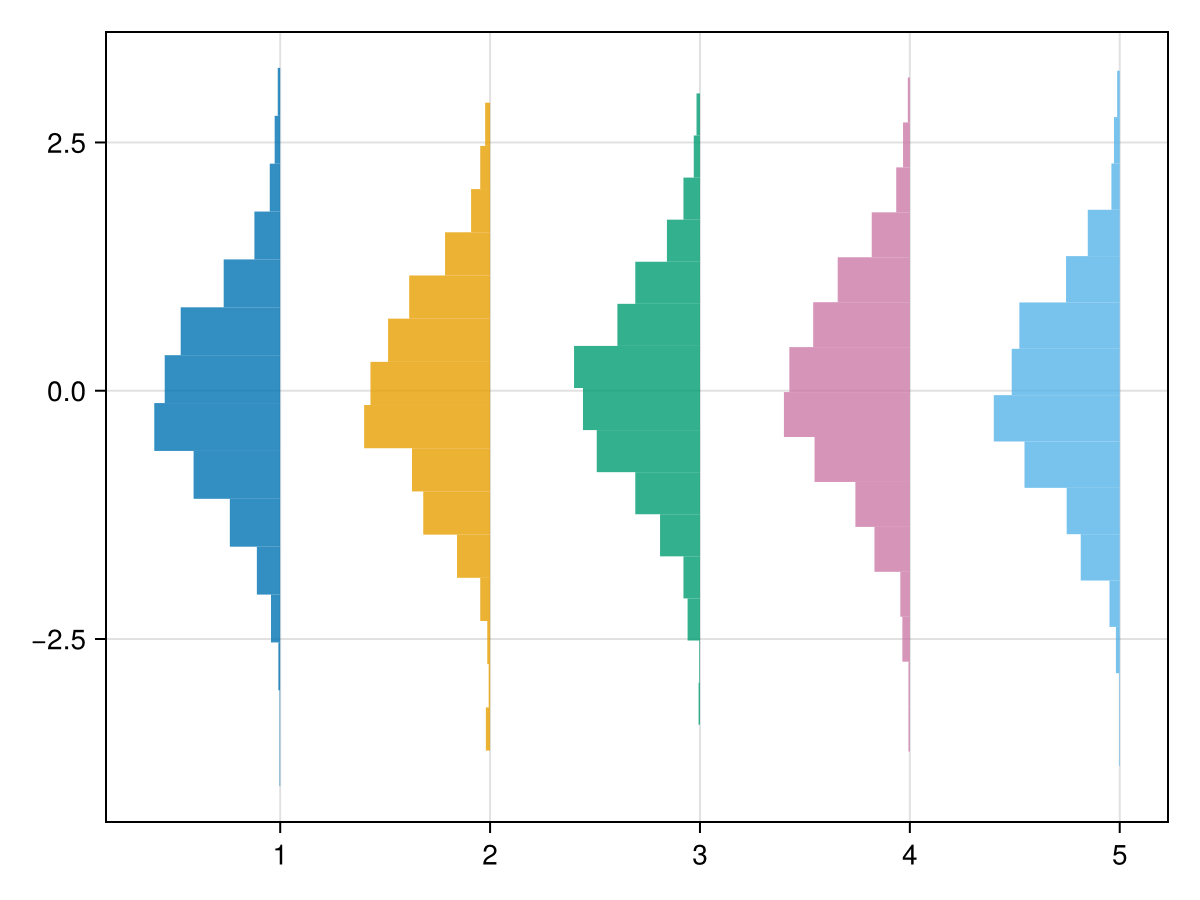
Using statistical weights
using CairoMakie
using Distributions


N = 100_000
x = rand(Uniform(-5, 5), N)

w = pdf.(Normal(), x)

fig = Figure()
hist(fig[1,1], x)
hist(fig[1,2], x, weights = w)

fig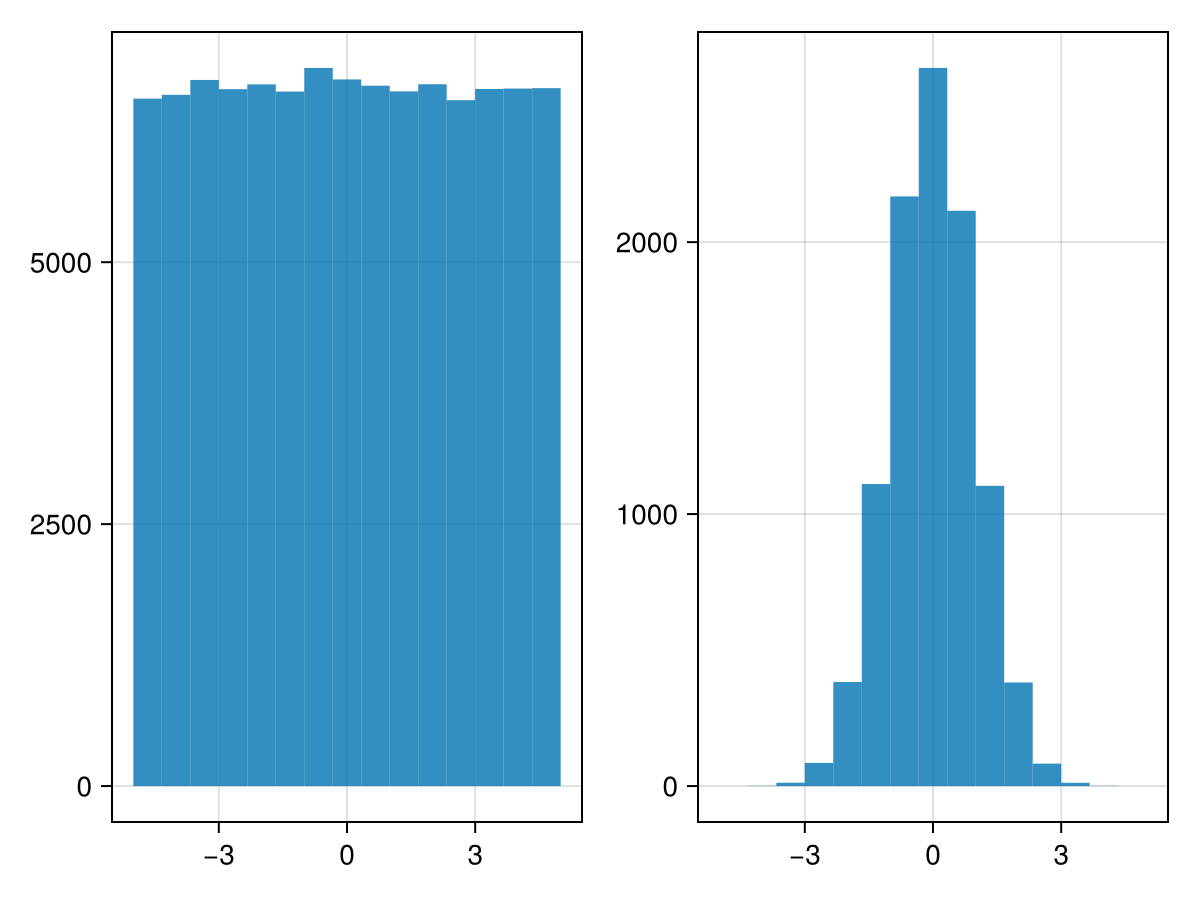
Attributes
bar_labels
Defaults to nothing
No docs available.
bins
Defaults to 15
Can be an Int to create that number of equal-width bins over the range of values. Alternatively, it can be a sorted iterable of bin edges.
color
Defaults to @inherit patchcolor
Color can either be:
a vector of
binscolorsa single color
:values, to color the bars with the values from the histogram
cycle
Defaults to [:color => :patchcolor]
No docs available.
direction
Defaults to :y
Set the direction of the bars.
fillto
Defaults to automatic
Defines where the bars start.
flip_labels_at
Defaults to Inf
No docs available.
gap
Defaults to 0
Gap between the bars (see barplot).
label_color
Defaults to @inherit textcolor
No docs available.
label_font
Defaults to @inherit font
No docs available.
label_formatter
Defaults to bar_label_formatter
No docs available.
label_offset
Defaults to 5
No docs available.
label_size
Defaults to 20
No docs available.
normalization
Defaults to :none
Allows to normalize the histogram. Possible values are:
:pdf: Normalize by sum of weights and bin sizes. Resulting histogram has norm 1 and represents a PDF.:density: Normalize by bin sizes only. Resulting histogram represents count density of input and does not have norm 1. Will not modify the histogram if it already represents a density (h.isdensity == 1).:probability: Normalize by sum of weights only. Resulting histogram represents the fraction of probability mass for each bin and does not have norm 1.:none: Do not normalize.
offset
Defaults to 0.0
Adds an offset to every value.
over_background_color
Defaults to automatic
No docs available.
over_bar_color
Defaults to automatic
No docs available.
scale_to
Defaults to nothing
Allows to scale all values to a certain height. This can also be set to :flip to flip the direction of histogram bars without scaling them to a common height.
strokecolor
Defaults to @inherit patchstrokecolor
No docs available.
strokewidth
Defaults to @inherit patchstrokewidth
No docs available.
weights
Defaults to automatic
Allows to statistically weight the observations.