arrows
MakieCore.arrows Function
arrows(points, directions; kwargs...)
arrows(x, y, u, v)
arrows(x::AbstractVector, y::AbstractVector, u::AbstractMatrix, v::AbstractMatrix)
arrows(x, y, z, u, v, w)
arrows(x, y, [z], f::Function)
Plots arrows at the specified points with the specified components. u and v are interpreted as vector components (u being the x and v being the y), and the vectors are plotted with the tails at x, y.
If x, y, u, v are <: AbstractVector, then each 'row' is plotted as a single vector.
If u, v are <: AbstractMatrix, then x and y are interpreted as specifications for a grid, and u, v are plotted as arrows along the grid.
arrows can also work in three dimensions.
If a Function is provided in place of u, v, [w], then it must accept a Point as input, and return an appropriately dimensioned Point, Vec, or other array-like output.
Plot type
The plot type alias for the arrows function is Arrows.
Examples
using CairoMakie
f = Figure(size = (800, 800))
Axis(f[1, 1], backgroundcolor = "black")

xs = LinRange(0, 2pi, 20)
ys = LinRange(0, 3pi, 20)
us = [sin(x) * cos(y) for x in xs, y in ys]
vs = [-cos(x) * sin(y) for x in xs, y in ys]
strength = vec(sqrt.(us .^ 2 .+ vs .^ 2))

arrows!(xs, ys, us, vs, arrowsize = 10, lengthscale = 0.3,
    arrowcolor = strength, linecolor = strength)

f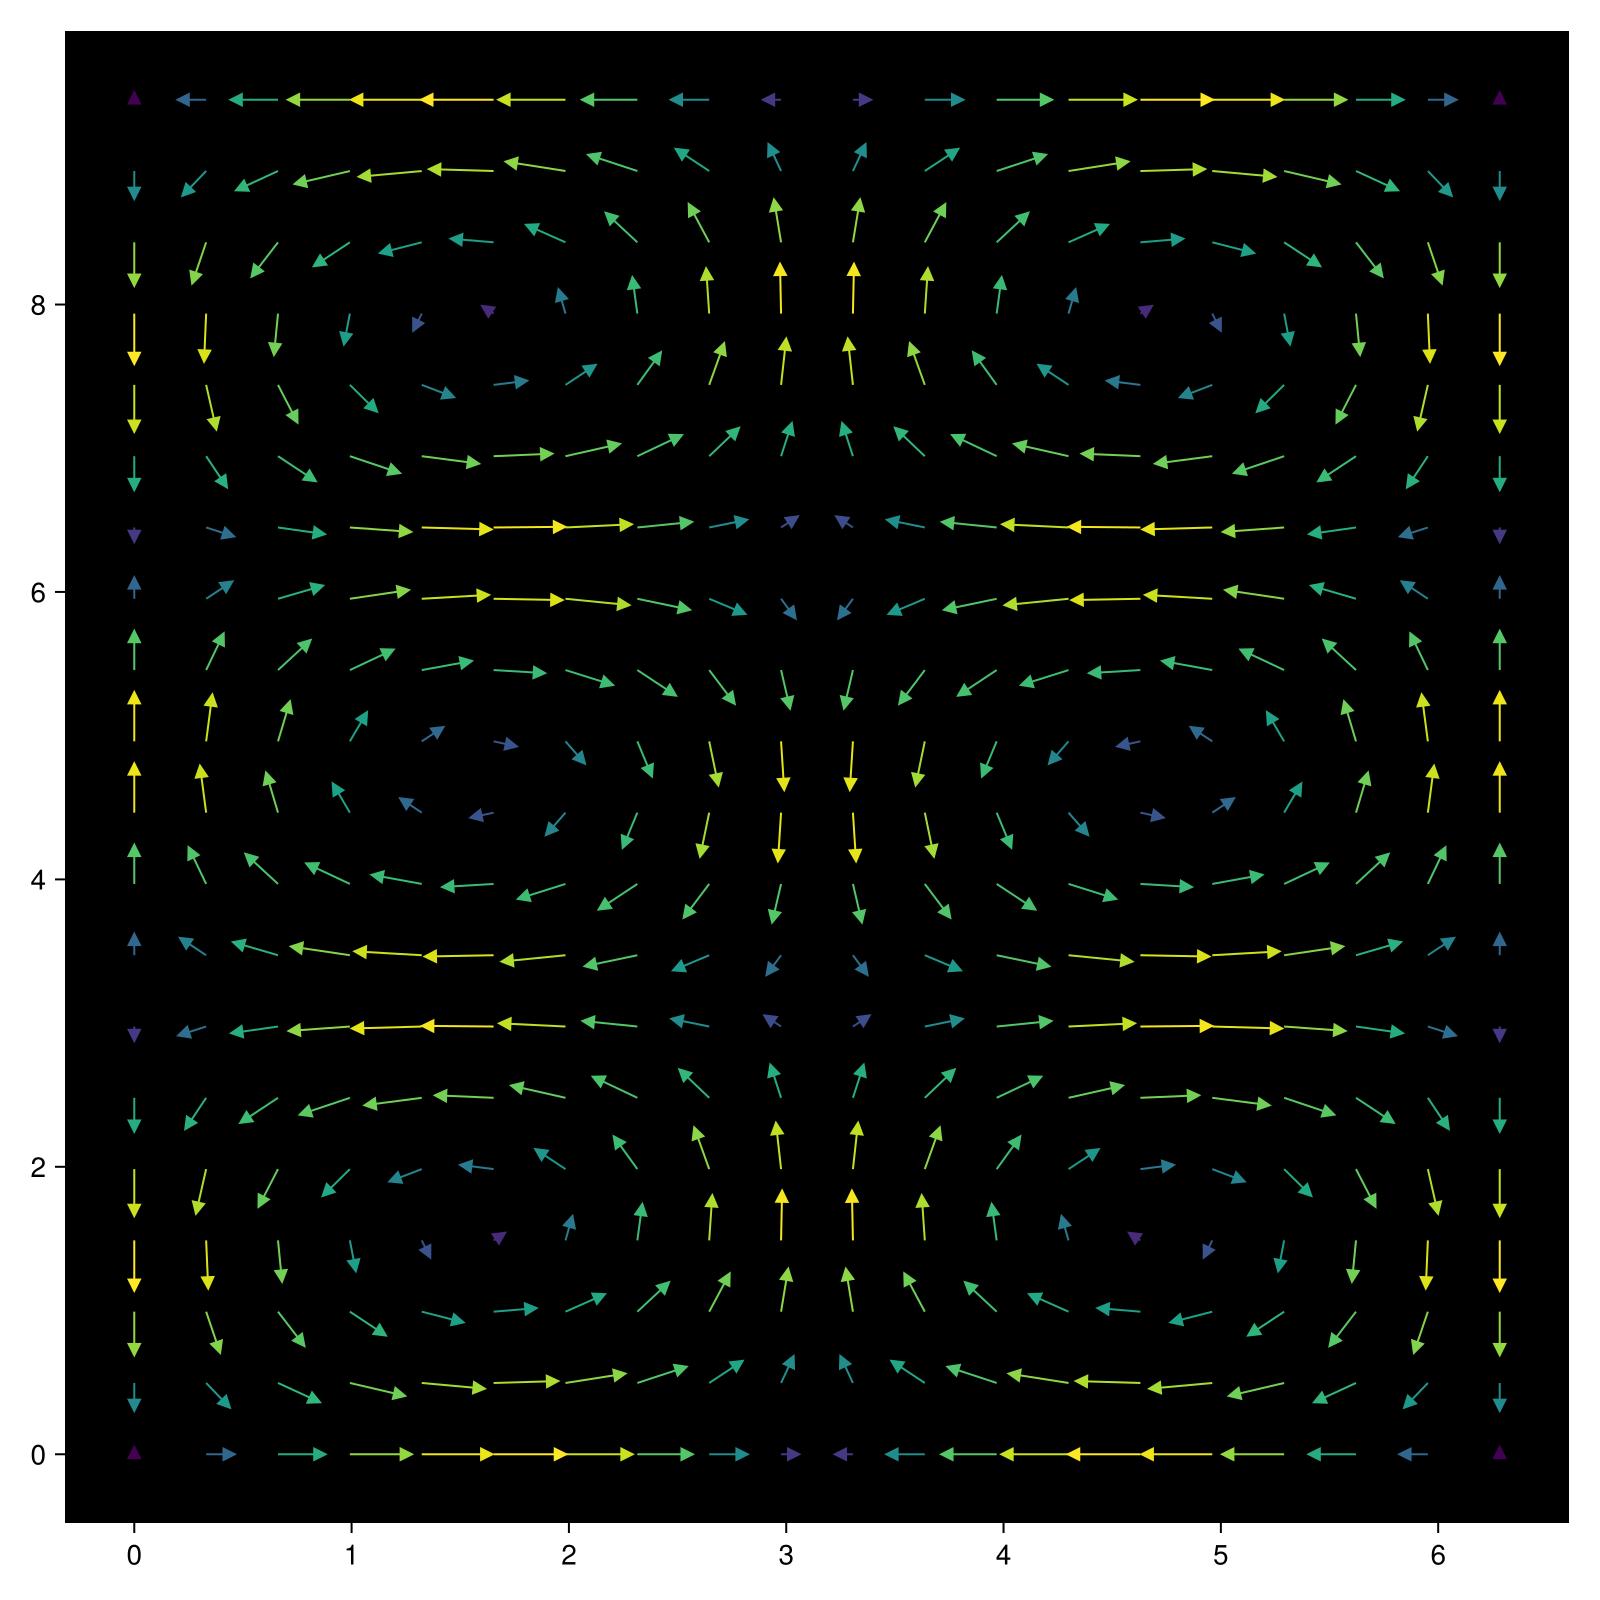
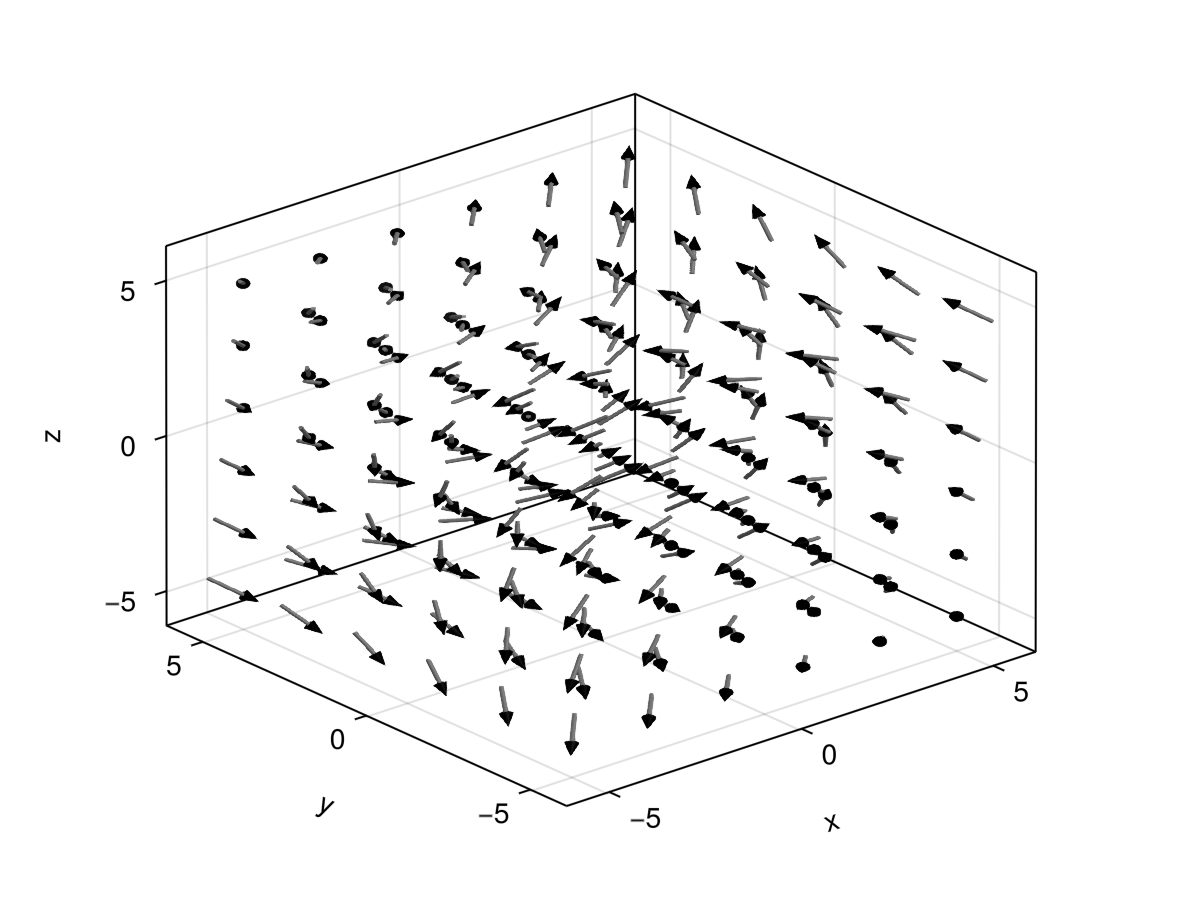
using GLMakie
ps = [Point3f(x, y, z) for x in -5:2:5 for y in -5:2:5 for z in -5:2:5]
ns = map(p -> 0.1 * Vec3f(p[2], p[3], p[1]), ps)
arrows(
    ps, ns, fxaa=true, # turn on anti-aliasing
    linecolor = :gray, arrowcolor = :black,
    linewidth = 0.1, arrowsize = Vec3f(0.3, 0.3, 0.4),
    align = :center, axis=(type=Axis3,)
)
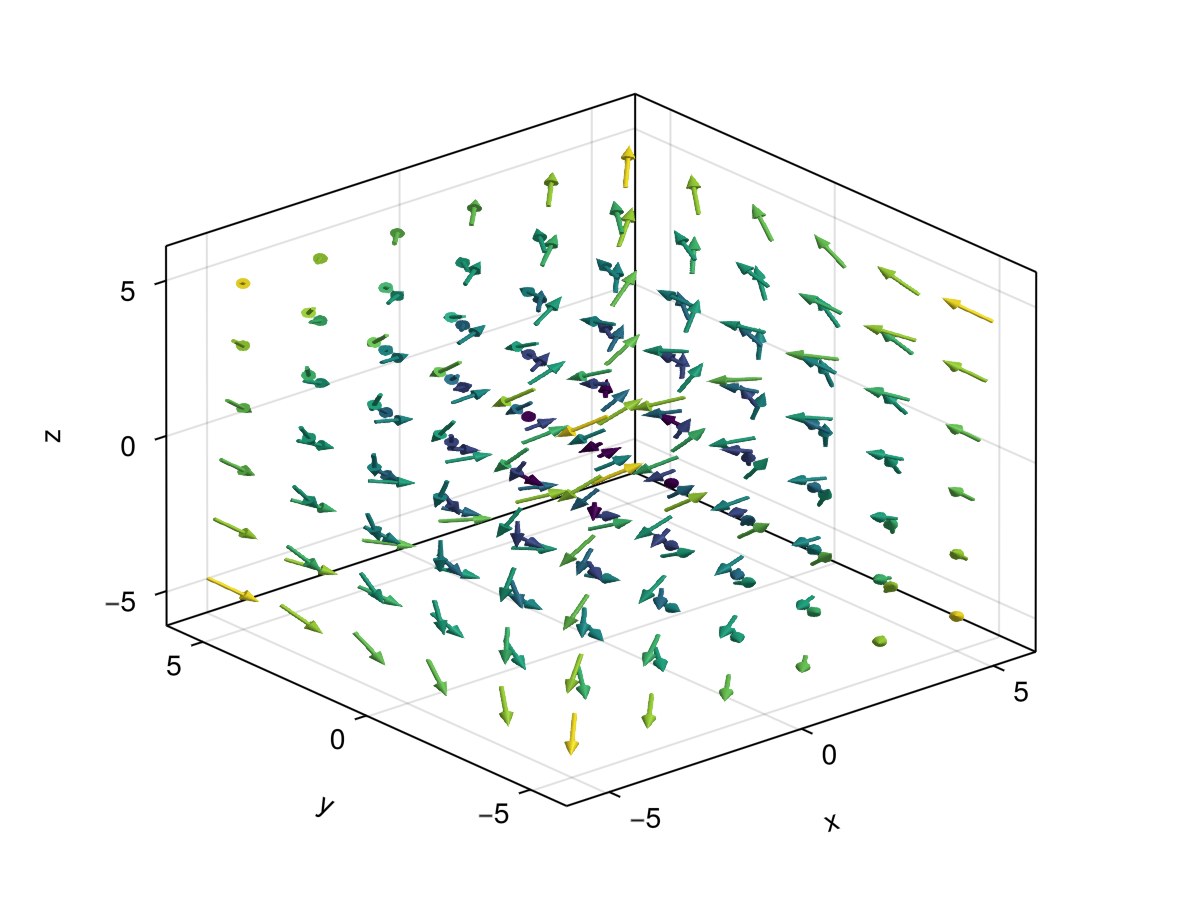
using GLMakie
using LinearAlgebra

ps = [Point3f(x, y, z) for x in -5:2:5 for y in -5:2:5 for z in -5:2:5]
ns = map(p -> 0.1 * Vec3f(p[2], p[3], p[1]), ps)
lengths = norm.(ns)
arrows(
    ps, ns, fxaa=true, # turn on anti-aliasing
    color=lengths,
    linewidth = 0.1, arrowsize = Vec3f(0.3, 0.3, 0.4),
    align = :center, axis=(type=Axis3,)
)
arrows can also take a function f(x::Point{N})::Point{N} which returns the arrow vector when given the arrow's origin.
using CairoMakie
fig = Figure(size = (800, 800))
ax = Axis(fig[1, 1], backgroundcolor = "black")
xs = LinRange(0, 2pi, 20)
ys = LinRange(0, 3pi, 20)
# explicit method
us = [sin(x) * cos(y) for x in xs, y in ys]
vs = [-cos(x) * sin(y) for x in xs, y in ys]
strength = vec(sqrt.(us .^ 2 .+ vs .^ 2))
# function method
arrow_fun(x) = Point2f(sin(x[1])*cos(x[2]), -cos(x[1])*sin(x[2]))
arrows!(ax, xs, ys, arrow_fun, arrowsize = 10, lengthscale = 0.3,
    arrowcolor = strength, linecolor = strength)
fig
Attributes
align
Defaults to :origin
Sets how arrows are positioned. By default arrows start at the given positions and extend along the given directions. If this attribute is set to :head, :lineend, :tailend, :headstart or :center the given positions will be between the head and tail of each arrow instead.
alpha
Defaults to 1.0
The alpha value of the colormap or color attribute. Multiple alphas like in plot(alpha=0.2, color=(:red, 0.5), will get multiplied.
arrowcolor
Defaults to automatic
Sets the color of the arrow head. Will copy color if set to automatic.
arrowhead
Defaults to automatic
Defines the marker (2D) or mesh (3D) that is used as the arrow head. The default for is '▲' in 2D and a cone mesh in 3D. For the latter the mesh should start at Point3f(0) and point in positive z-direction.
arrowsize
Defaults to automatic
Scales the size of the arrow head. This defaults to 0.3 in the 2D case and Vec3f(0.2, 0.2, 0.3) in the 3D case. For the latter the first two components scale the radius (in x/y direction) and the last scales the length of the cone. If the arrowsize is set to 1, the cone will have a diameter and length of 1.
arrowtail
Defaults to automatic
Defines the mesh used to draw the arrow tail in 3D. It should start at Point3f(0) and extend in negative z-direction. The default is a cylinder. This has no effect on the 2D plot.
backlight
Defaults to 0.0
Sets a weight for secondary light calculation with inverted normals.
clip_planes
Defaults to automatic
Clip planes offer a way to do clipping in 3D space. You can set a Vector of up to 8 Plane3f planes here, behind which plots will be clipped (i.e. become invisible). By default clip planes are inherited from the parent plot or scene. You can remove parent clip_planes by passing Plane3f[].
color
Defaults to :black
Sets the color of arrowheads and lines. Can be overridden separately using linecolor and arrowcolor.
colormap
Defaults to @inherit colormap :viridis
Sets the colormap that is sampled for numeric colors. PlotUtils.cgrad(...), Makie.Reverse(any_colormap) can be used as well, or any symbol from ColorBrewer or PlotUtils. To see all available color gradients, you can call Makie.available_gradients().
colorrange
Defaults to automatic
The values representing the start and end points of colormap.
colorscale
Defaults to identity
The color transform function. Can be any function, but only works well together with Colorbar for identity, log, log2, log10, sqrt, logit, Makie.pseudolog10 and Makie.Symlog10.
depth_shift
Defaults to 0.0
adjusts the depth value of a plot after all other transformations, i.e. in clip space, where 0 <= depth <= 1. This only applies to GLMakie and WGLMakie and can be used to adjust render order (like a tunable overdraw).
diffuse
Defaults to 1.0
Sets how strongly the red, green and blue channel react to diffuse (scattered) light.
fxaa
Defaults to automatic
adjusts whether the plot is rendered with fxaa (anti-aliasing, GLMakie only).
highclip
Defaults to automatic
The color for any value above the colorrange.
inspectable
Defaults to true
sets whether this plot should be seen by DataInspector.
inspector_clear
Defaults to automatic
Sets a callback function (inspector, plot) -> ... for cleaning up custom indicators in DataInspector.
inspector_hover
Defaults to automatic
Sets a callback function (inspector, plot, index) -> ... which replaces the default show_data methods.
inspector_label
Defaults to automatic
Sets a callback function (plot, index, position) -> string which replaces the default label generated by DataInspector.
lengthscale
Defaults to 1.0
Scales the length of the arrow tail.
linecolor
Defaults to automatic
Sets the color used for the arrow tail which is represented by a line in 2D. Will copy color if set to automatic.
linestyle
Defaults to nothing
Sets the linestyle used in 2D. Does not apply to 3D plots.
linewidth
Defaults to automatic
Scales the width/diameter of the arrow tail. Defaults to 1 for 2D and 0.05 for the 3D case.
lowclip
Defaults to automatic
The color for any value below the colorrange.
markerspace
Defaults to :pixel
No docs available.
material
Defaults to nothing
RPRMakie only attribute to set complex RadeonProRender materials. Warning, how to set an RPR material may change and other backends will ignore this attribute
model
Defaults to automatic
Sets a model matrix for the plot. This overrides adjustments made with translate!, rotate! and scale!.
nan_color
Defaults to :transparent
The color for NaN values.
normalize
Defaults to false
By default the lengths of the directions given to arrows are used to scale the length of the arrow tails. If this attribute is set to true the directions are normalized, skipping this scaling.
overdraw
Defaults to false
Controls if the plot will draw over other plots. This specifically means ignoring depth checks in GL backends
quality
Defaults to 32
Defines the number of angle subdivisions used when generating the arrow head and tail meshes. Consider lowering this if you have performance issues. Only applies to 3D plots.
shading
Defaults to automatic
Sets the lighting algorithm used. Options are NoShading (no lighting), FastShading (AmbientLight + PointLight) or MultiLightShading (Multiple lights, GLMakie only). Note that this does not affect RPRMakie.
shininess
Defaults to 32.0
Sets how sharp the reflection is.
space
Defaults to :data
sets the transformation space for box encompassing the plot. See Makie.spaces() for possible inputs.
specular
Defaults to 0.2
Sets how strongly the object reflects light in the red, green and blue channels.
ssao
Defaults to false
Adjusts whether the plot is rendered with ssao (screen space ambient occlusion). Note that this only makes sense in 3D plots and is only applicable with fxaa = true.
transformation
Defaults to automatic
No docs available.
transparency
Defaults to false
Adjusts how the plot deals with transparency. In GLMakie transparency = true results in using Order Independent Transparency.
visible
Defaults to true
Controls whether the plot will be rendered or not.