rainclouds
Makie.rainclouds Function
rainclouds!(ax, category_labels, data_array; plot_boxplots=true, plot_clouds=true, kwargs...)Plot a violin (/histogram), boxplot and individual data points with appropriate spacing between each.
Arguments
ax: Axis used to place all these plots onto.category_labels: TypicallyVector{String}with a label for each element indata_arraydata_array: TypicallyVector{Float64}used for to represent the datapoints to plot.
Keywords
Plot type
The plot type alias for the rainclouds function is RainClouds.
"Raincloud" plots are a combination of a (half) violin plot, box plot and scatter plots. The three together can make an appealing and informative visual, particularly for large N datasets.
using CairoMakie
using Random
using Makie: rand_localized

####
#### Below is used for testing the plotting functionality.
####

function mockup_distribution(N)
    all_possible_labels = ["Single Mode", "Double Mode", "Random Exp", "Uniform"]
    category_type = rand(all_possible_labels)

    if category_type == "Single Mode"
        random_mean = rand_localized(0, 8)
        random_spread_coef = rand_localized(0.3, 1)
        data_points = random_spread_coef*randn(N) .+ random_mean

    elseif category_type == "Double Mode"
        random_mean = rand_localized(0, 8)
        random_spread_coef = rand_localized(0.3, 1)
        data_points = random_spread_coef*randn(Int(round(N/2.0))) .+ random_mean

        random_mean = rand_localized(0, 8)
        random_spread_coef = rand_localized(0.3, 1)
        data_points = vcat(data_points, random_spread_coef*randn(Int(round(N/2.0))) .+ random_mean)

    elseif category_type == "Random Exp"
        data_points = randexp(N)

    elseif category_type == "Uniform"
        min = rand_localized(0, 4)
        max = min + rand_localized(0.5, 4)
        data_points = [rand_localized(min, max) for _ in 1:N]

    else
        error("Unidentified category.")
    end

    return data_points
end

function mockup_categories_and_data_array(num_categories; N = 500)
    category_labels = String[]
    data_array = Float64[]

    for category_label in string.(('A':'Z')[1:min(num_categories, end)])
        data_points = mockup_distribution(N)

        append!(category_labels, fill(category_label, N))
        append!(data_array, data_points)
    end
    return category_labels, data_array
end

category_labels, data_array = mockup_categories_and_data_array(3)

colors = Makie.wong_colors()
rainclouds(category_labels, data_array;
    axis = (; xlabel = "Categories of Distributions", ylabel = "Samples", title = "My Title"),
    plot_boxplots = false, cloud_width=0.5, clouds=hist, hist_bins=50,
    color = colors[indexin(category_labels, unique(category_labels))])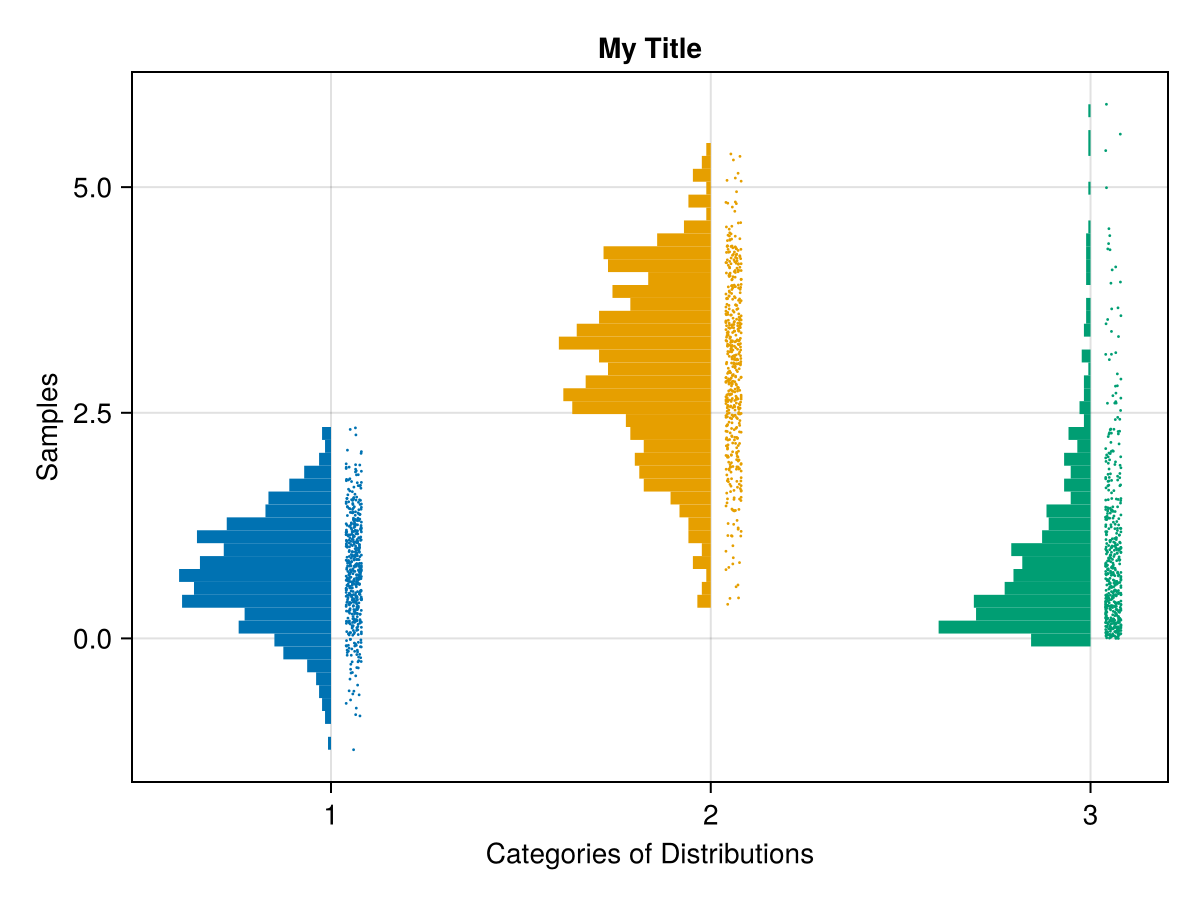
rainclouds(category_labels, data_array;
    axis = (; ylabel = "Categories of Distributions",
    xlabel = "Samples", title = "My Title"),
    orientation = :horizontal,
    plot_boxplots = true, cloud_width=0.5, clouds=hist,
    color = colors[indexin(category_labels, unique(category_labels))])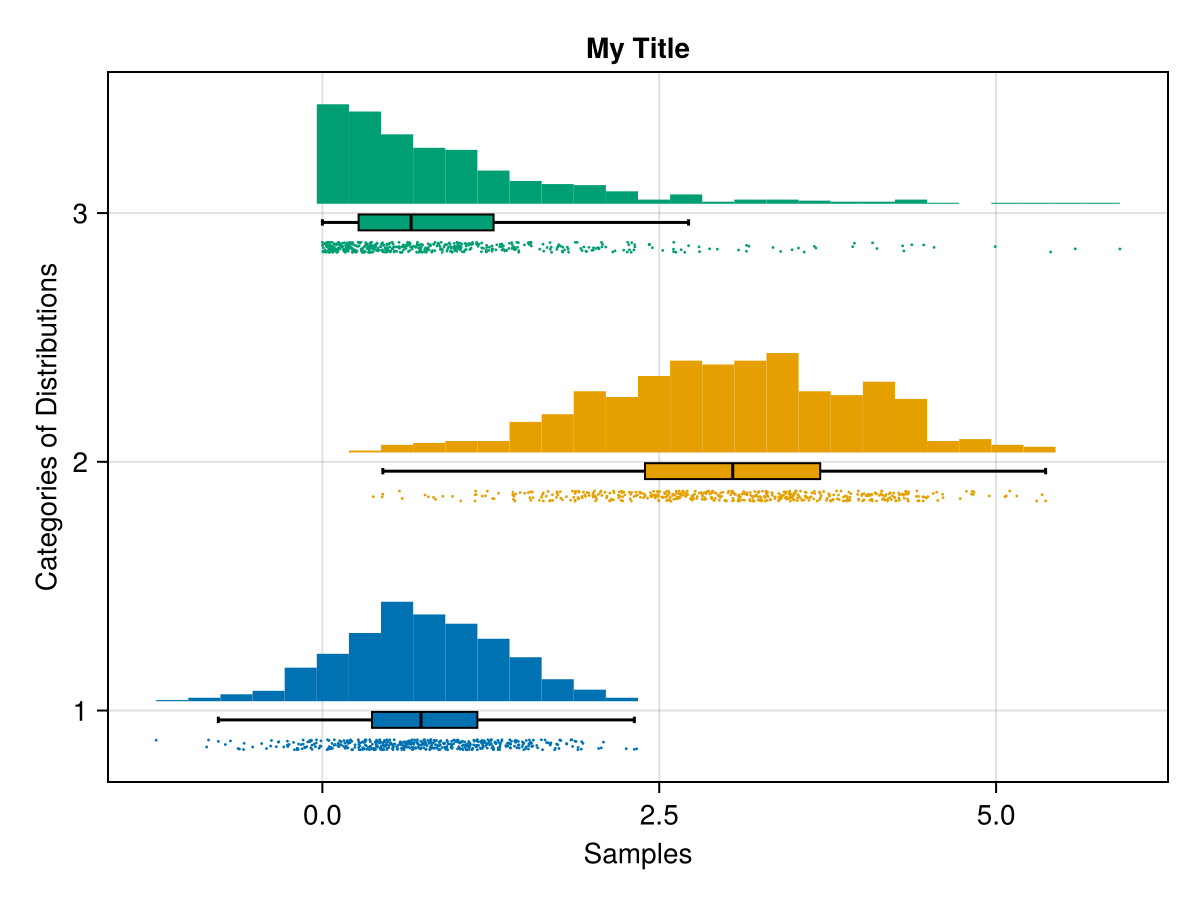
rainclouds(category_labels, data_array;
    axis = (;
        xlabel = "Categories of Distributions",
        ylabel = "Samples",
        title = "My Title"
    ),
    plot_boxplots = true, cloud_width=0.5, clouds=hist,
    color = colors[indexin(category_labels, unique(category_labels))])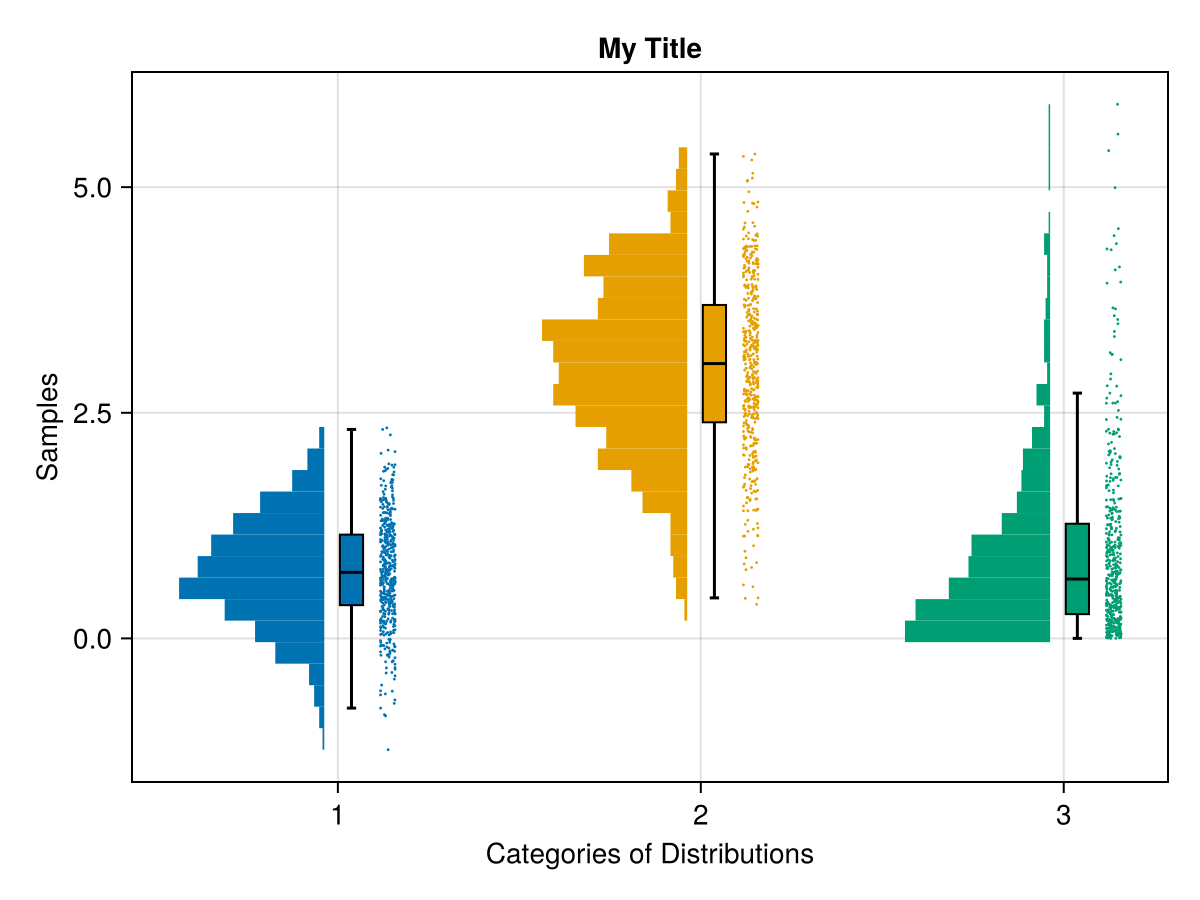
rainclouds(category_labels, data_array;
    axis = (;
        xlabel = "Categories of Distributions",
        ylabel = "Samples",
        title = "My Title"
    ),
    plot_boxplots = true, cloud_width=0.5, side = :right,
    violin_limits = extrema, color = colors[indexin(category_labels, unique(category_labels))])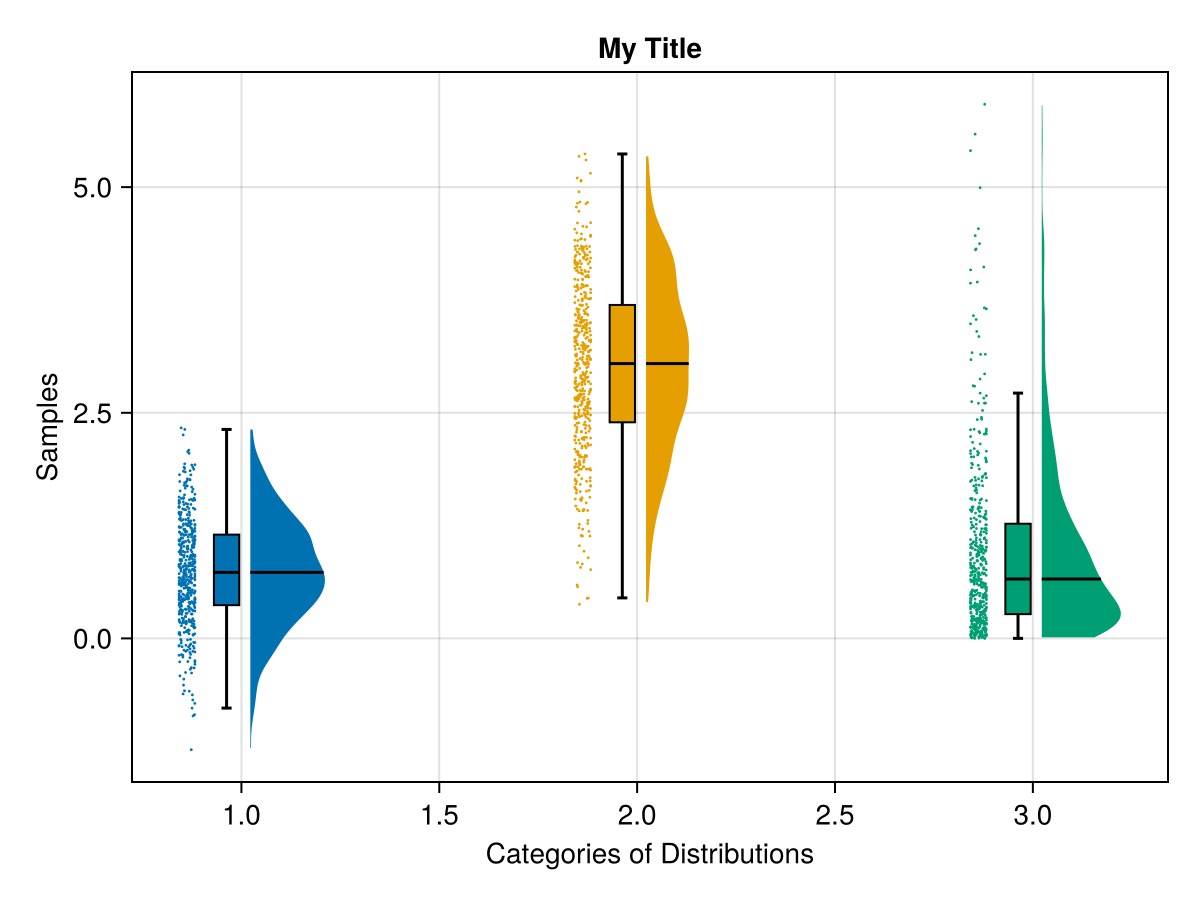
rainclouds(category_labels, data_array;
    axis = (;
        xlabel = "Categories of Distributions",
        ylabel = "Samples",
        title = "My Title",
    ),
    plot_boxplots = true, cloud_width=0.5, side = :right,
    color = colors[indexin(category_labels, unique(category_labels))])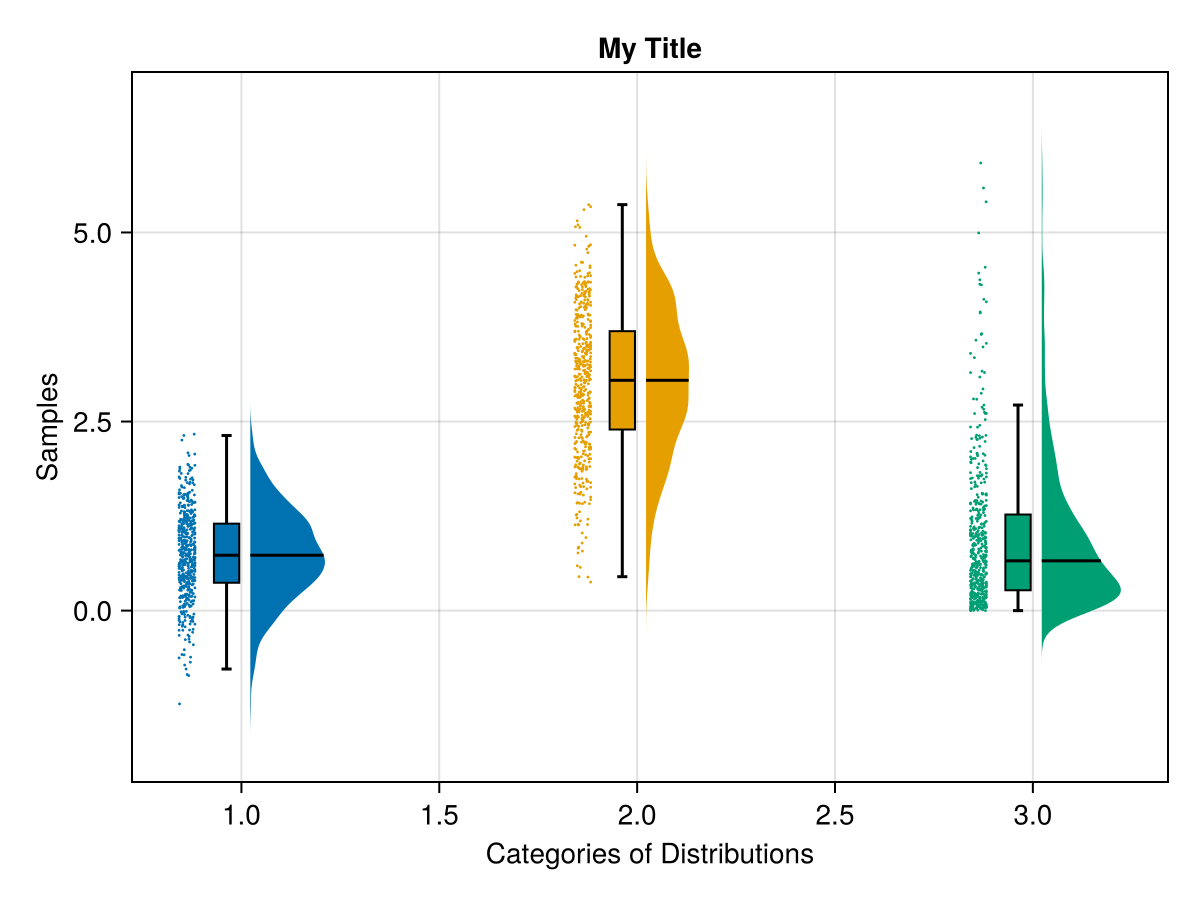
more_category_labels, more_data_array = mockup_categories_and_data_array(6)

rainclouds(more_category_labels, more_data_array;
    axis = (;
        xlabel = "Categories of Distributions",
        ylabel = "Samples",
        title = "My Title",
    ),
    plot_boxplots = true, cloud_width=0.5,
    color = colors[indexin(more_category_labels, unique(more_category_labels))])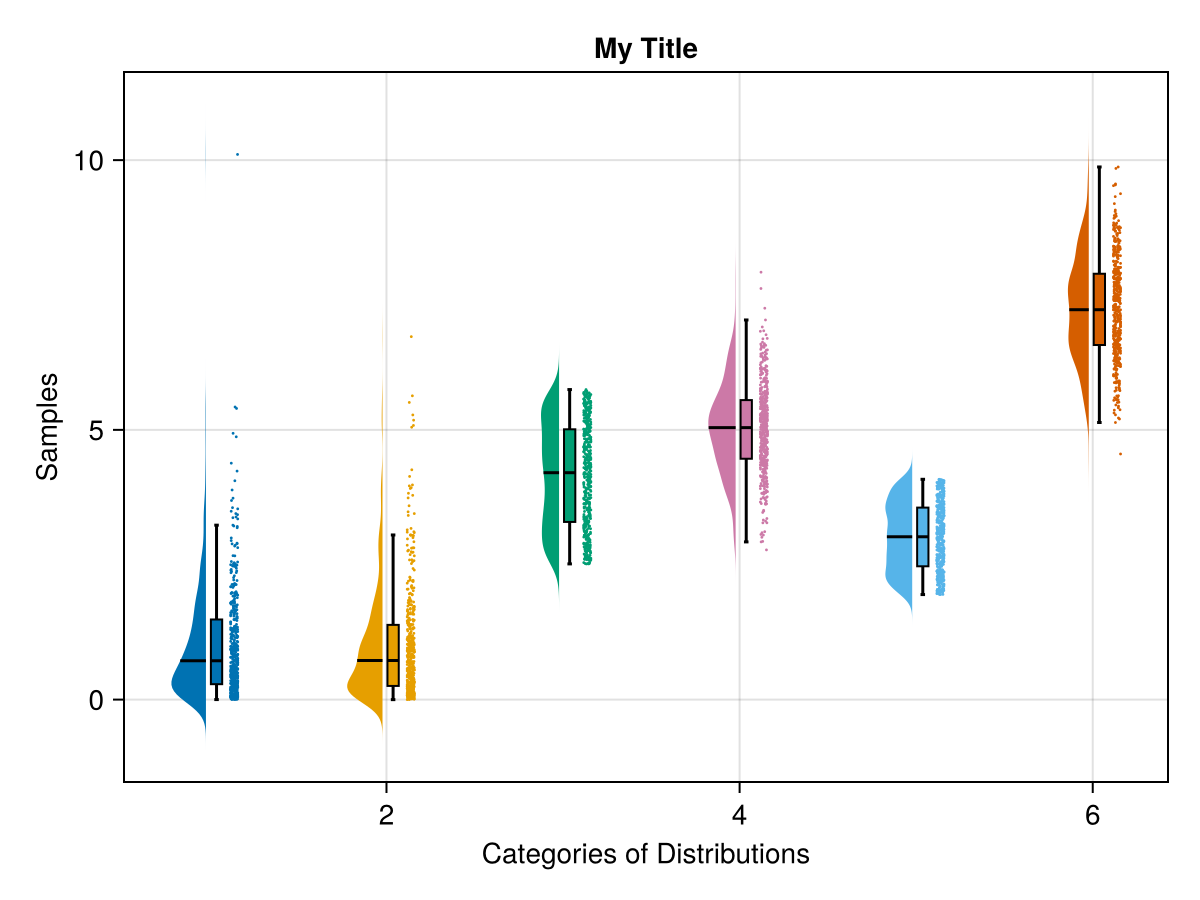
category_labels, data_array = mockup_categories_and_data_array(6)
rainclouds(category_labels, data_array;
    axis = (;
        xlabel = "Categories of Distributions",
        ylabel = "Samples",
        title = "My Title",
    ),
    plot_boxplots = true, cloud_width=0.5,
    color = colors[indexin(category_labels, unique(category_labels))])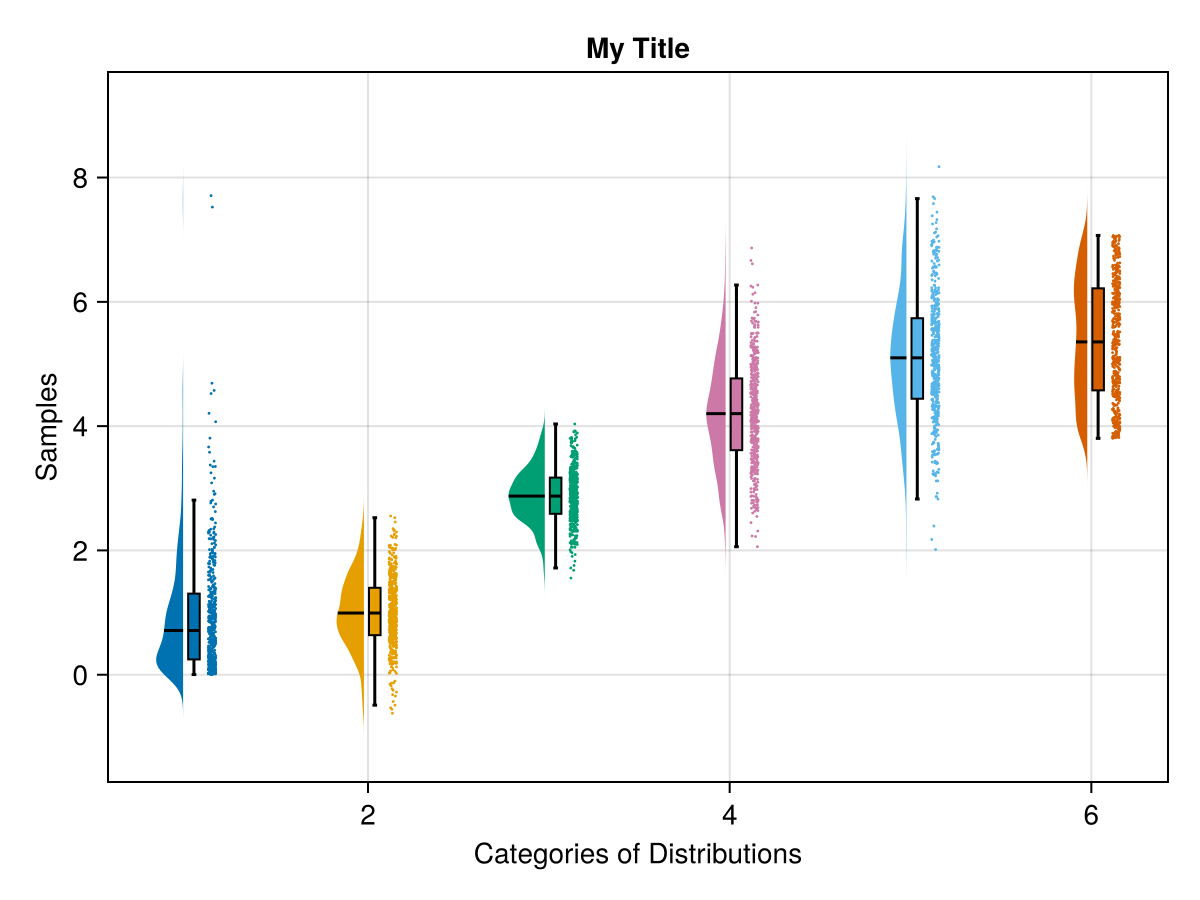
4 of these, between 3 distributions Left and Right example With and Without Box Plot
fig = Figure(size = (800*2, 600*5))
colors = [Makie.wong_colors(); Makie.wong_colors()]

category_labels, data_array = mockup_categories_and_data_array(3)
rainclouds!(
    Axis(fig[1, 1], title = "Left Side, with Box Plot"),
    category_labels, data_array;
    side = :left,
    plot_boxplots = true,
    color = colors[indexin(category_labels, unique(category_labels))])

rainclouds!(
    Axis(fig[2, 1], title = "Left Side, without Box Plot"),
    category_labels, data_array;
    side = :left,
    plot_boxplots = false,
    color = colors[indexin(category_labels, unique(category_labels))])

rainclouds!(
    Axis(fig[1, 2], title = "Right Side, with Box Plot"),
    category_labels, data_array;
    side = :right,
    plot_boxplots = true,
    color = colors[indexin(category_labels, unique(category_labels))])

rainclouds!(
    Axis(fig[2, 2], title = "Right Side, without Box Plot"),
    category_labels, data_array;
    side = :right,
    plot_boxplots = false,
    color = colors[indexin(category_labels, unique(category_labels))])

# Plots with more categories
# dist_between_categories (0.6, 1.0)
# with and without clouds

category_labels, data_array = mockup_categories_and_data_array(12)
rainclouds!(
    Axis(fig[3, 1:2], title = "More categories. Default spacing."),
    category_labels, data_array;
    plot_boxplots = true,
    gap = 1.0,
    color = colors[indexin(category_labels, unique(category_labels))])

rainclouds!(
    Axis(fig[4, 1:2], title = "More categories. Adjust space. (smaller cloud widths and smaller category distances)"),
    category_labels, data_array;
    plot_boxplots = true,
    cloud_width = 0.3,
    gap = 0.5,
    color = colors[indexin(category_labels, unique(category_labels))])

rainclouds!(
    Axis(fig[5, 1:2], title = "More categories. Adjust space. No clouds."),
    category_labels, data_array;
    plot_boxplots = true,
    clouds = nothing,
    gap = 0.5,
    color = colors[indexin(category_labels, unique(category_labels))])

supertitle = Label(fig[0, :], "Cloud Plot Testing (Scatter, Violin, Boxplot)", fontsize=30)
fig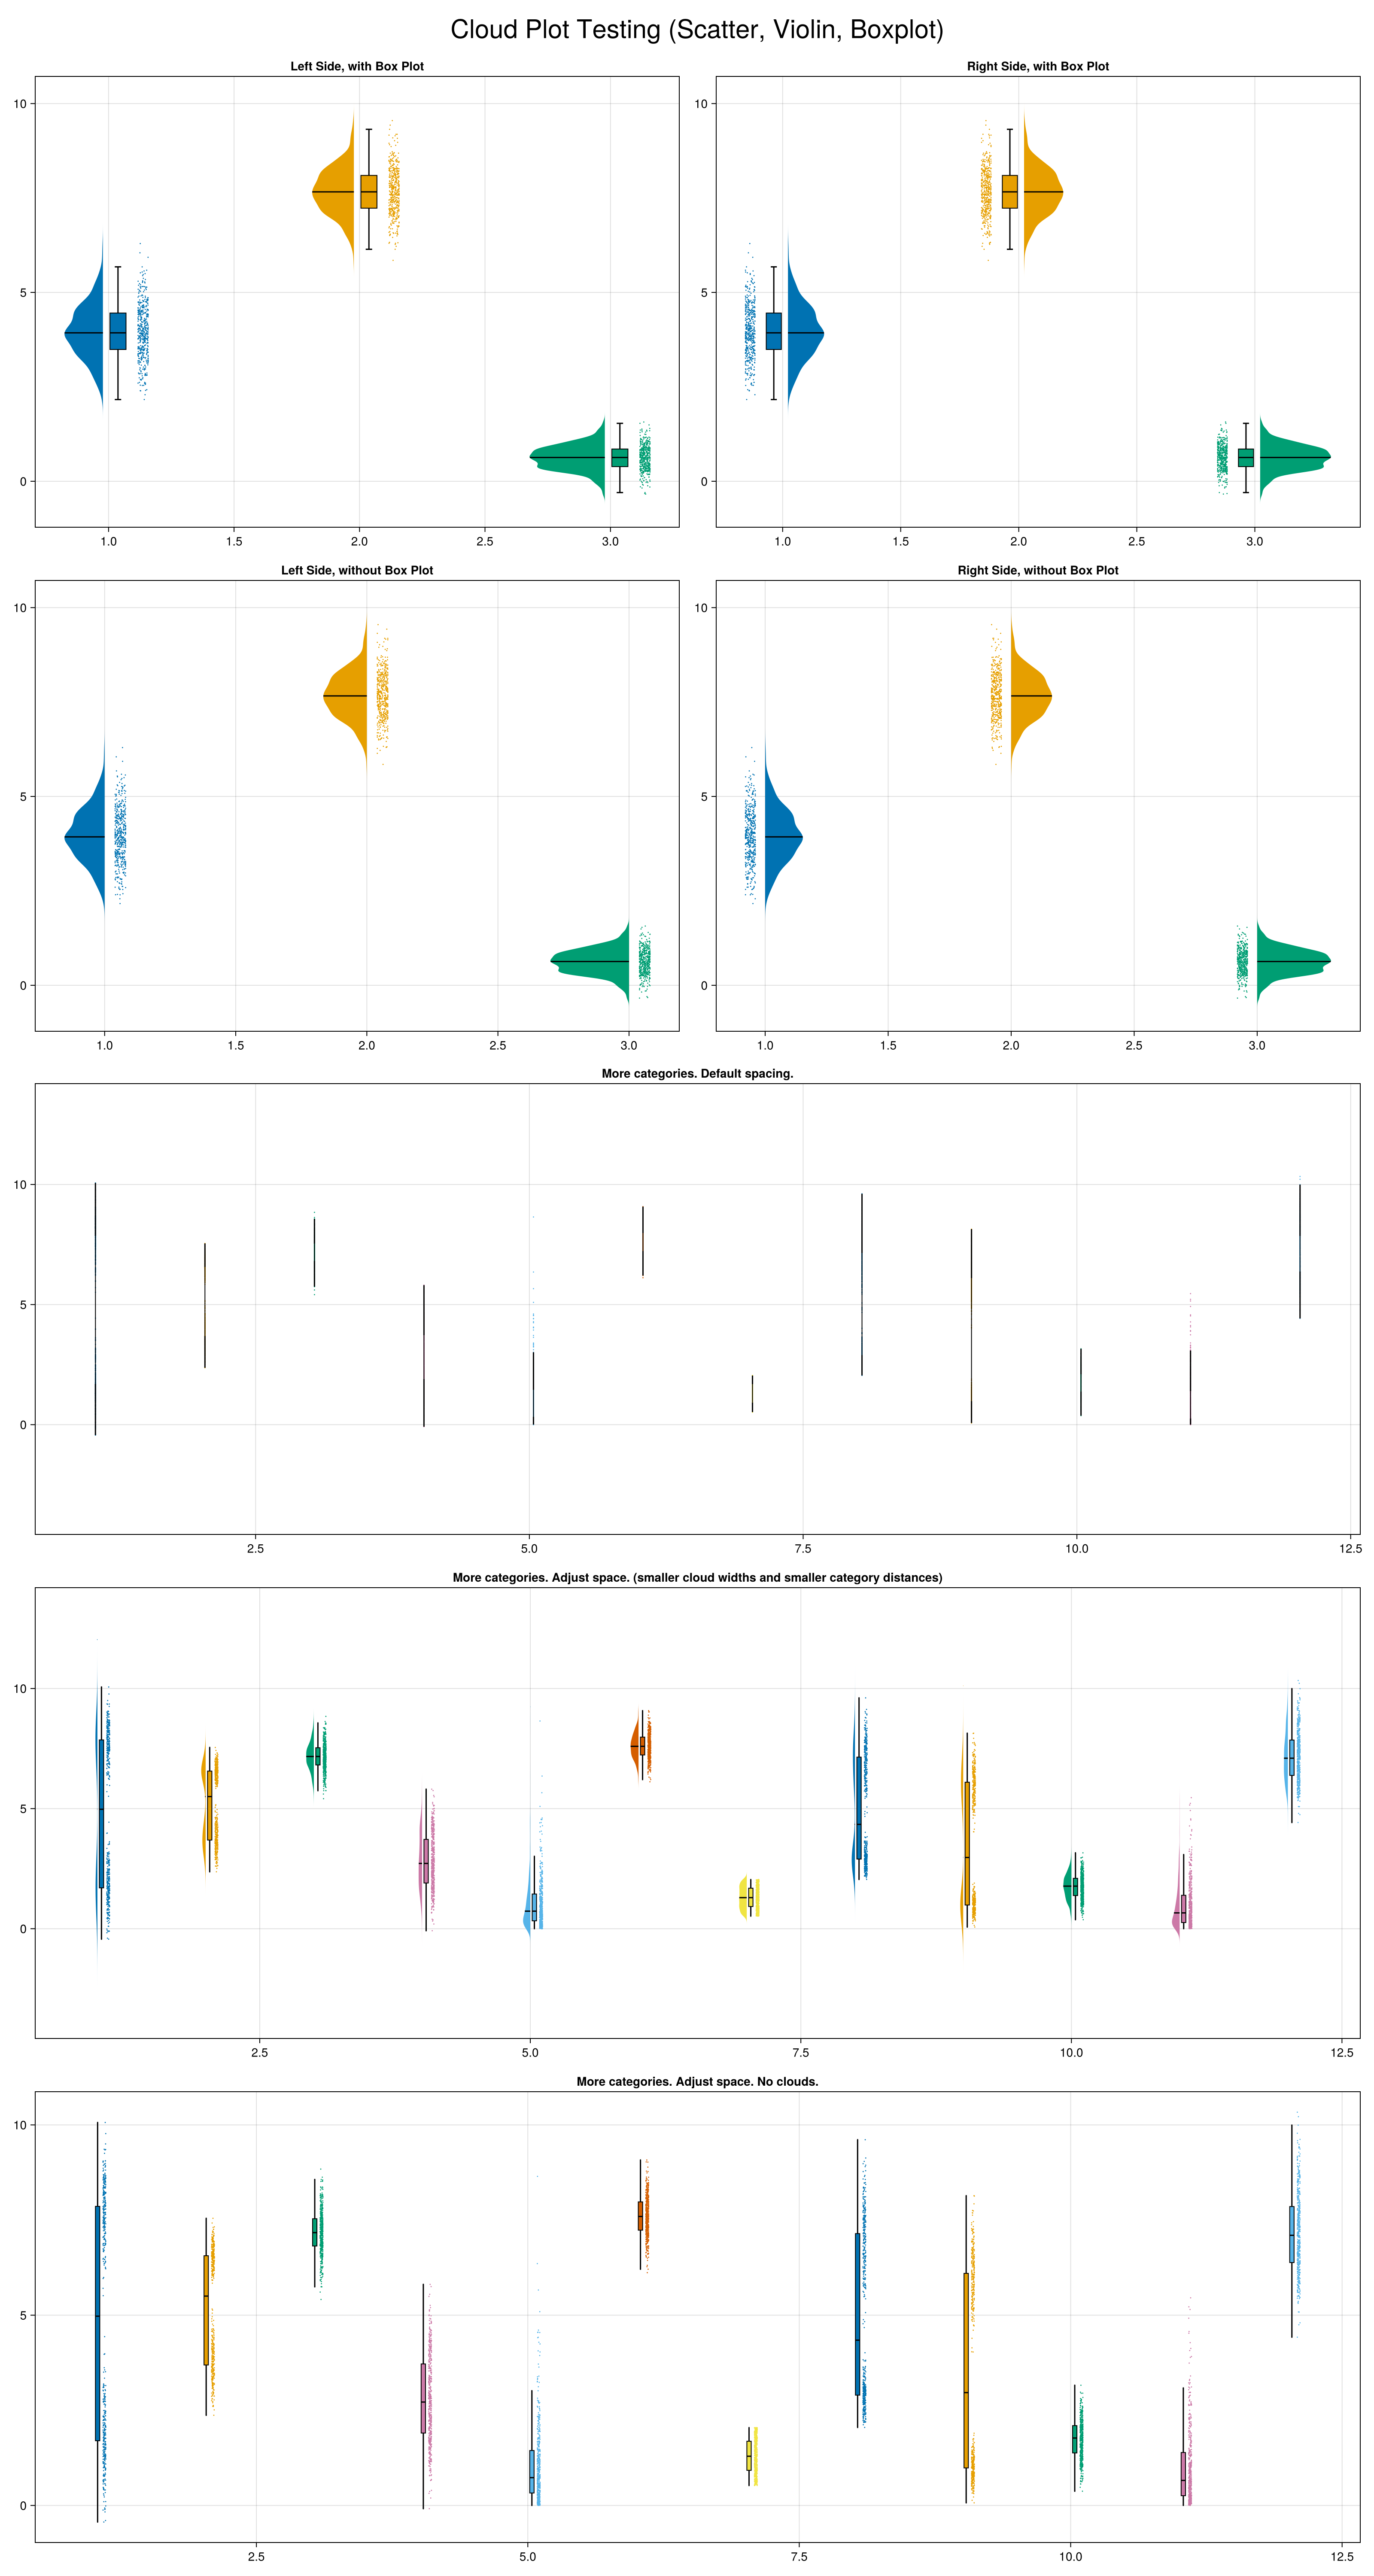
Attributes
boxplot_nudge
Defaults to 0.075
Determines the distance away the boxplot should be placed from the center line when center_boxplot is false. This is the value used to recentering the boxplot.
boxplot_width
Defaults to 0.1
Width of the boxplot on the category axis.
center_boxplot
Defaults to true
Whether or not to center the boxplot on the category.
cloud_width
Defaults to 0.75
Determines size of violin plot. Corresponds to width keyword arg in violin.
clouds
Defaults to violin
[violin, hist, nothing] how to show cloud plots, either as violin or histogram plots, or not at all.
color
Defaults to @inherit patchcolor
A single color, or a vector of colors, one for each point.
cycle
Defaults to [:color => :patchcolor]
No docs available.
dodge
Defaults to automatic
Vector of Integer (length of data) of grouping variable to create multiple side-by-side boxes at the same x position
dodge_gap
Defaults to 0.01
Spacing between dodged boxes.
gap
Defaults to 0.2
Distance between elements on the main axis (depending on orientation).
hist_bins
Defaults to 30
If clouds=hist, this passes down the number of bins to the histogram call.
jitter_width
Defaults to 0.05
Determines the width of the scatter-plot bar in category x-axis absolute terms.
markersize
Defaults to 2.0
Size of marker used for the scatter plot.
n_dodge
Defaults to automatic
The number of categories to dodge (defaults to maximum(dodge))
orientation
Defaults to :vertical
Orientation of rainclouds (:vertical or :horizontal)
plot_boxplots
Defaults to true
Whether to show boxplots to summarize distribution of data.
show_boxplot_outliers
Defaults to false
Show outliers in the boxplot as points (usually confusing when paired with the scatter plot so the default is to not show them)
show_median
Defaults to true
Determines whether or not to have a line for the median value in the boxplot.
side
Defaults to :left
Can take values of :left, :right, determines where the violin plot will be, relative to the scatter points
side_nudge
Defaults to automatic
Scatter plot specific. Default value is 0.02 if plot_boxplots is true, otherwise 0.075 default.
strokewidth
Defaults to 1.0
Determines the stroke width for the outline of the boxplot.
violin_limits
Defaults to (-Inf, Inf)
Specify values to trim the violin. Can be a Tuple or a Function (e.g. datalimits=extrema)
whiskerwidth
Defaults to 0.5
The width of the Q1, Q3 whisker in the boxplot. Value as a portion of the boxplot_width.