series
Makie.series Function
series(curves)Curves can be:
AbstractVector{<: AbstractVector{<: Point2}}: the native representation of a series as a vector of linesAbstractMatrix: each row represents y coordinates of the line, whilexgoes from1:size(curves, 1)AbstractVector, AbstractMatrix: the same as the above, but the first argument sets the x values for all linesAbstractVector{<: Tuple{X<: AbstractVector, Y<: AbstractVector}}: A vector of tuples, where each tuple contains a vector for the x and y coordinates
If any of marker, markersize, markercolor, strokecolor or strokewidth is set != nothing, a scatterplot is added.
Plot type
The plot type alias for the series function is Series.
Examples
Matrix
using CairoMakie
data = cumsum(randn(4, 101), dims = 2)

fig, ax, sp = series(data, labels=["label $i" for i in 1:4])
axislegend(ax)
fig
Vector of vectors
using CairoMakie
pointvectors = [Point2f.(1:100, cumsum(randn(100))) for i in 1:4]

series(pointvectors, markersize=5, color=:Set1)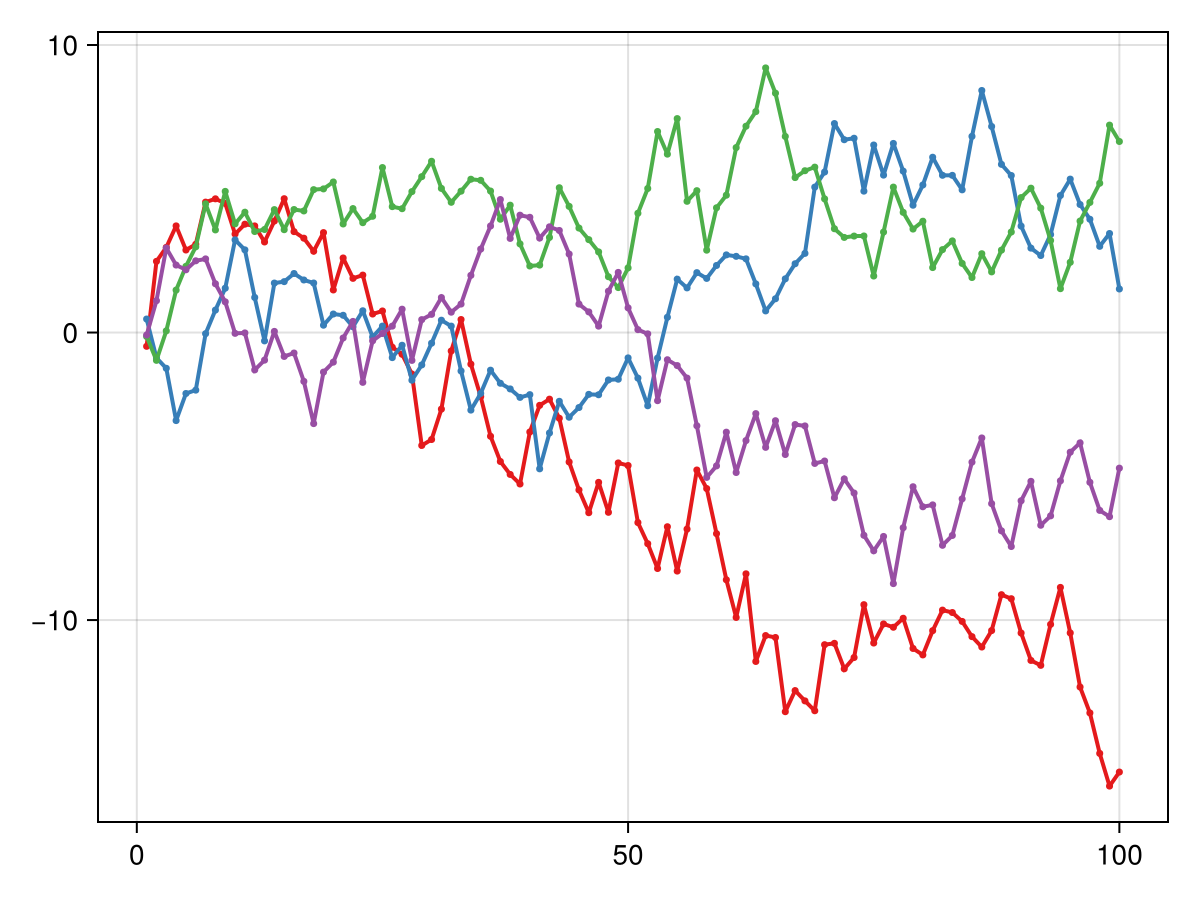
Vector and matrix
using CairoMakie
data = cumsum(randn(4, 101), dims = 2)

series(0:0.1:10, data, solid_color=:black)
Attributes
color
Defaults to :lighttest
No docs available.
joinstyle
Defaults to @inherit joinstyle
No docs available.
labels
Defaults to nothing
No docs available.
linecap
Defaults to @inherit linecap
No docs available.
linestyle
Defaults to :solid
No docs available.
linewidth
Defaults to 2
No docs available.
marker
Defaults to nothing
No docs available.
markercolor
Defaults to automatic
No docs available.
markersize
Defaults to nothing
No docs available.
miter_limit
Defaults to @inherit miter_limit
No docs available.
solid_color
Defaults to nothing
No docs available.
space
Defaults to :data
No docs available.
strokecolor
Defaults to nothing
No docs available.
strokewidth
Defaults to nothing
No docs available.