contour
Makie.contour Function
contour(x, y, z)
contour(z::Matrix)
Creates a contour plot of the plane spanning x::Vector, y::Vector, z::Matrix. If only z::Matrix is supplied, the indices of the elements in z will be used as the x and y locations when plotting the contour.
x and y can also be Matrices that define a curvilinear grid, similar to how surface works.
Plot type
The plot type alias for the contour function is Contour.
Examples
using CairoMakie
f = Figure()
Axis(f[1, 1])

xs = LinRange(0, 10, 100)
ys = LinRange(0, 15, 100)
zs = [cos(x) * sin(y) for x in xs, y in ys]

contour!(xs, ys, zs)

f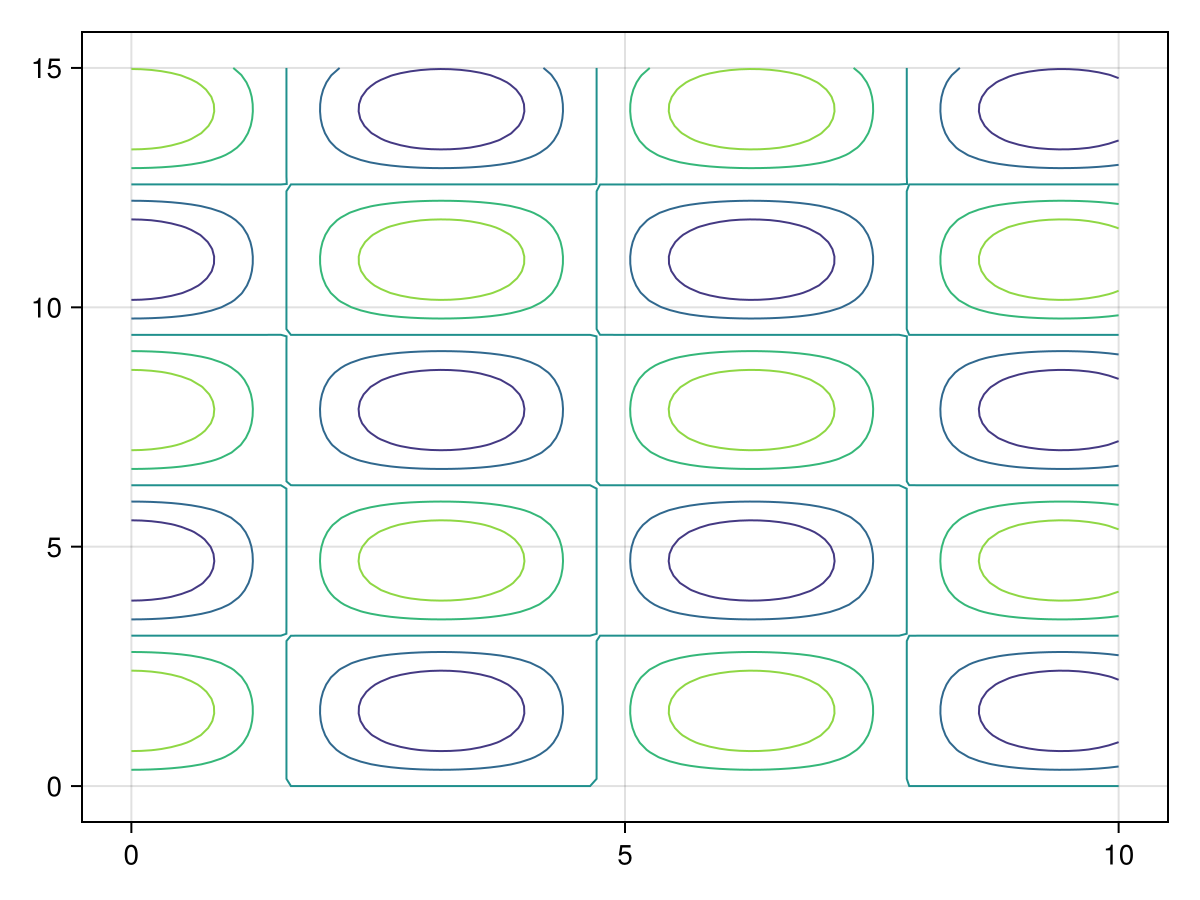
Omitting the xs and ys results in the indices of zs being used. We can also set arbitrary contour-levels using levels
using CairoMakie
f = Figure()
Axis(f[1, 1])

xs = LinRange(0, 10, 100)
ys = LinRange(0, 15, 100)
zs = [cos(x) * sin(y) for x in xs, y in ys]

contour!(zs,levels=-1:0.1:1)

f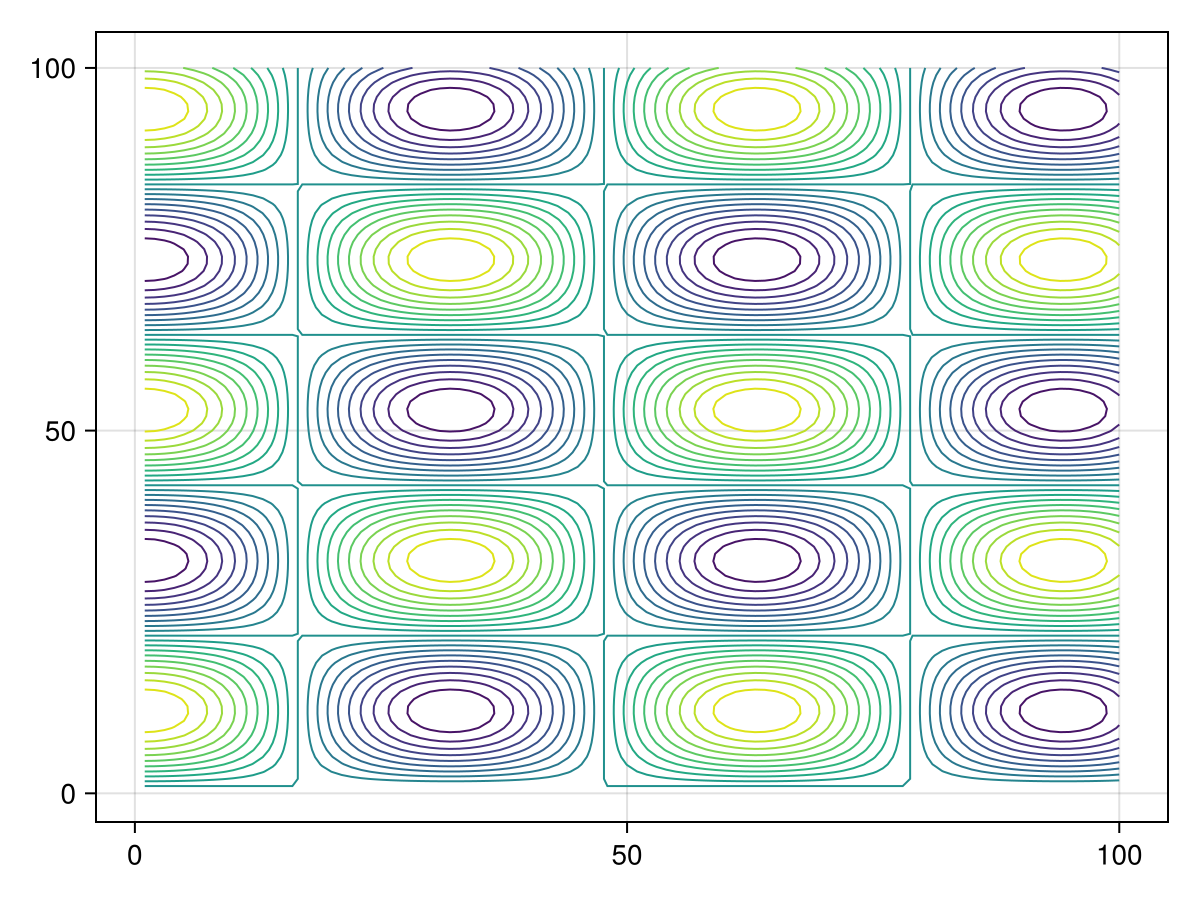
One can also add labels and control label attributes such as labelsize, labelcolor or labelfont.
using CairoMakie
himmelblau(x, y) = (x^2 + y - 11)^2 + (x + y^2 - 7)^2
x = y = range(-6, 6; length=100)
z = himmelblau.(x, y')

levels = 10.0.^range(0.3, 3.5; length=10)
colorscale = ReversibleScale(x -> x^(1 / 10), x -> x^10)
f, ax, ct = contour(x, y, z; labels=true, levels, colormap=:hsv, colorscale)
f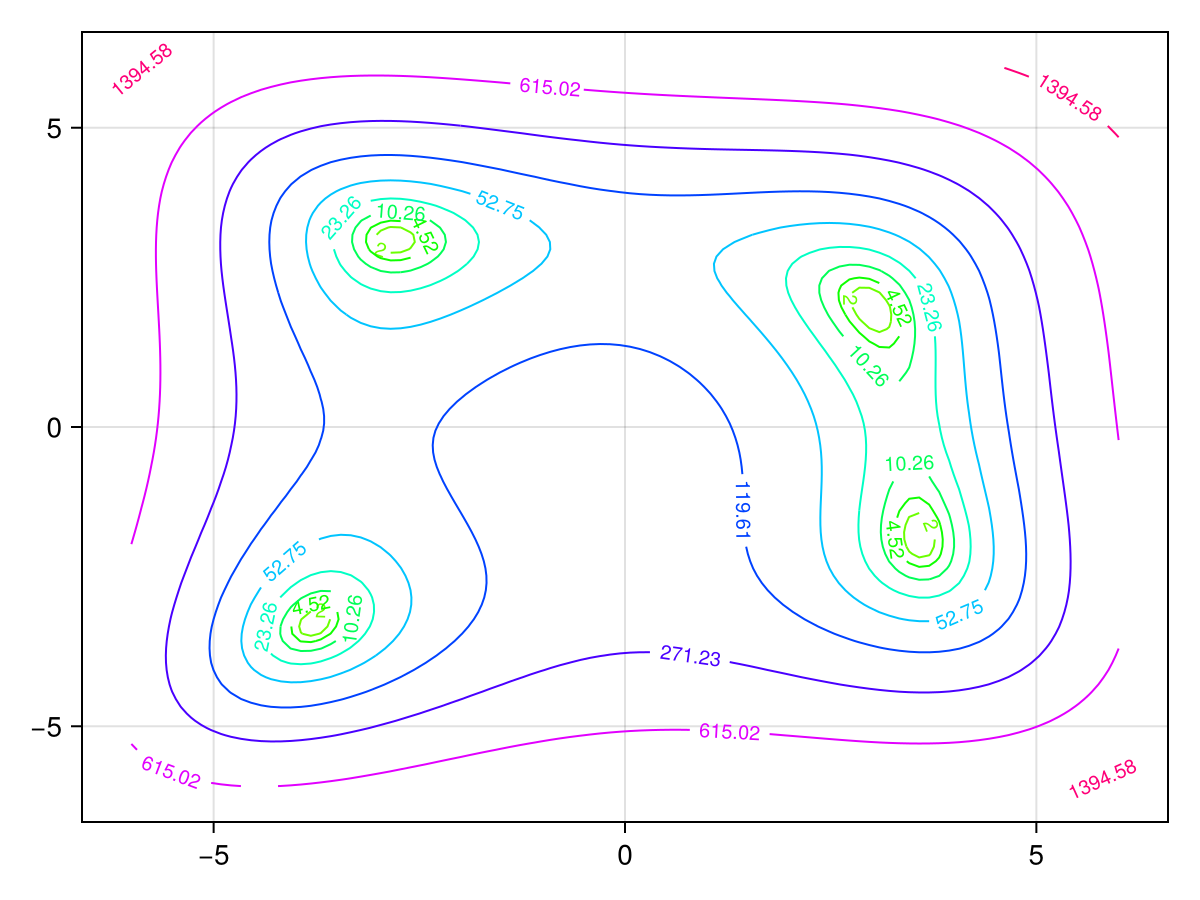
Curvilinear grids
contour also supports curvilinear grids, where x and y are both matrices of the same size as z. This is similar to the input that surface accepts.
Let's warp a regular grid of x and y by some nonlinear function, and plot its contours:
using CairoMakie
x = -10:10
y = -10:10
# The curvilinear grid:
xs = [x + 0.01y^3 for x in x, y in y]
ys = [y + 10cos(x/40) for x in x, y in y]

# Now, for simplicity, we calculate the `zs` values to be
# the radius from the center of the grid (0, 10).
zs = sqrt.(xs .^ 2 .+ (ys .- 10) .^ 2)

# We can use Makie's tick finders to get some nice looking contour levels:
levels = Makie.get_tickvalues(Makie.LinearTicks(7), extrema(zs)...)

# and now, we plot!
fig, ax, srf = surface(xs, ys, fill(0f0, size(zs)); color=zs, shading = NoShading, axis = (; type = Axis, aspect = DataAspect()))
ctr = contour!(ax, xs, ys, zs; color = :orange, levels = levels, labels = true, labelfont = :bold, labelsize = 12)

fig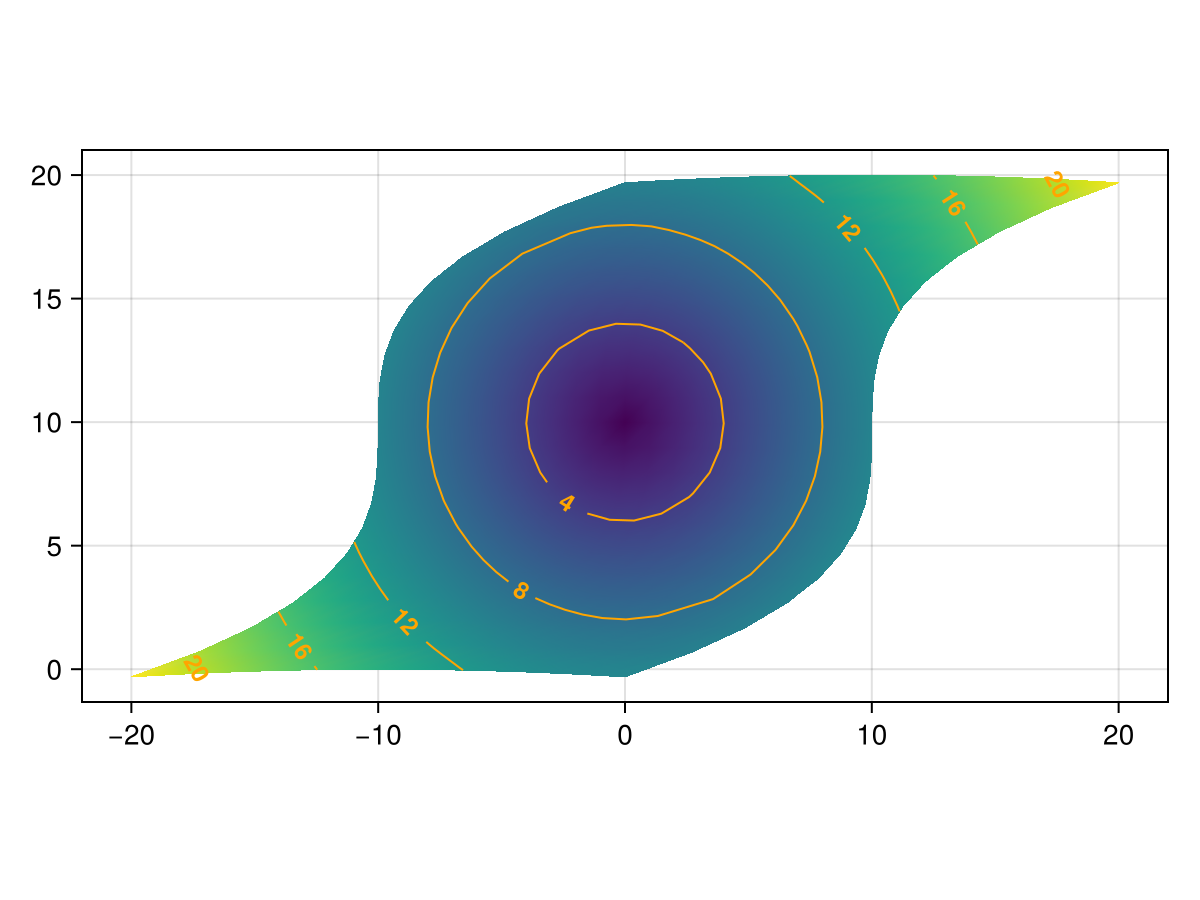
3D contours
3D contour plots exist in two variants. contour implements a variant showing multiple isosurfaces, i.e. surfaces that sample the same value from a 3D array. contour3d computes the same isolines as a 2D contour plot but renders them in 3D at z values equal to their level.
using GLMakie
r = range(-pi, pi, length = 21)
data2d = [cos(x) + cos(y) for x in r, y in r]
data3d = [cos(x) + cos(y) + cos(z) for x in r, y in r, z in r]

f = Figure(size = (700, 400))
a1 = Axis3(f[1, 1], title = "3D contour()")
contour!(a1, -pi .. pi, -pi .. pi, -pi .. pi, data3d)

a2 = Axis3(f[1, 2], title = "contour3d()")
contour3d!(a2, r, r, data2d, linewidth = 3, levels = 10)
f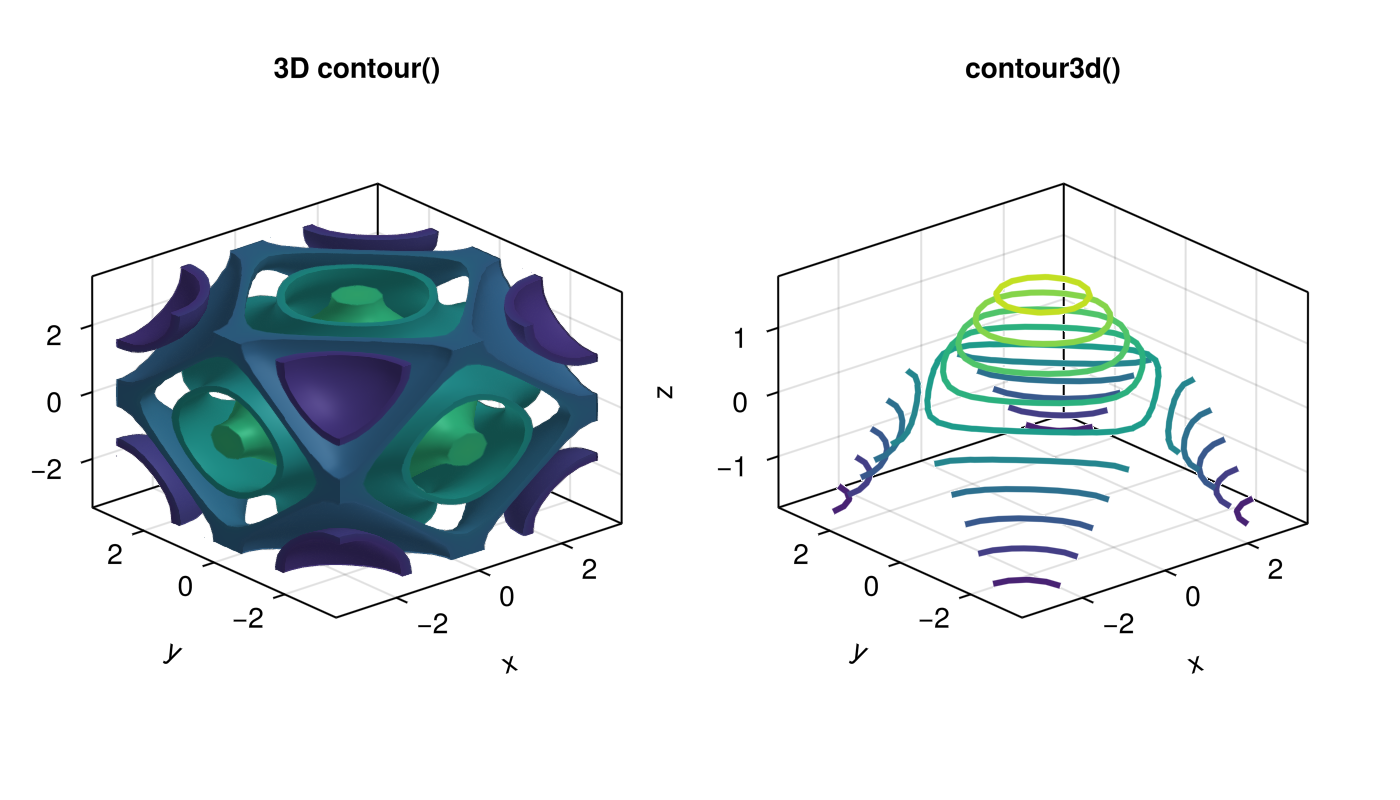
using GLMakie
r = range(-pi, pi, length = 21)
data3d = [cos(x) + cos(y) + cos(z) for x in r, y in r, z in r]

f = Figure(size = (700, 300))

# isorange controls the thickness of isosurfaces
# Note that artifacts may appear if isorange becomes too small (< 0.03 here)
a1 = Axis3(f[1, 1])
contour!(a1, -pi .. pi, -pi .. pi, -pi .. pi, data3d, isorange = 0.04)

# small alpha can be used to see into the contour plot
a2 = Axis3(f[1, 2])
contour!(a2, -pi .. pi, -pi .. pi, -pi .. pi, data3d, alpha = 0.05)
f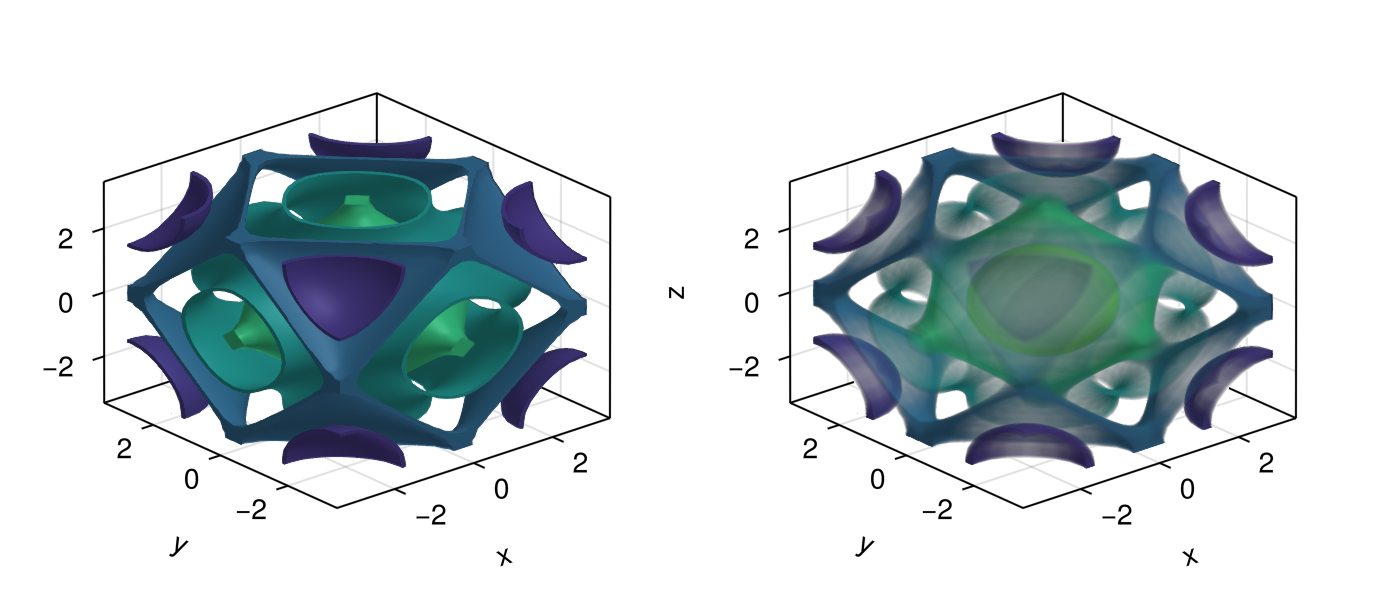
Attributes
alpha
Defaults to 1.0
The alpha value of the colormap or color attribute. Multiple alphas like in plot(alpha=0.2, color=(:red, 0.5), will get multiplied.
clip_planes
Defaults to @inherit clip_planes automatic
Clip planes offer a way to do clipping in 3D space. You can set a Vector of up to 8 Plane3f planes here, behind which plots will be clipped (i.e. become invisible). By default clip planes are inherited from the parent plot or scene. You can remove parent clip_planes by passing Plane3f[].
color
Defaults to nothing
The color of the contour lines. If nothing, the color is determined by the numerical values of the contour levels in combination with colormap and colorrange.
colormap
Defaults to @inherit colormap :viridis
Sets the colormap that is sampled for numeric colors. PlotUtils.cgrad(...), Makie.Reverse(any_colormap) can be used as well, or any symbol from ColorBrewer or PlotUtils. To see all available color gradients, you can call Makie.available_gradients().
colorrange
Defaults to automatic
The values representing the start and end points of colormap.
colorscale
Defaults to identity
The color transform function. Can be any function, but only works well together with Colorbar for identity, log, log2, log10, sqrt, logit, Makie.pseudolog10, Makie.Symlog10, Makie.AsinhScale, Makie.SinhScale, Makie.LogScale, Makie.LuptonAsinhScale, and Makie.PowerScale.
depth_shift
Defaults to 0.0
Adjusts the depth value of a plot after all other transformations, i.e. in clip space, where -1 <= depth <= 1. This only applies to GLMakie and WGLMakie and can be used to adjust render order (like a tunable overdraw).
enable_depth
Defaults to true
Controls whether 3D contours consider depth. Turning this off may improve performance.
fxaa
Defaults to true
Adjusts whether the plot is rendered with fxaa (fast approximate anti-aliasing, GLMakie only). Note that some plots implement a better native anti-aliasing solution (scatter, text, lines). For them fxaa = true generally lowers quality. Plots that show smoothly interpolated data (e.g. image, surface) may also degrade in quality as fxaa = true can cause blurring.
highclip
Defaults to automatic
The color for any value above the colorrange.
inspectable
Defaults to @inherit inspectable
Sets whether this plot should be seen by DataInspector. The default depends on the theme of the parent scene.
inspector_clear
Defaults to automatic
Sets a callback function (inspector, plot) -> ... for cleaning up custom indicators in DataInspector.
inspector_hover
Defaults to automatic
Sets a callback function (inspector, plot, index) -> ... which replaces the default show_data methods.
inspector_label
Defaults to automatic
Sets a callback function (plot, index, position) -> string which replaces the default label generated by DataInspector.
isorange
Defaults to automatic
Sets the tolerance for sampling of a level in 3D contour plots.
joinstyle
Defaults to @inherit joinstyle
Controls the rendering at line corners. Options are :miter for sharp corners, :bevel for cut-off corners, and :round for rounded corners. If the corner angle is below miter_limit, :miter is equivalent to :bevel to avoid long spikes.
labelcolor
Defaults to nothing
Color of the contour labels, if nothing it matches color by default.
labelfont
Defaults to @inherit font
The font of the contour labels.
labelformatter
Defaults to contour_label_formatter
Formats the numeric values of the contour levels to strings.
labels
Defaults to false
If true, adds text labels to the contour lines.
labelsize
Defaults to 10
Font size of the contour labels
levels
Defaults to 5
Controls the number and location of the contour lines. Can be either
an
Intthat produces n equally wide levels or bandsan
AbstractVector{<:Real}that lists n consecutive edges from low to high, which result in n-1 levels or bands
linecap
Defaults to @inherit linecap
Sets the type of line cap used for contour lines. Options are :butt (flat without extrusion), :square (flat with half a linewidth extrusion) or :round.
linestyle
Defaults to nothing
Sets the dash pattern of contour lines. See ?lines.
linewidth
Defaults to 1.0
Sets the width of contour lines.
lowclip
Defaults to automatic
The color for any value below the colorrange.
miter_limit
Defaults to @inherit miter_limit
" Sets the minimum inner line join angle below which miter joins truncate. See also Makie.miter_distance_to_angle.
model
Defaults to automatic
Sets a model matrix for the plot. This overrides adjustments made with translate!, rotate! and scale!.
nan_color
Defaults to :transparent
The color for NaN values.
overdraw
Defaults to false
Controls if the plot will draw over other plots. This specifically means ignoring depth checks in GL backends
space
Defaults to :data
Sets the transformation space for box encompassing the plot. See Makie.spaces() for possible inputs.
ssao
Defaults to false
Adjusts whether the plot is rendered with ssao (screen space ambient occlusion). Note that this only makes sense in 3D plots and is only applicable with fxaa = true.
transformation
Defaults to :automatic
Controls the inheritance or directly sets the transformations of a plot. Transformations include the transform function and model matrix as generated by translate!(...), scale!(...) and rotate!(...). They can be set directly by passing a Transformation() object or inherited from the parent plot or scene. Inheritance options include:
:automatic: Inherit transformations if the parent and childspaceis compatible:inherit: Inherit transformations:inherit_model: Inherit only model transformations:inherit_transform_func: Inherit only the transform function:nothing: Inherit neither, fully disconnecting the child's transformations from the parent
Another option is to pass arguments to the transform!() function which then get applied to the plot. For example transformation = (:xz, 1.0) which rotates the xy plane to the xz plane and translates by 1.0. For this inheritance defaults to :automatic but can also be set through e.g. (:nothing, (:xz, 1.0)).
transparency
Defaults to false
Adjusts how the plot deals with transparency. In GLMakie transparency = true results in using Order Independent Transparency.
visible
Defaults to true
Controls whether the plot gets rendered or not.