arrows
Arrows are split into two plot types, arrows2d and arrows3d. They differ in the arrow markers they create - arrows2d creates 2D arrows and arrows3d creates 3D arrows. Both can be used with 2D and 3D coordinates.
Makie.arrows2d Function
arrows2d(points, directions; kwargs...)
arrows2d(x, y, [z], u, v, [w])
arrows2d(x, y, [z], f::Function)
Plots arrows as 2D shapes.
Their positions are given by a vector of points or component vectors x, y and optionally z. A single point or value of x, y and z is also allowed. Which part of the arrow is aligned with the position depends on the align attribute.
Their directions are given by a vector of directions or component vectors u, v and optionally w just like positions. Additionally they can also be calculated by a function f which should return a Point or Vec for each arrow position::Point. Note that direction can also be interpreted as end points with argmode = :endpoint.
Plot type
The plot type alias for the arrows2d function is Arrows2D.
Makie.arrows3d Function
arrows3d(points, directions; kwargs...)
arrows3d(x, y, [z], u, v, [w])
arrows3d(x, y, [z], f::Function)
Plots arrows as 3D shapes.
Their positions are given by a vector of points or component vectors x, y and optionally z. A single point or value of x, y and z is also allowed. Which part of the arrow is aligned with the position depends on the align attribute.
Their directions are given by a vector of directions or component vectors u, v and optionally w just like positions. Additionally they can also be calculated by a function f which should return a Point or Vec for each arrow position::Point. Note that direction can also be interpreted as end points with argmode = :endpoint.
Plot type
The plot type alias for the arrows3d function is Arrows3D.
Examples
using CairoMakie
f = Figure(size = (800, 800))
Axis(f[1, 1], backgroundcolor = "black")

xs = LinRange(0, 2pi, 20)
ys = LinRange(0, 3pi, 20)
us = [sin(x) * cos(y) for x in xs, y in ys]
vs = [-cos(x) * sin(y) for x in xs, y in ys]
strength = vec(sqrt.(us .^ 2 .+ vs .^ 2))

arrows2d!(xs, ys, us, vs, lengthscale = 0.2, color = strength)

f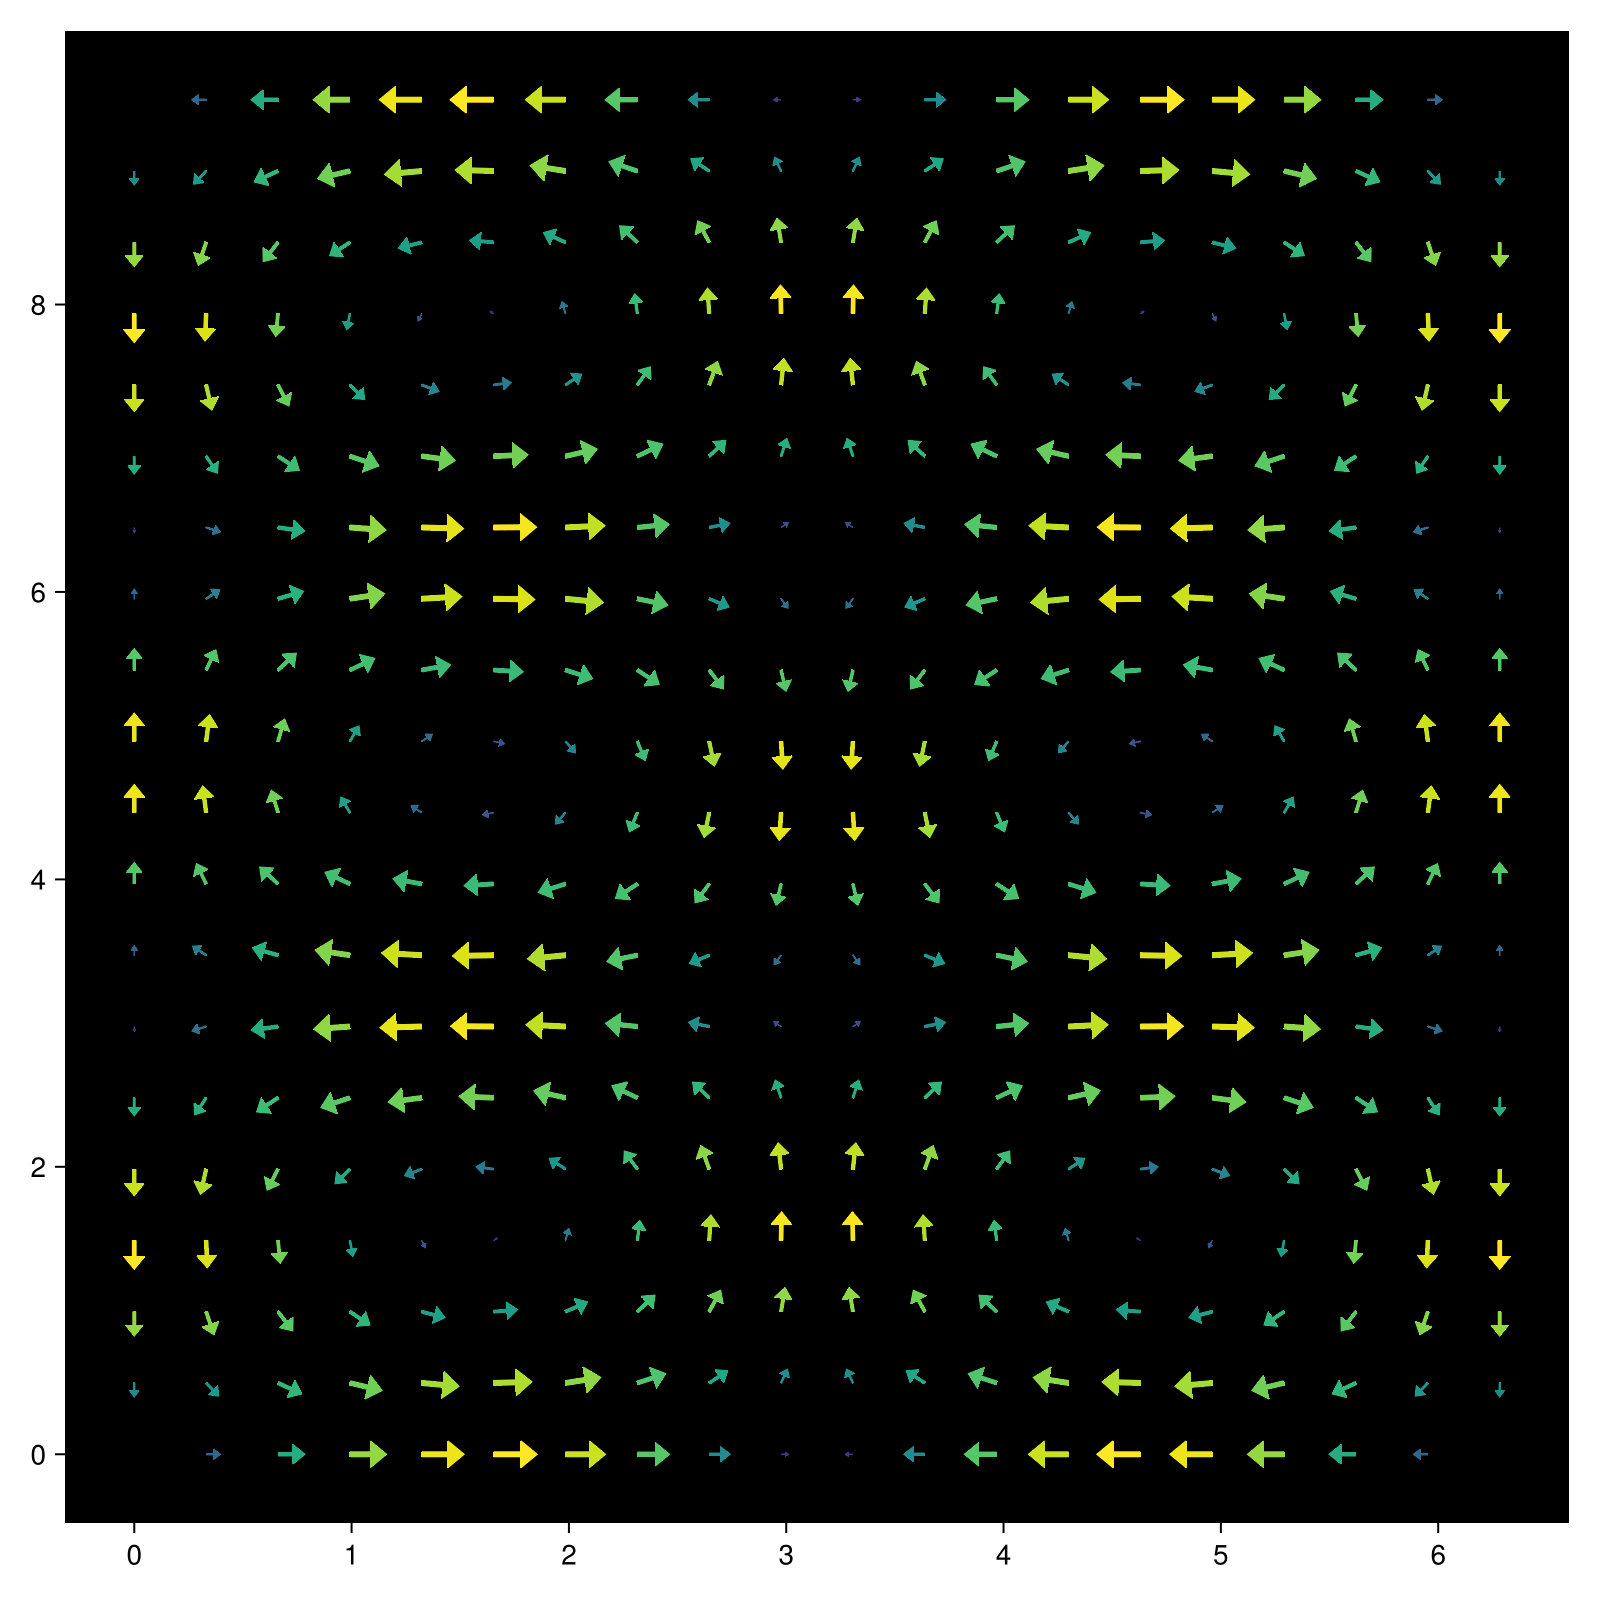
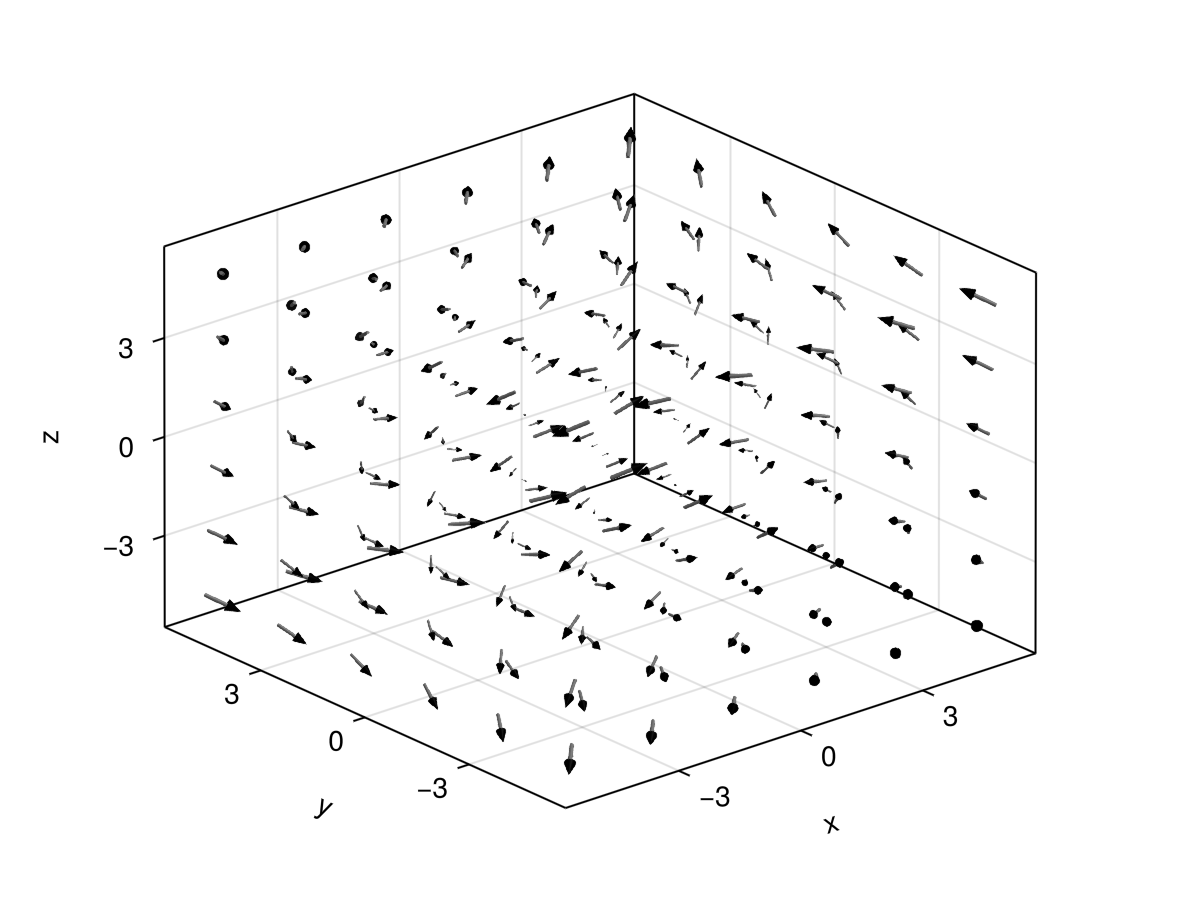
using GLMakie
ps = [Point3f(x, y, z) for x in -5:2:5 for y in -5:2:5 for z in -5:2:5]
ns = map(p -> 0.1 * Vec3f(p[2], p[3], p[1]), ps)
arrows3d(
    ps, ns,
    shaftcolor = :gray, tipcolor = :black,
    align = :center, axis=(type=Axis3,)
)
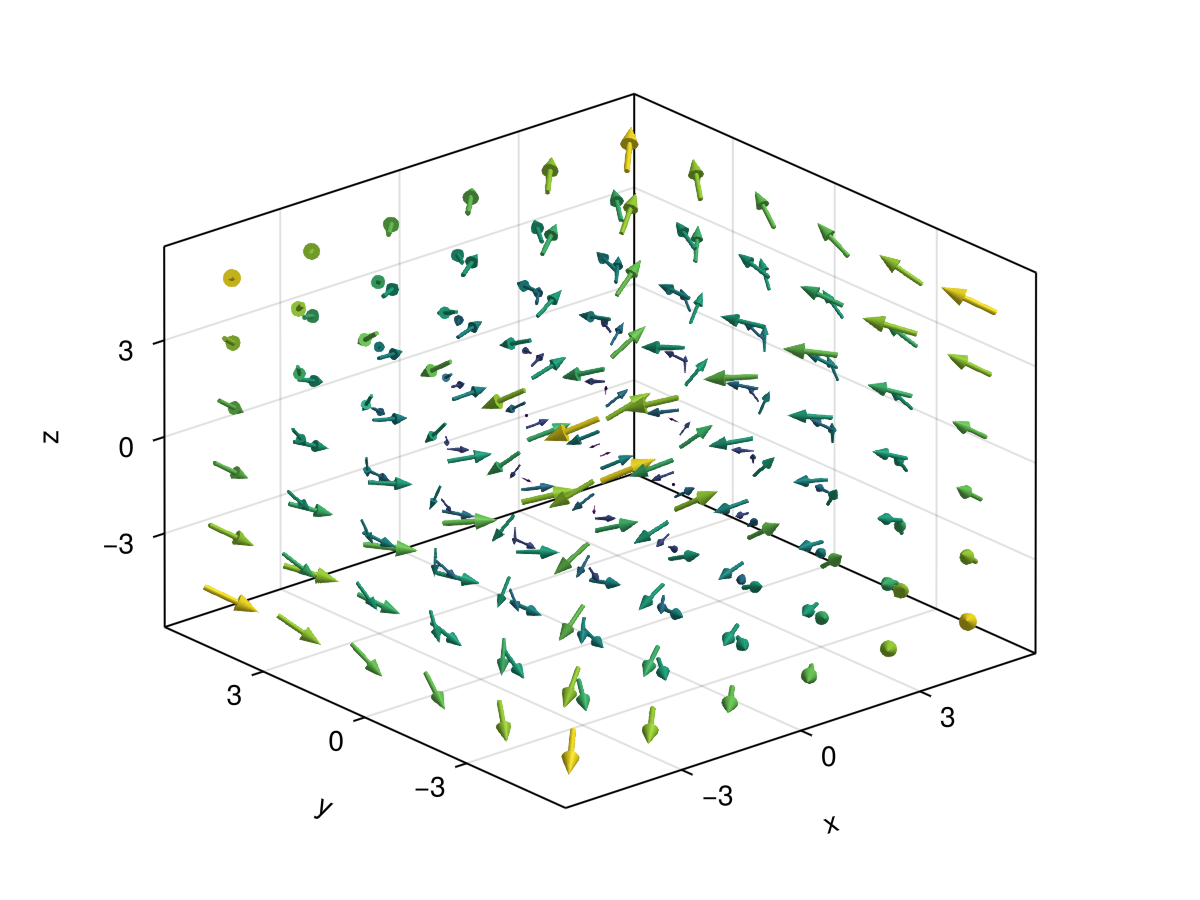
using GLMakie
using LinearAlgebra

ps = [Point3f(x, y, z) for x in -5:2:5 for y in -5:2:5 for z in -5:2:5]
ns = map(p -> 0.1 * Vec3f(p[2], p[3], p[1]), ps)
lengths = norm.(ns)
arrows3d(
    ps, ns, color = lengths, lengthscale = 1.5,
    align = :center, axis=(type=Axis3,)
)
arrows can also take a function f(x::Point{N})::Point{N} which returns the arrow vector when given the arrow's origin.
using CairoMakie
fig = Figure(size = (800, 800))
ax = Axis(fig[1, 1], backgroundcolor = "black")
xs = LinRange(0, 2pi, 20)
ys = LinRange(0, 3pi, 20)
# explicit method
us = [sin(x) * cos(y) for x in xs, y in ys]
vs = [-cos(x) * sin(y) for x in xs, y in ys]
strength = vec(sqrt.(us .^ 2 .+ vs .^ 2))
# function method
arrow_fun(x) = Point2f(sin(x[1])*cos(x[2]), -cos(x[1])*sin(x[2]))
arrows2d!(ax, xs, ys, arrow_fun, lengthscale = 0.3, color = strength)
fig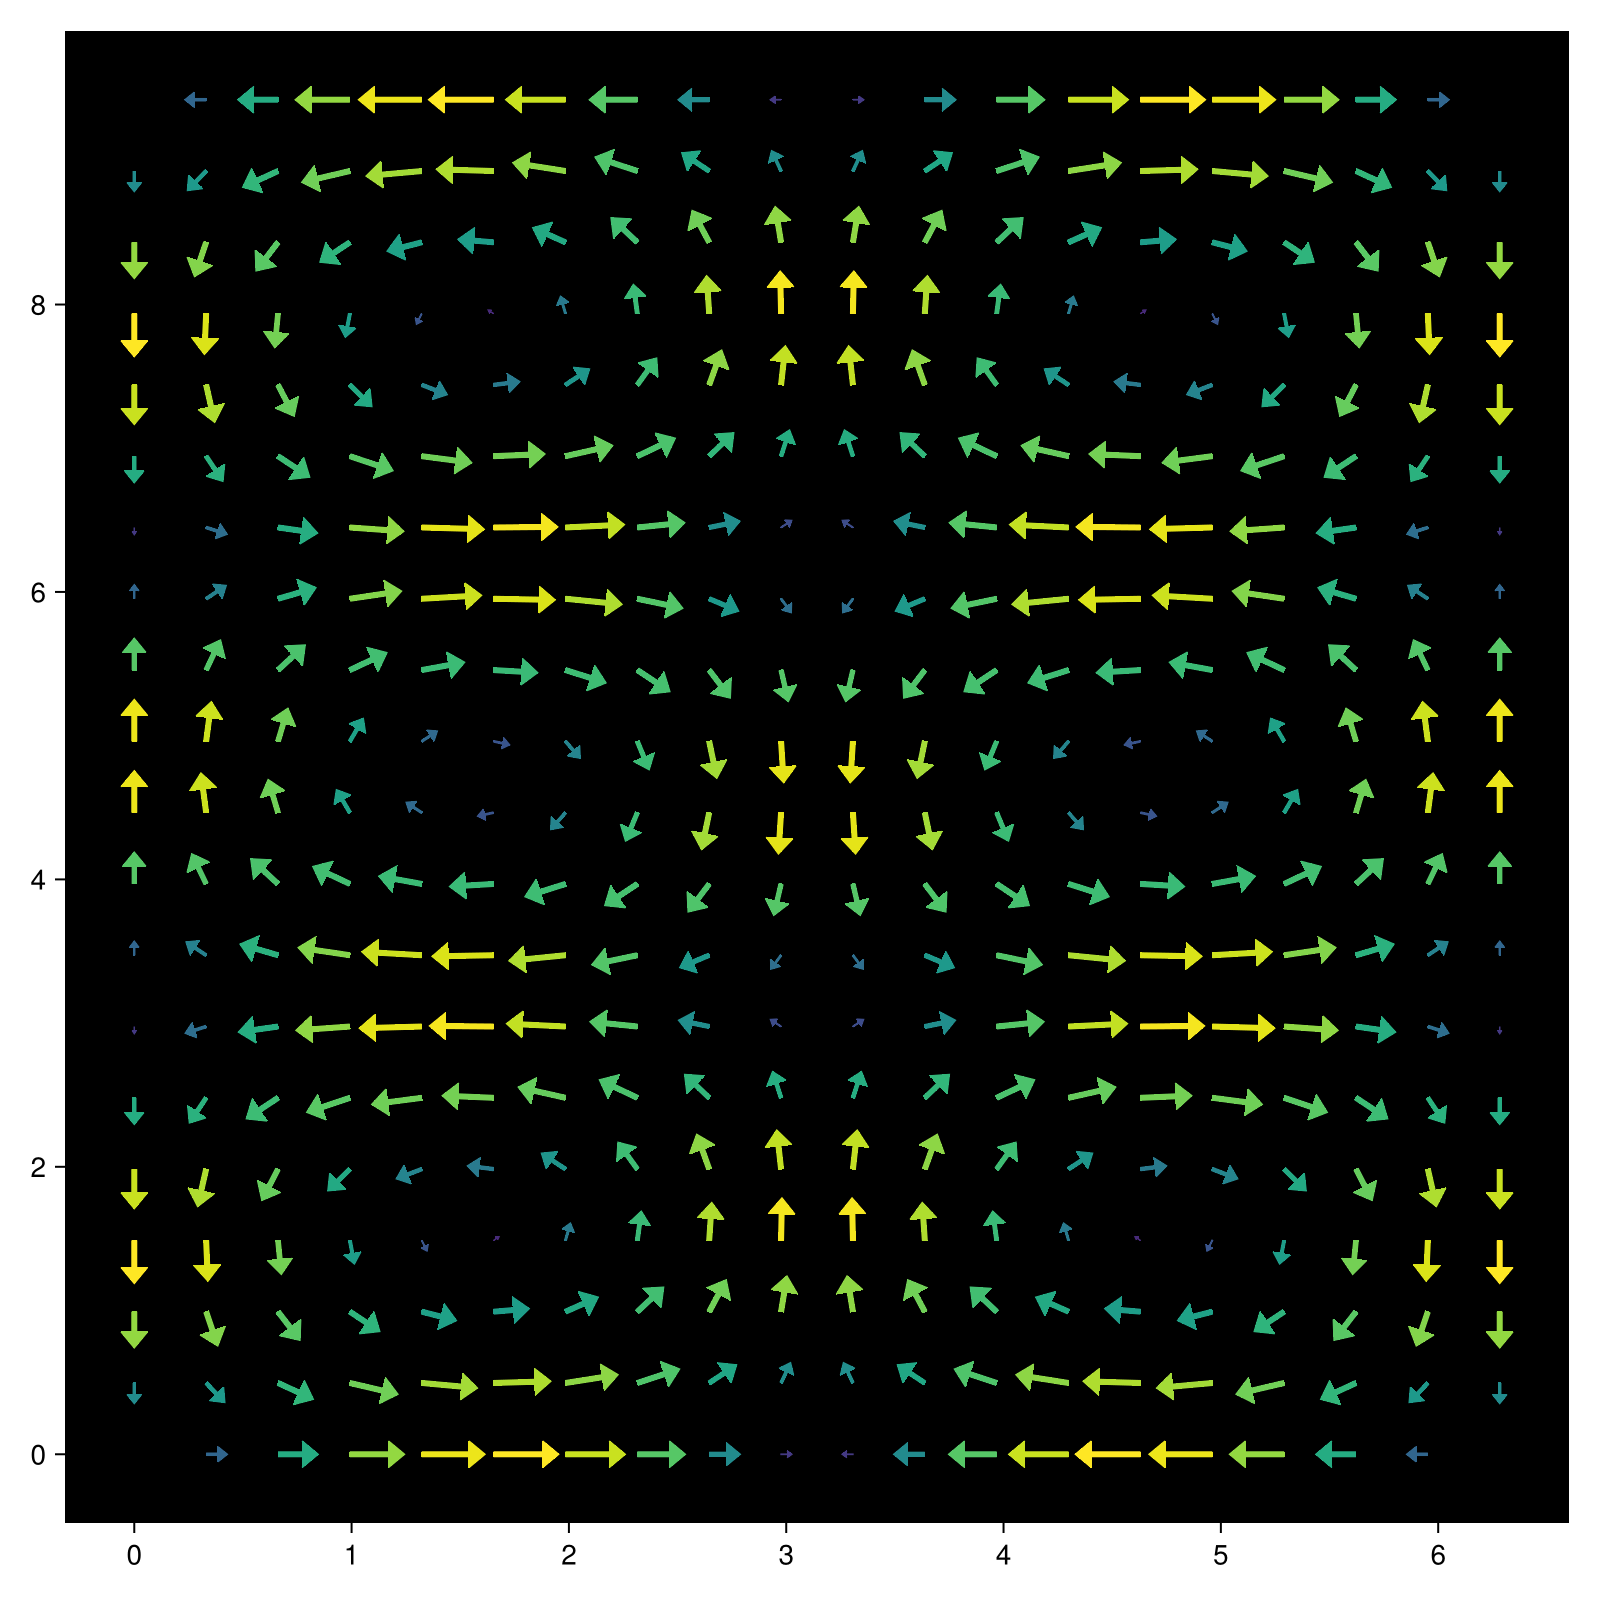
Arrow Components & Details
![]()
Arrow Length
The target size of each arrow is determined by its direction vector (second plot argument), normalize and lengthscale. From tail to tip, the length is given as lengthscale * norm(direction). If normalize = true the direction is normalized first, i.e. the length becomes just lengthscale.
There is also the option to treat the second plot argument as the arrows endpoint with argmode = :endpoint. In this case the directions are determined as direction = endpoint - startpoint and then follow the same principles.
Scaling
Arrow markers are separated into 3 components, a tail, a shaft and a tip. Each component comes with a length and width/radius (2D/3D) which determines its size. In 2D the sizes are given in pixel units by default (dependent on markerspace). In 3D they are given in relative units if markerscale = automatic (default) or data space units scaled by markerscale otherwise. To fit arrows to the length determined by directions, lengthscale and normalize, the shaftlength varies between minshaftlength and maxshaftlength if it is not explicitly set. Outside of this range or if it is explicitly set, all arrow lengths and widths/radii are scaled by a common factor instead.
Shapes
The base shape of each component is given by the tail, shaft and tip attributes. For arrows2d these can be anything compatible with poly, e.g. a 2D mesh, Polygon or Vector of points. Each component should be defined in a 0..1 x -0.5..0.5 range, where +x is the direction of the arrow. The shape can also be constructed by a callback function f(length, width, metrics) returning something poly-compatible. It is given the final length and width of the component as well as the all the other final lengths and widths through metrics. For arrows3d they should be a mesh or GeometryPrimitive defined in a -0.5..0.5 x -0.5..0.5 x 0..1 range. Here +z is the direction of the arrow.
Alignment
With argmode = :direction (default) arrows are aligned relative to the given positions (first argument). If align = :tail (or 0) the arrow will start at the respective position, align = :center (0.5) will centered and with align = :tip (1.0) it will end at the position. align can also take values outside the 0..1 range to create a gap between the position and the arrow marker.
If argmode = :endpoint alignment works differently and only takes effect if normalize = true or lengthscale != 1. Here align determines a point p = startpoint + align * (endpoint - startpoint) which aligns with same fraction of the arrow marker. So for example align = 0.5 (:center) aligns the midpoint between the plot arguments with the midpoint of each arrow marker. If the length of arrows is scaled down, this will create a matching gap on either side of the arrow.
using CairoMakie
f = Figure(size = (500, 500))

a = Axis(f[1,1], aspect = DataAspect())
ps = [Point2f(cos(a), sin(a)) for a in range(0, 2pi, length=21)[1:end-1]]
scatter!(ps, marker = Circle, color = :transparent, strokewidth = 1)

# Double headed arrow between two points, filling half the distance with
# :center alignment
p = arrows2d!(
    ps, [ps[2:end]..., ps[1]], color = (:blue, 0.5),
    align = :center, lengthscale = 0.5, argmode = :endpoint,
    tail = Point2f[(0, 0), (1, -0.5), (1, 0.5)], taillength = 8
)

# arrow pointing away from ps with a 0.2 gap between the tail and ps
arrows2d!(
    ps, ps, color = eachindex(ps), align = -0.2,
    colormap = :rainbow, lengthscale = 0.5
)

# arrow pointing to ps with a 0.2 gap between the tip and ps
arrows2d!(
    ps, ps, color = eachindex(ps), align = 1.2,
    colormap = :rainbow, lengthscale = 0.5
)
f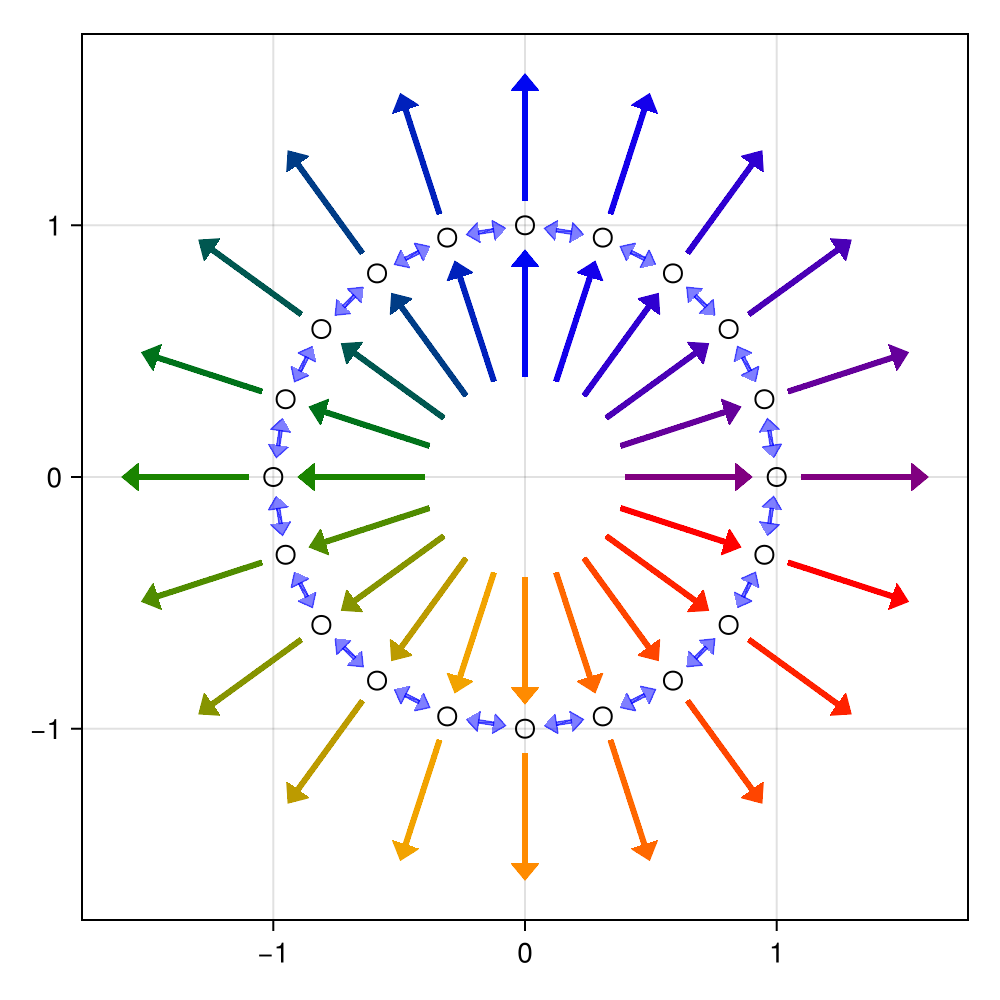
using CairoMakie
ps = Point2f.(1:5, 0)
vs = Vec2f.(0, 2 .^ (1:2:10))

fig = Figure()

ax = Axis(fig[1, 1], title = "Always scale, never elongate")
arrows2d!(ax, ps, vs, shaftlength = 16)
ax = Axis(fig[2, 1])
# x and y coordinates are on different scales, so radius (x) and length (y) are too
arrows3d!(ax, ps, vs, shaftlength = 50,
    tipradius = 0.1, tiplength = 20, shaftradius = 0.02)

ax = Axis(fig[1, 2], title = "Never scale, always elongate")
arrows2d!(ax, ps, vs, minshaftlength = 0)
ax = Axis(fig[2, 2])
arrows3d!(ax, ps, vs, minshaftlength = 0,
    markerscale = 1, tiplength = 30)

fig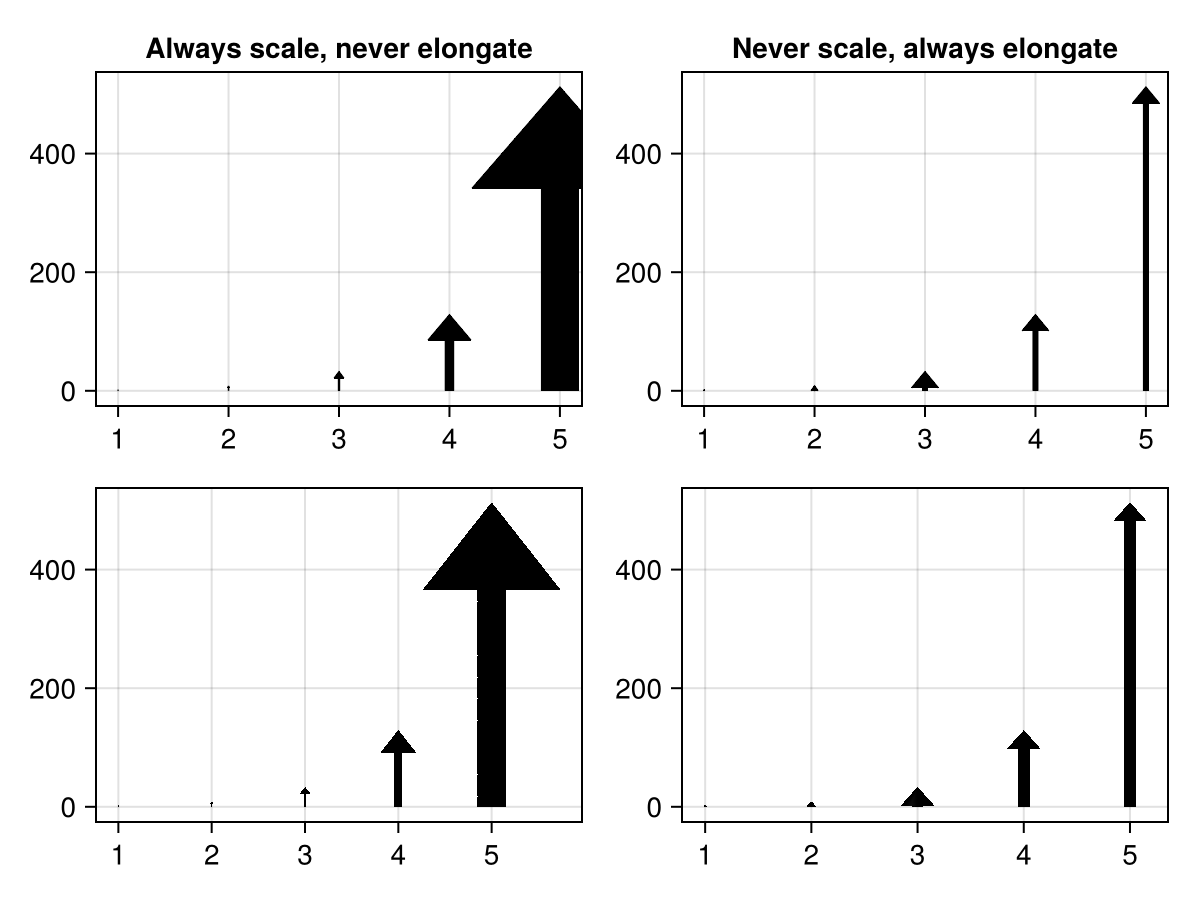
Attributes
Arrows2D
align
Defaults to :tail
Sets the alignment of the arrow, i.e. which part of the arrow is placed at the given positions.
align = :tailoralign = 0places the arrow tail at the given position. This makes the arrow point away from that position.align = :centeroralign = 0.5places the arrow center (based on its total length) at the given positionalign = :tiporalign = 1.0places the tip of the arrow at the given position. This makes the arrow point to that position.
Values outside of (0, 1) can also be used to create gaps between the arrow and its anchor position.
With argmode = :endpoint alignment is not relative to the first argument passed to arrows. Instead the given fraction of the arrow marker is aligned to the fraction between the start and end point of the arrow. So align = :center will align the center of the arrow marker with the center between the passed positions. Because of this align only has an effect here if normalize = true or if lengthscale != 1.
alpha
Defaults to 1.0
The alpha value of the colormap or color attribute. Multiple alphas like in plot(alpha=0.2, color=(:red, 0.5), will get multiplied.
argmode
Defaults to :direction
Controls whether the second argument is interpreted as a :direction or as an :endpoint.
clip_planes
Defaults to @inherit clip_planes automatic
Clip planes offer a way to do clipping in 3D space. You can set a Vector of up to 8 Plane3f planes here, behind which plots will be clipped (i.e. become invisible). By default clip planes are inherited from the parent plot or scene. You can remove parent clip_planes by passing Plane3f[].
color
Defaults to :black
Sets the color of the arrow. Can be overridden separately using tailcolor, shaftcolor and tipcolor.
colormap
Defaults to @inherit colormap :viridis
Sets the colormap that is sampled for numeric colors. PlotUtils.cgrad(...), Makie.Reverse(any_colormap) can be used as well, or any symbol from ColorBrewer or PlotUtils. To see all available color gradients, you can call Makie.available_gradients().
colorrange
Defaults to automatic
The values representing the start and end points of colormap.
colorscale
Defaults to identity
The color transform function. Can be any function, but only works well together with Colorbar for identity, log, log2, log10, sqrt, logit, Makie.pseudolog10 and Makie.Symlog10.
depth_shift
Defaults to 0.0
Adjusts the depth value of a plot after all other transformations, i.e. in clip space, where -1 <= depth <= 1. This only applies to GLMakie and WGLMakie and can be used to adjust render order (like a tunable overdraw).
fxaa
Defaults to true
Adjusts whether the plot is rendered with fxaa (anti-aliasing, GLMakie only).
highclip
Defaults to automatic
The color for any value above the colorrange.
inspectable
Defaults to @inherit inspectable
Sets whether this plot should be seen by DataInspector. The default depends on the theme of the parent scene.
inspector_clear
Defaults to automatic
Sets a callback function (inspector, plot) -> ... for cleaning up custom indicators in DataInspector.
inspector_hover
Defaults to automatic
Sets a callback function (inspector, plot, index) -> ... which replaces the default show_data methods.
inspector_label
Defaults to automatic
Sets a callback function (plot, index, position) -> string which replaces the default label generated by DataInspector.
lengthscale
Defaults to 1.0
Scales the length of the arrow (as calculated from directions) by some factor.
lowclip
Defaults to automatic
The color for any value below the colorrange.
markerspace
Defaults to :pixel
Sets the space of arrow metrics like tipwidth, tiplength, etc.
maxshaftlength
Defaults to Inf
Sets the maximum shaft length, see shaftlength.
minshaftlength
Defaults to 10
Sets the minimum shaft length, see shaftlength.
model
Defaults to automatic
Sets a model matrix for the plot. This overrides adjustments made with translate!, rotate! and scale!.
nan_color
Defaults to :transparent
The color for NaN values.
normalize
Defaults to false
If set to true, normalizes directions.
overdraw
Defaults to false
Controls if the plot will draw over other plots. This specifically means ignoring depth checks in GL backends
shaft
Defaults to Rect2f(0, -0.5, 1, 1)
Sets the shape of the arrow shaft in units relative to the shaftwidth and shaftlength. The arrow shape extends left to right (towards increasing x) and should be defined in a 0..1 by -0.5..0.5 range.
shaftcolor
Defaults to automatic
Sets the color of the arrow shaft. Defaults to color
shaftlength
Defaults to automatic
Sets the length of the arrow shaft. When set to automatic the length of the shaft will be derived from the length of the arrow, the taillength and the tiplength. If the results falls outside minshaftlength to maxshaftlength it is clamped and all lengths and widths are scaled to fit. If the shaftlength is set to a value, the lengths and widths of the arrow are always scaled.
shaftwidth
Defaults to 3
Sets the width of the arrow shaft. This width may get scaled down if the total arrow length exceeds the available space for the arrow.
space
Defaults to :data
Sets the transformation space for box encompassing the plot. See Makie.spaces() for possible inputs.
ssao
Defaults to false
Adjusts whether the plot is rendered with ssao (screen space ambient occlusion). Note that this only makes sense in 3D plots and is only applicable with fxaa = true.
strokemask
Defaults to 0.75
Arrows2D relies on mesh rendering to draw arrows, which doesn't anti-alias well when the mesh gets thin. To mask this issue an outline is drawn over the mesh with lines. The width of that outline is given by strokemask. Setting this to 0 may improve transparent arrows.
tail
Defaults to arrowtail2d
Sets the shape of the arrow tail in units relative to the tailwidth and taillength. The arrow shape extends left to right (towards increasing x) and should be defined in a 0..1 by -0.5..0.5 range.
tailcolor
Defaults to automatic
Sets the color of the arrow tail. Defaults to color
taillength
Defaults to 0
Sets the length of the arrow tail. This length may get scaled down if the total arrow length exceeds the available space for the arrow. Setting this to 0 will result in no tail being drawn.
tailwidth
Defaults to 14
Sets the width of the arrow tail. This width may get scaled down if the total arrow length exceeds the available space for the arrow.
tip
Defaults to Point2f[(0, -0.5), (1, 0), (0, 0.5)]
Sets the shape of the arrow tip in units relative to the tipwidth and tiplength. The arrow shape extends left to right (towards increasing x) and should be defined in a 0..1 by -0.5..0.5 range.
tipcolor
Defaults to automatic
Sets the color of the arrow tip. Defaults to color
tiplength
Defaults to 8
Sets the length of the arrow tip. This length may get scaled down if the total arrow length exceeds the available space for the arrow. Setting this to 0 will result in no tip being drawn.
tipwidth
Defaults to 14
Sets the width of the arrow tip. This width may get scaled down if the total arrow length exceeds the available space for the arrow.
transformation
Defaults to :automatic
No docs available.
transparency
Defaults to false
Adjusts how the plot deals with transparency. In GLMakie transparency = true results in using Order Independent Transparency.
visible
Defaults to true
Controls whether the plot will be rendered or not.
Arrows3D
align
Defaults to :tail
Sets the alignment of the arrow, i.e. which part of the arrow is placed at the given positions.
align = :tailoralign = 0places the arrow tail at the given position. This makes the arrow point away from that position.align = :centeroralign = 0.5places the arrow center (based on its total length) at the given positionalign = :tiporalign = 1.0places the tip of the arrow at the given position. This makes the arrow point to that position.
Values outside of (0, 1) can also be used to create gaps between the arrow and its anchor position.
With argmode = :endpoint alignment is not relative to the first argument passed to arrows. Instead the given fraction of the arrow marker is aligned to the fraction between the start and end point of the arrow. So align = :center will align the center of the arrow marker with the center between the passed positions. Because of this align only has an effect here if normalize = true or if lengthscale != 1.
alpha
Defaults to 1.0
The alpha value of the colormap or color attribute. Multiple alphas like in plot(alpha=0.2, color=(:red, 0.5), will get multiplied.
argmode
Defaults to :direction
Controls whether the second argument is interpreted as a :direction or as an :endpoint.
backlight
Defaults to 0.0
Sets a weight for secondary light calculation with inverted normals.
clip_planes
Defaults to @inherit clip_planes automatic
Clip planes offer a way to do clipping in 3D space. You can set a Vector of up to 8 Plane3f planes here, behind which plots will be clipped (i.e. become invisible). By default clip planes are inherited from the parent plot or scene. You can remove parent clip_planes by passing Plane3f[].
color
Defaults to :black
Sets the color of the arrow. Can be overridden separately using tailcolor, shaftcolor and tipcolor.
colormap
Defaults to @inherit colormap :viridis
Sets the colormap that is sampled for numeric colors. PlotUtils.cgrad(...), Makie.Reverse(any_colormap) can be used as well, or any symbol from ColorBrewer or PlotUtils. To see all available color gradients, you can call Makie.available_gradients().
colorrange
Defaults to automatic
The values representing the start and end points of colormap.
colorscale
Defaults to identity
The color transform function. Can be any function, but only works well together with Colorbar for identity, log, log2, log10, sqrt, logit, Makie.pseudolog10 and Makie.Symlog10.
depth_shift
Defaults to 0.0
Adjusts the depth value of a plot after all other transformations, i.e. in clip space, where -1 <= depth <= 1. This only applies to GLMakie and WGLMakie and can be used to adjust render order (like a tunable overdraw).
diffuse
Defaults to 1.0
Sets how strongly the red, green and blue channel react to diffuse (scattered) light.
fxaa
Defaults to true
Adjusts whether the plot is rendered with fxaa (anti-aliasing, GLMakie only).
highclip
Defaults to automatic
The color for any value above the colorrange.
inspectable
Defaults to @inherit inspectable
Sets whether this plot should be seen by DataInspector. The default depends on the theme of the parent scene.
inspector_clear
Defaults to automatic
Sets a callback function (inspector, plot) -> ... for cleaning up custom indicators in DataInspector.
inspector_hover
Defaults to automatic
Sets a callback function (inspector, plot, index) -> ... which replaces the default show_data methods.
inspector_label
Defaults to automatic
Sets a callback function (plot, index, position) -> string which replaces the default label generated by DataInspector.
lengthscale
Defaults to 1.0
Scales the length of the arrow (as calculated from directions) by some factor.
lowclip
Defaults to automatic
The color for any value below the colorrange.
markerscale
Defaults to automatic
Scales all arrow components, i.e. all radii and lengths (including min/maxshaftlength). When set to automatic the scaling factor is based on the boundingbox of the given data. This does not affect the mapping between arrows and directions.
material
Defaults to nothing
RPRMakie only attribute to set complex RadeonProRender materials. Warning, how to set an RPR material may change and other backends will ignore this attribute
maxshaftlength
Defaults to Inf
Sets the maximum shaft length, see shaftlength
minshaftlength
Defaults to 0.6
Sets the minimum shaft length, see shaftlength.
model
Defaults to automatic
Sets a model matrix for the plot. This overrides adjustments made with translate!, rotate! and scale!.
nan_color
Defaults to :transparent
The color for NaN values.
normalize
Defaults to false
If set to true, normalizes directions.
overdraw
Defaults to false
Controls if the plot will draw over other plots. This specifically means ignoring depth checks in GL backends
quality
Defaults to 32
Sets the number of vertices used when generating meshes for the arrow tail, shaft and cone. More vertices will improve the roundness of the mesh but be more costly.
shading
Defaults to true
Controls if the plot object is shaded by the parent scenes lights or not. The lighting algorithm used is controlled by the scenes shading attribute.
shaft
Defaults to Cylinder(Point3f(0, 0, 0), Point3f(0, 0, 1), 0.5)
Sets the mesh of the arrow shaft. The mesh should be defined in a Rect3(-0.5, -0.5, 0.0, 1, 1, 1) where +z is direction of the arrow. Anything outside this box will extend outside the area designated to the arrow shaft.
shaftcolor
Defaults to automatic
Sets the color of the arrow shaft. Defaults to color
shaftlength
Defaults to automatic
Sets the length of the arrow shaft. When set to automatic the length of the shaft will be derived from the length of the arrow, the taillength and the tiplength. If the results falls outside minshaftlength to maxshaftlength it is clamped and all lengths and widths are scaled to fit. If the shaftlength is set to a value, the lengths and widths of the arrow are always scaled.
shaftradius
Defaults to 0.05
Sets the width of the arrow shaft. This width may get scaled down if the total arrow length exceeds the available space for the arrow.
shininess
Defaults to 32.0
Sets how sharp the reflection is.
space
Defaults to :data
Sets the transformation space for box encompassing the plot. See Makie.spaces() for possible inputs.
specular
Defaults to 0.2
Sets how strongly the object reflects light in the red, green and blue channels.
ssao
Defaults to false
Adjusts whether the plot is rendered with ssao (screen space ambient occlusion). Note that this only makes sense in 3D plots and is only applicable with fxaa = true.
tail
Defaults to Cylinder(Point3f(0, 0, 0), Point3f(0, 0, 1), 0.5)
Sets the mesh of the arrow tail. The mesh should be defined in a Rect3(-0.5, -0.5, 0.0, 1, 1, 1) where +z is direction of the arrow. Anything outside this box will extend outside the area designated to the arrow tail.
tailcolor
Defaults to automatic
Sets the color of the arrow tail. Defaults to color
taillength
Defaults to 0
Sets the length of the arrow tail. This length may get scaled down if the total arrow length exceeds the available space for the arrow. Setting this to 0 will result in no tail being drawn.
tailradius
Defaults to 0.15
Sets the width of the arrow tail. This width may get scaled down if the total arrow length exceeds the available space for the arrow.
tip
Defaults to Cone(Point3f(0, 0, 0), Point3f(0, 0, 1), 0.5)
Sets the mesh of the arrow tip. The mesh should be defined in a Rect3(-0.5, -0.5, 0.0, 1, 1, 1) where +z is direction of the arrow. Anything outside this box will extend outside the area designated to the arrow tip.
tipcolor
Defaults to automatic
Sets the color of the arrow tip. Defaults to color
tiplength
Defaults to 0.4
Sets the length of the arrow tip. This length may get scaled down if the total arrow length exceeds the available space for the arrow. Setting this to 0 will result in no tip being drawn.
tipradius
Defaults to 0.15
Sets the width of the arrow tip. This width may get scaled down if the total arrow length exceeds the available space for the arrow.
transformation
Defaults to :automatic
No docs available.
transparency
Defaults to false
Adjusts how the plot deals with transparency. In GLMakie transparency = true results in using Order Independent Transparency.
visible
Defaults to true
Controls whether the plot will be rendered or not.