band
Makie.band Function
band(x, ylower, yupper; kwargs...)
band(lower, upper; kwargs...)
band(x, lowerupper; kwargs...)
Plots a band from ylower to yupper along x. The form band(lower, upper) plots a ruled surface between the points in lower and upper. Both bounds can be passed together as lowerupper, a vector of intervals.
Plot type
The plot type alias for the band function is Band.
Examples
using CairoMakie
f = Figure()
Axis(f[1, 1])

xs = 1:0.2:10
ys_low = -0.2 .* sin.(xs) .- 0.25
ys_high = 0.2 .* sin.(xs) .+ 0.25

band!(xs, ys_low, ys_high)
band!(xs, ys_low .- 1, ys_high .-1, color = :red)

f
using CairoMakie
using Statistics

f = Figure()
Axis(f[1, 1])

n, m = 100, 101
t = range(0, 1, length=m)
X = cumsum(randn(n, m), dims = 2)
X = X .- X[:, 1]
μ = vec(mean(X, dims=1)) # mean
lines!(t, μ)              # plot mean line
σ = vec(std(X, dims=1))  # stddev
band!(t, μ + σ, μ - σ)   # plot stddev band
f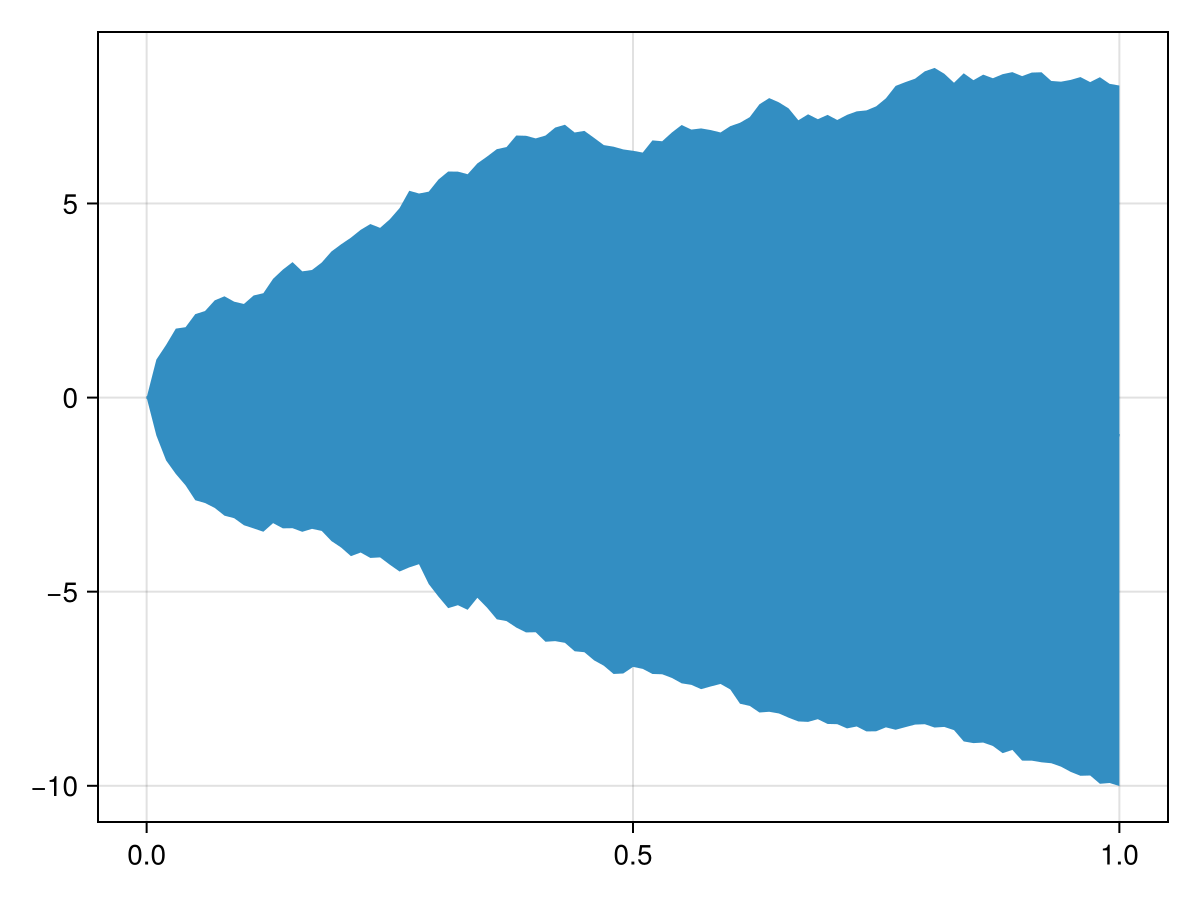
using GLMakie
lower = fill(Point3f(0,0,0), 100)
upper = [Point3f(sin(x), cos(x), 1.0) for x in range(0,2pi, length=100)]
col = repeat([1:50;50:-1:1],outer=2)
band(lower, upper, color=col, axis=(type=Axis3,))
Attributes
alpha
Defaults to 1.0
The alpha value of the colormap or color attribute. Multiple alphas like in plot(alpha=0.2, color=(:red, 0.5), will get multiplied.
backlight
Defaults to 0.0
Sets a weight for secondary light calculation with inverted normals.
clip_planes
Defaults to @inherit clip_planes automatic
Clip planes offer a way to do clipping in 3D space. You can set a Vector of up to 8 Plane3f planes here, behind which plots will be clipped (i.e. become invisible). By default clip planes are inherited from the parent plot or scene. You can remove parent clip_planes by passing Plane3f[].
color
Defaults to @inherit patchcolor
Sets the color of the mesh. Can be a Vector{<:Colorant} for per vertex colors or a single Colorant. A Matrix{<:Colorant} can be used to color the mesh with a texture, which requires the mesh to contain texture coordinates. A <: AbstractPattern can be used to apply a repeated, pixel sampled pattern to the mesh, e.g. for hatching.
colormap
Defaults to @inherit colormap :viridis
Sets the colormap that is sampled for numeric colors. PlotUtils.cgrad(...), Makie.Reverse(any_colormap) can be used as well, or any symbol from ColorBrewer or PlotUtils. To see all available color gradients, you can call Makie.available_gradients().
colorrange
Defaults to automatic
The values representing the start and end points of colormap.
colorscale
Defaults to identity
The color transform function. Can be any function, but only works well together with Colorbar for identity, log, log2, log10, sqrt, logit, Makie.pseudolog10 and Makie.Symlog10.
cycle
Defaults to [:color => :patchcolor]
No docs available.
depth_shift
Defaults to 0.0
Adjusts the depth value of a plot after all other transformations, i.e. in clip space, where -1 <= depth <= 1. This only applies to GLMakie and WGLMakie and can be used to adjust render order (like a tunable overdraw).
diffuse
Defaults to 1.0
Sets how strongly the red, green and blue channel react to diffuse (scattered) light.
direction
Defaults to :x
The direction of the band. If set to :y, x and y coordinates will be flipped, resulting in a vertical band. This setting applies only to 2D bands.
using CairoMakie
fig = Figure()
location = range(0, 4pi, length = 200)
lower =   cos.(location) .- location
upper = .-cos.(location) .+ location .+ 5
band(fig[1, 1], location, lower, upper,
    axis = (; title = "direction = :x"))
band(fig[1, 2], location, lower, upper, direction = :y,
    axis = (; title = "direction = :y"))
fig
fxaa
Defaults to true
Adjusts whether the plot is rendered with fxaa (anti-aliasing, GLMakie only).
highclip
Defaults to automatic
The color for any value above the colorrange.
inspectable
Defaults to @inherit inspectable
Sets whether this plot should be seen by DataInspector. The default depends on the theme of the parent scene.
inspector_clear
Defaults to automatic
Sets a callback function (inspector, plot) -> ... for cleaning up custom indicators in DataInspector.
inspector_hover
Defaults to automatic
Sets a callback function (inspector, plot, index) -> ... which replaces the default show_data methods.
inspector_label
Defaults to automatic
Sets a callback function (plot, index, position) -> string which replaces the default label generated by DataInspector.
interpolate
Defaults to true
sets whether colors should be interpolated
lowclip
Defaults to automatic
The color for any value below the colorrange.
matcap
Defaults to nothing
No docs available.
material
Defaults to nothing
RPRMakie only attribute to set complex RadeonProRender materials. Warning, how to set an RPR material may change and other backends will ignore this attribute
model
Defaults to automatic
Sets a model matrix for the plot. This overrides adjustments made with translate!, rotate! and scale!.
nan_color
Defaults to :transparent
The color for NaN values.
overdraw
Defaults to false
Controls if the plot will draw over other plots. This specifically means ignoring depth checks in GL backends
shading
Defaults to NoShading
Controls if the plot object is shaded by the parent scenes lights or not. The lighting algorithm used is controlled by the scenes shading attribute.
shininess
Defaults to 32.0
Sets how sharp the reflection is.
space
Defaults to :data
Sets the transformation space for box encompassing the plot. See Makie.spaces() for possible inputs.
specular
Defaults to 0.2
Sets how strongly the object reflects light in the red, green and blue channels.
ssao
Defaults to false
Adjusts whether the plot is rendered with ssao (screen space ambient occlusion). Note that this only makes sense in 3D plots and is only applicable with fxaa = true.
transformation
Defaults to :automatic
No docs available.
transparency
Defaults to false
Adjusts how the plot deals with transparency. In GLMakie transparency = true results in using Order Independent Transparency.
uv_transform
Defaults to automatic
Sets a transform for uv coordinates, which controls how a texture is mapped to a mesh. The attribute can be I, scale::VecTypes{2}, (translation::VecTypes{2}, scale::VecTypes{2}), any of :rotr90, :rotl90, :rot180, :swap_xy/:transpose, :flip_x, :flip_y, :flip_xy, or most generally a Makie.Mat{2, 3, Float32} or Makie.Mat3f as returned by Makie.uv_transform(). They can also be changed by passing a tuple (op3, op2, op1).
visible
Defaults to true
Controls whether the plot will be rendered or not.