bracket
Makie.bracket Function
bracket(x1, y1, x2, y2; kwargs...)
bracket(x1s, y1s, x2s, y2s; kwargs...)
bracket(point1, point2; kwargs...)
bracket(vec_of_point_tuples; kwargs...)
Draws a bracket between each pair of points (x1, y1) and (x2, y2) with a text label at the midpoint.
By default each label is rotated parallel to the line between the bracket points.
Plot type
The plot type alias for the bracket function is Bracket.
Examples
Scalar arguments
using CairoMakie
f, ax, l = lines(0..9, sin; axis = (; xgridvisible = false, ygridvisible = false))
ylims!(ax, -1.5, 1.5)

bracket!(pi/2, 1, 5pi/2, 1, offset = 5, text = "Period length", style = :square)

bracket!(pi/2, 1, pi/2, -1, text = "Amplitude", orientation = :down,
    linestyle = :dash, rotation = 0, align = (:right, :center), textoffset = 4, linewidth = 2, color = :red, textcolor = :red)

bracket!(2.3, sin(2.3), 4.0, sin(4.0),
    text = "Falling", offset = 10, orientation = :up, color = :purple, textcolor = :purple)

bracket!(Point(5.5, sin(5.5)), Point(7.0, sin(7.0)),
    text = "Rising", offset = 10, orientation = :down, color = :orange, textcolor = :orange,
    fontsize = 30, textoffset = 30, width = 50)
f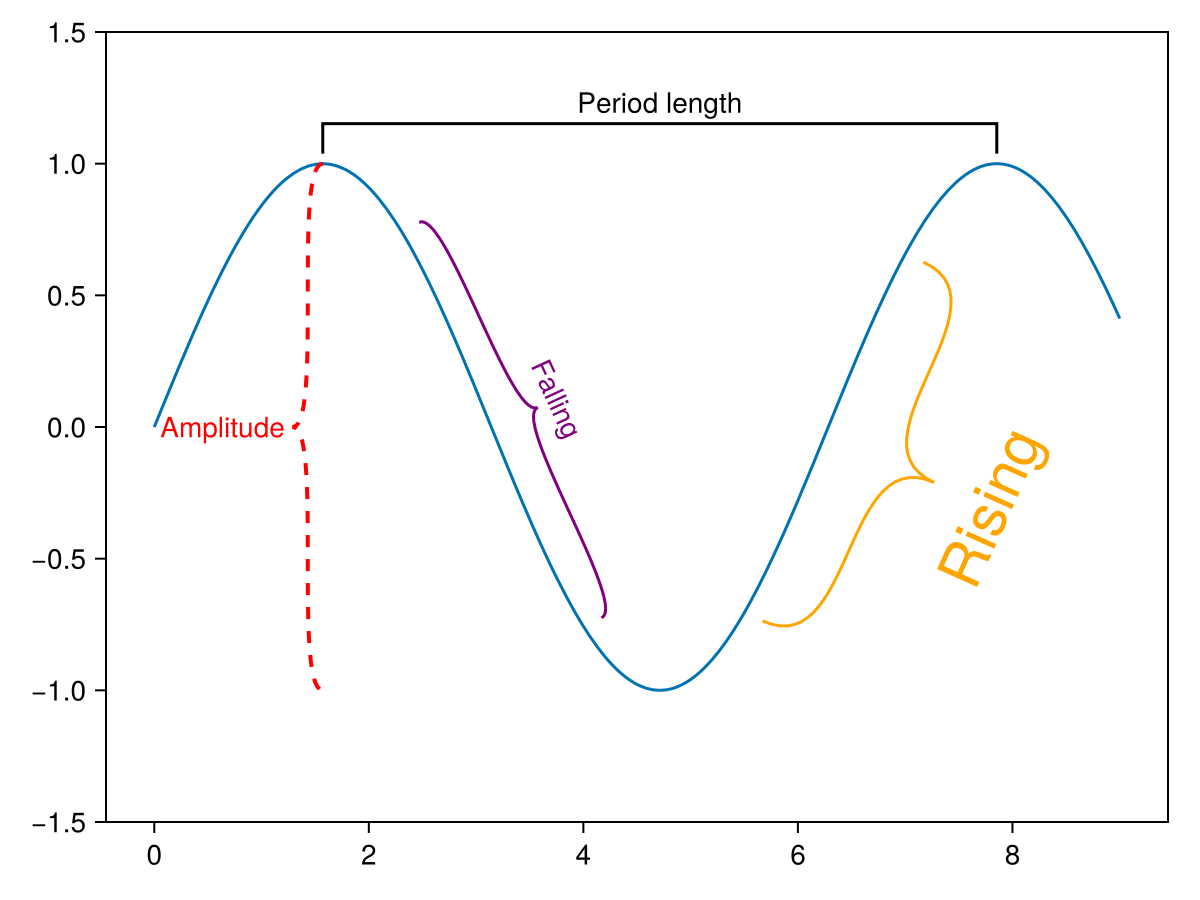
Vector arguments
using CairoMakie
f = Figure()
ax = Axis(f[1, 1])

bracket!(ax,
    1:5,
    2:6,
    3:7,
    2:6,
    text = ["A", "B", "C", "D", "E"],
    orientation = :down,
)

bracket!(ax,
    [(Point2f(i, i-0.7), Point2f(i+2, i-0.7)) for i in 1:5],
    text = ["F", "G", "H", "I", "J"],
    color = [:red, :blue, :green, :orange, :brown],
    linestyle = [:dash, :dot, :dash, :dot, :dash],
    orientation = [:up, :down, :up, :down, :up],
    textcolor = [:red, :blue, :green, :orange, :brown],
    fontsize = range(12, 24, length = 5),
)

f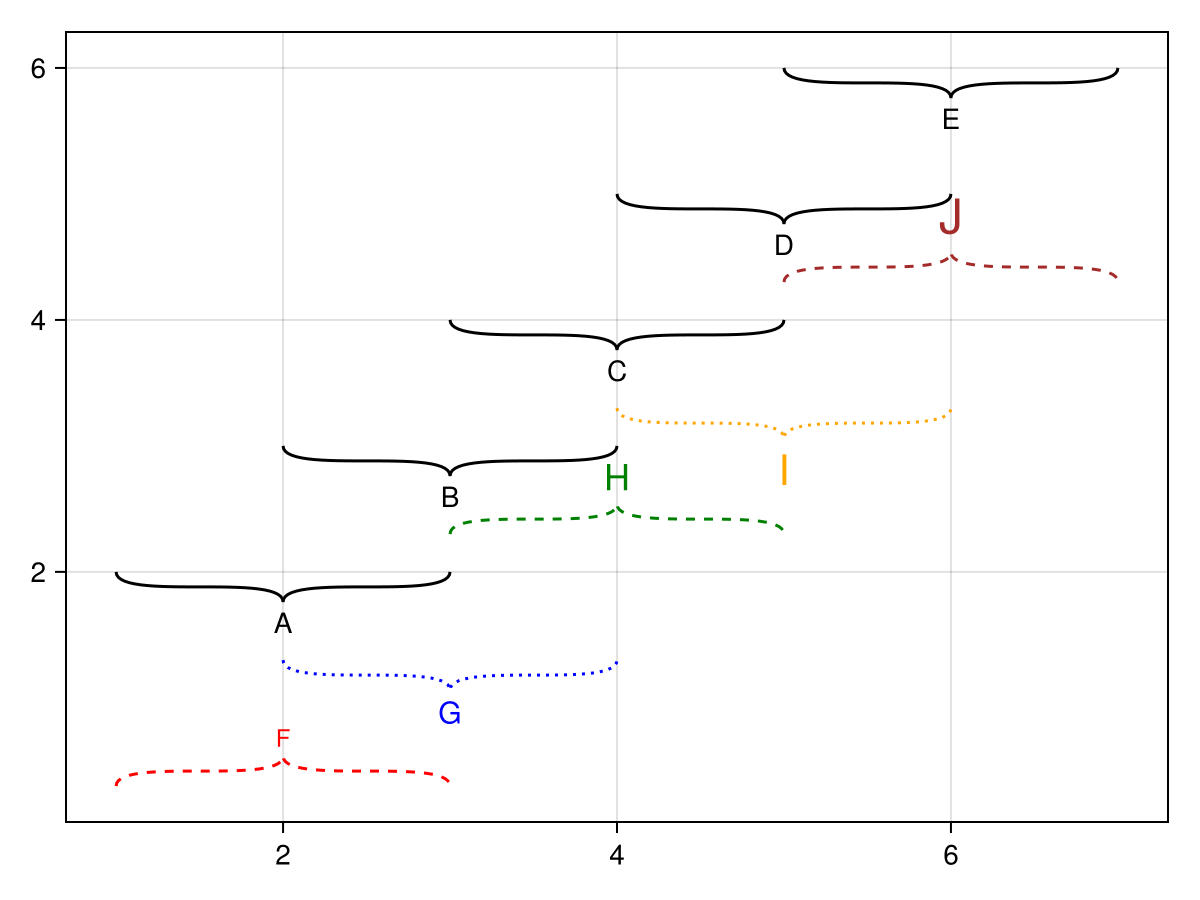
Styles
using CairoMakie
f = Figure()
ax = Axis(f[1, 1], xgridvisible = false, ygridvisible = false)
ylims!(ax, -1, 2)
bracket!(ax, 1, 0, 3, 0, text = "Curly", style = :curly)
bracket!(ax, 2, 1, 4, 1, text = "Square", style = :square)

f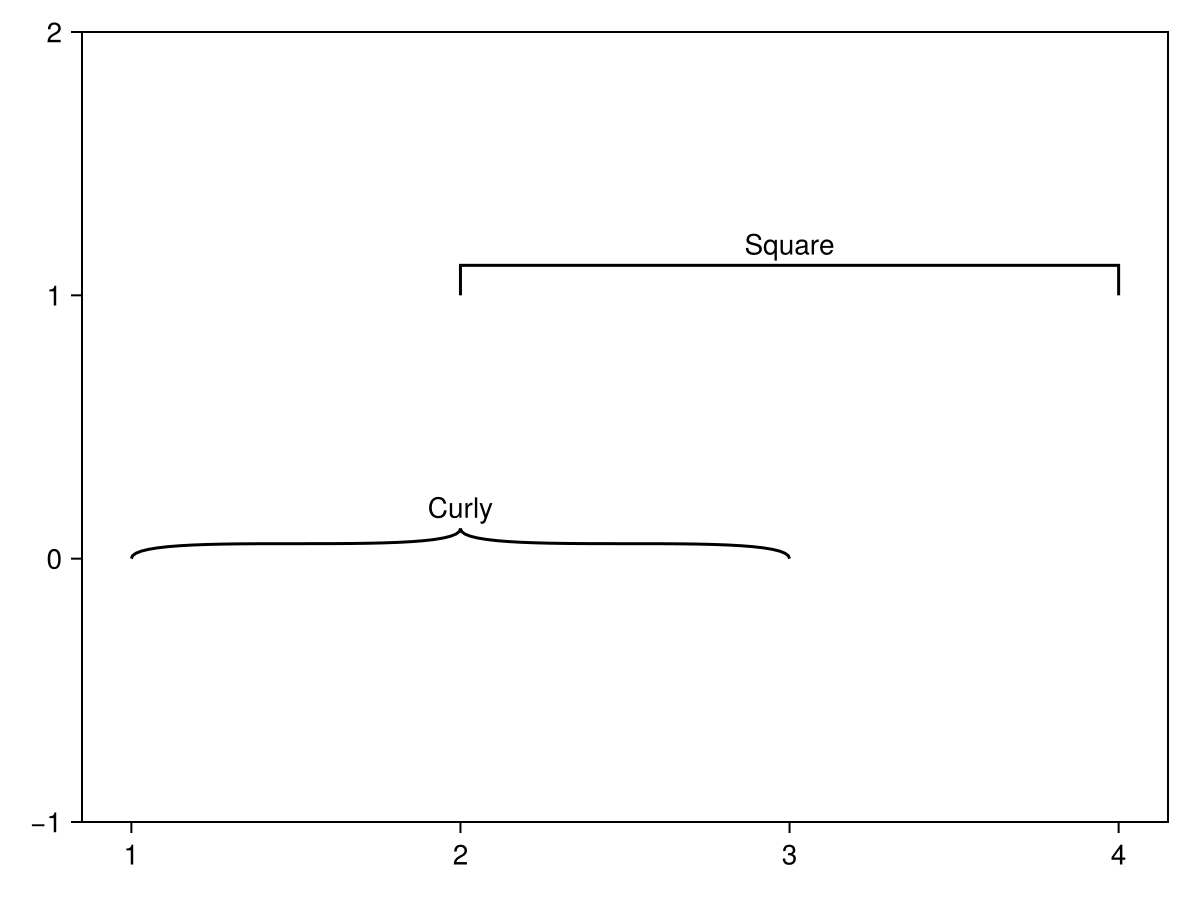
Attributes
align
Defaults to (:center, :center)
The alignment of text.
color
Defaults to @inherit linecolor
Sets the color of the bracket line.
font
Defaults to @inherit font
The font used for text.
fontsize
Defaults to @inherit fontsize
Sets the fontsize of text
joinstyle
Defaults to @inherit joinstyle
Controls the rendering at line corners. Options are :miter for sharp corners, :bevel for cut-off corners, and :round for rounded corners. If the corner angle is below miter_limit, :miter is equivalent to :bevel to avoid long spikes.
justification
Defaults to automatic
Sets the justification of multi-line text.
linecap
Defaults to @inherit linecap
Sets the type of line cap used for bracket lines. Options are :butt (flat without extrusion), :square (flat with half a linewidth extrusion) or :round.
linestyle
Defaults to nothing
Sets the line pattern of the bracket line. See ?lines for more information.
linewidth
Defaults to @inherit linewidth
Sets the width of the bracket line.
miter_limit
Defaults to @inherit miter_limit
" Sets the minimum inner line join angle below which miter joins truncate. See also Makie.miter_distance_to_angle.
offset
Defaults to 0
The offset of the bracket perpendicular to the line from start to end point in screen units. The direction depends on the orientation attribute.
orientation
Defaults to :up
Which way the bracket extends relative to the line from start to end point. Can be :up or :down.
rotation
Defaults to automatic
Sets the rotation of text. By default text is rotated to be parallel to the line from the start to end point of the bracket, and never upside-down.
space
Defaults to :data
Sets the space for the start and end points of brackets.
style
Defaults to :curly
Sets the style of drawn bracket. The current options are :curly for curly braces } and :square for brackets ]. More bracket types can be implemented by providing a method of Makie.bracket_bezierpath(...), see ?Makie.bracket_bezierpath.
text
Defaults to ""
The text(s) displayed at the center of the bracket(s).
textcolor
Defaults to @inherit textcolor
Sets the color of the text.
textoffset
Defaults to automatic
Undirected offset between text and the center of the bracket. By default this is set to 75% of the fontsize. The direction of the offset is always perpendicular to the line from the start to the end point.
width
Defaults to 15
The width of the bracket (perpendicularly away from the line from start to end point) in screen units.