scatter
scatter(positions)
scatter(x, y)
scatter(x, y, z)
Plots a marker for each element in
(x, y, z)
,
(x, y)
, or
positions
.
Attributes
Specific to
Scatter
-
cycle::Vector{Symbol} = [:color]sets which attributes to cycle when creating multiple plots. -
marker::Union{Symbol, Char, Matrix{<:Colorant}}sets the scatter marker. -
markersize::Union{<:Real, Vec2f} = 9sets the size of the marker. -
markerspace::Symbol = :pixelsets the space in whichmarkersizeis given. SeeMakie.spaces()for possible inputs. -
strokewidth::Real = 0sets the width of the outline around a marker. -
strokecolor::Union{Symbol, <:Colorant} = :blacksets the color of the outline around a marker. -
glowwidth::Real = 0sets the size of a glow effect around the marker. -
glowcolor::Union{Symbol, <:Colorant} = (:black, 0)sets the color of the glow effect. -
rotations::Union{Real, Billboard, Quaternion} = Billboard(0f0)sets the rotation of the marker. ABillboardrotation is always around the depth axis. -
transform_marker::Bool = falsecontrols whether the model matrix (without translation) applies to the marker itself, rather than just the positions. (If this is true,scale!androtate!will affect the marker.)
Generic
-
visible::Bool = truesets whether the plot will be rendered or not. -
overdraw::Bool = falsesets whether the plot will draw over other plots. This specifically means ignoring depth checks in GL backends. -
transparency::Bool = falseadjusts how the plot deals with transparency. In GLMakietransparency = trueresults in using Order Independent Transparency. -
fxaa::Bool = falseadjusts whether the plot is rendered with fxaa (anti-aliasing). Note that scatter plots already include a different form of anti-aliasing when plotting non-image markers. -
inspectable::Bool = truesets whether this plot should be seen byDataInspector. -
depth_shift::Float32 = 0f0adjusts the depth value of a plot after all other transformations, i.e. in clip space, where0 <= depth <= 1. This only applies to GLMakie and WGLMakie and can be used to adjust render order (like a tunable overdraw). -
model::Makie.Mat4fsets a model matrix for the plot. This replaces adjustments made withtranslate!,rotate!andscale!. -
colorsets the color of the plot. It can be given as a named colorSymbolor aColors.Colorant. Transparency can be included either directly as an alpha value in theColorantor as an additional float in a tuple(color, alpha). The color can also be set for each scattered marker by passing aVectorof colors or be used to index thecolormapby passing aRealnumber orVector{<: Real}. -
colormap::Union{Symbol, Vector{<:Colorant}} = :viridissets the colormap that is sampled for numericcolors. -
colorrange::Tuple{<:Real, <:Real}sets the values representing the start and end points ofcolormap. -
nan_color::Union{Symbol, <:Colorant} = RGBAf(0,0,0,0)sets a replacement color forcolor = NaN. -
space::Symbol = :datasets the transformation space for positions of markers. SeeMakie.spaces()for possible inputs.
Examples
Using x and y vectors
Scatters can be constructed by passing a list of x and y coordinates.
using CairoMakie

xs = range(0, 10, length = 30)
ys = 0.5 .* sin.(xs)

scatter(xs, ys)

Using points
It is also possible to pass coordinates as a vector of points, which is preferred if the coordinates should be updated later, to avoid different lengths of x and y.
Attributes like
color
and
markersize
can be set in scalar or vector form. If you pass a vector of numbers for
color
, the attribute
colorrange
which is by default automatically equal to the extrema of the color values, decides how colors are looked up in the
colormap
.
using CairoMakie

xs = range(0, 10, length = 30)
ys = 0.5 .* sin.(xs)
points = Point2f.(xs, ys)

scatter(points, color = 1:30, markersize = range(5, 30, length = 30),
    colormap = :thermal)

Available markers
As markers, you can use almost any unicode character. Currently, such glyphs are picked from the
TeX Gyre Heros Makie
font, because it offers a wide range of symbols. There is also a number of markers that can be referred to as a symbol, so that it's not necessary to find out the respective unicode character.
The backslash character examples have to be tab-completed in the REPL or editor so they are converted into unicode.
Note
The scatter markers have the same sizes that the glyphs in TeX Gyre Heros Makie have. This means that they are not matched in size or area. Currently, Makie does not have the option to use area matched markers, and sometimes manual adjustment might be necessary to achieve a good visual result.
using CairoMakie

markers_labels = [
    (:rect, ":rect"),
    (:star5, ":star5"),
    (:diamond, ":diamond"),
    (:hexagon, ":hexagon"),
    (:cross, ":cross"),
    (:xcross, ":xcross"),
    (:utriangle, ":utriangle"),
    (:dtriangle, ":dtriangle"),
    (:ltriangle, ":ltriangle"),
    (:rtriangle, ":rtriangle"),
    (:pentagon, ":pentagon"),
    (:star4, ":star4"),
    (:star8, ":star8"),
    (:vline, ":vline"),
    (:hline, ":hline"),
    (:x, ":x"),
    (:+, ":+"),
    (:circle, ":circle"),
    ('a', "'a'"),
    ('B', "'B'"),
    ('↑', "'\\uparrow'"),
    ('😄', "'\\:smile:'"),
    ('✈', "'\\:airplane:'"),
]

f = Figure()
ax = Axis(f[1, 1], yreversed = true,
    xautolimitmargin = (0.15, 0.15),
    yautolimitmargin = (0.15, 0.15)
)
hidedecorations!(ax)

for (i, (marker, label)) in enumerate(markers_labels)
    p = Point2f(fldmod1(i, 6)...)

    scatter!(p, marker = marker, markersize = 20, color = :black)
    text!(p, text = label, color = :gray70, offset = (0, 20),
        align = (:center, :bottom))
end

f

Marker rotation
Markers can be rotated using the
rotations
attribute, which also allows to pass a vector.
using CairoMakie

points = [Point2f(x, y) for y in 1:10 for x in 1:10]
rotations = range(0, 2pi, length = length(points))

scatter(points, rotations = rotations, markersize = 20, marker = '↑')

Vec markersize
You can scale x and y dimension of markers separately by passing a
Vec
.
using CairoMakie

f = Figure()
ax = Axis(f[1, 1])

scales = range(0.5, 1.5, length = 10)

for (i, sx) in enumerate(scales)
    for (j, sy) in enumerate(scales)
        scatter!(ax, Point2f(i, j),
            marker = '✈',
            markersize = 30 .* Vec2f(sx, sy),
            color = :black)
    end
end

f

Marker space
By default marker sizes are given in pixel units. You can change this by adjusting
markerspace
. For example, you can have a marker scaled in data units by setting
markerspace = :data
.
using CairoMakie

f = Figure()
ax = Axis(f[1, 1])
limits!(ax, -10, 10, -10, 10)

scatter!(ax, Point2f(0, 0), markersize = 20, markerspace = :data,
    marker = '✈', label = "markerspace = :data")
scatter!(ax, Point2f(0, 0), markersize = 20, markerspace = :pixel,
    marker = '✈', label = "markerspace = :pixel")

axislegend(ax)

f

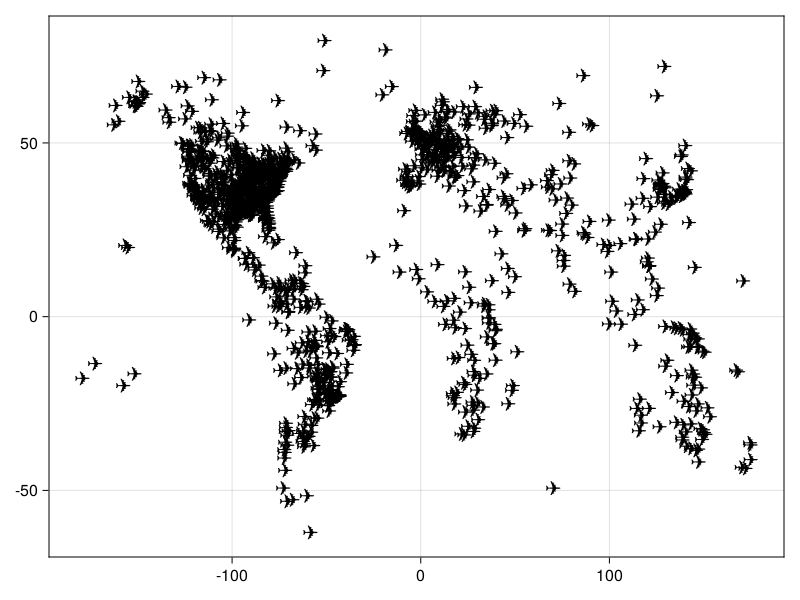
Airport locations example
using CairoMakie
using DelimitedFiles

a = readdlm(assetpath("airportlocations.csv"))

scatter(a[1:50:end, :], marker = '✈',
    markersize = 20, color = :black)
These docs were autogenerated using Makie: v0.17.13, GLMakie: v0.6.13, CairoMakie: v0.8.13, WGLMakie: v0.6.13