
pie
Makie.pie Function
pie(values; kwargs...)
pie(point, values; kwargs...)
pie(x, y, values; kwargs...)
Creates a pie chart from the given values.
Plot type
The plot type alias for the pie function is Pie.
Examples
using CairoMakie
data   = [36, 12, 68, 5, 42, 27]
colors = [:yellow, :orange, :red, :blue, :purple, :green]

f, ax, plt = pie(data,
                 color = colors,
                 radius = 4,
                 inner_radius = 2,
                 strokecolor = :white,
                 strokewidth = 5,
                 axis = (autolimitaspect = 1, )
                )

f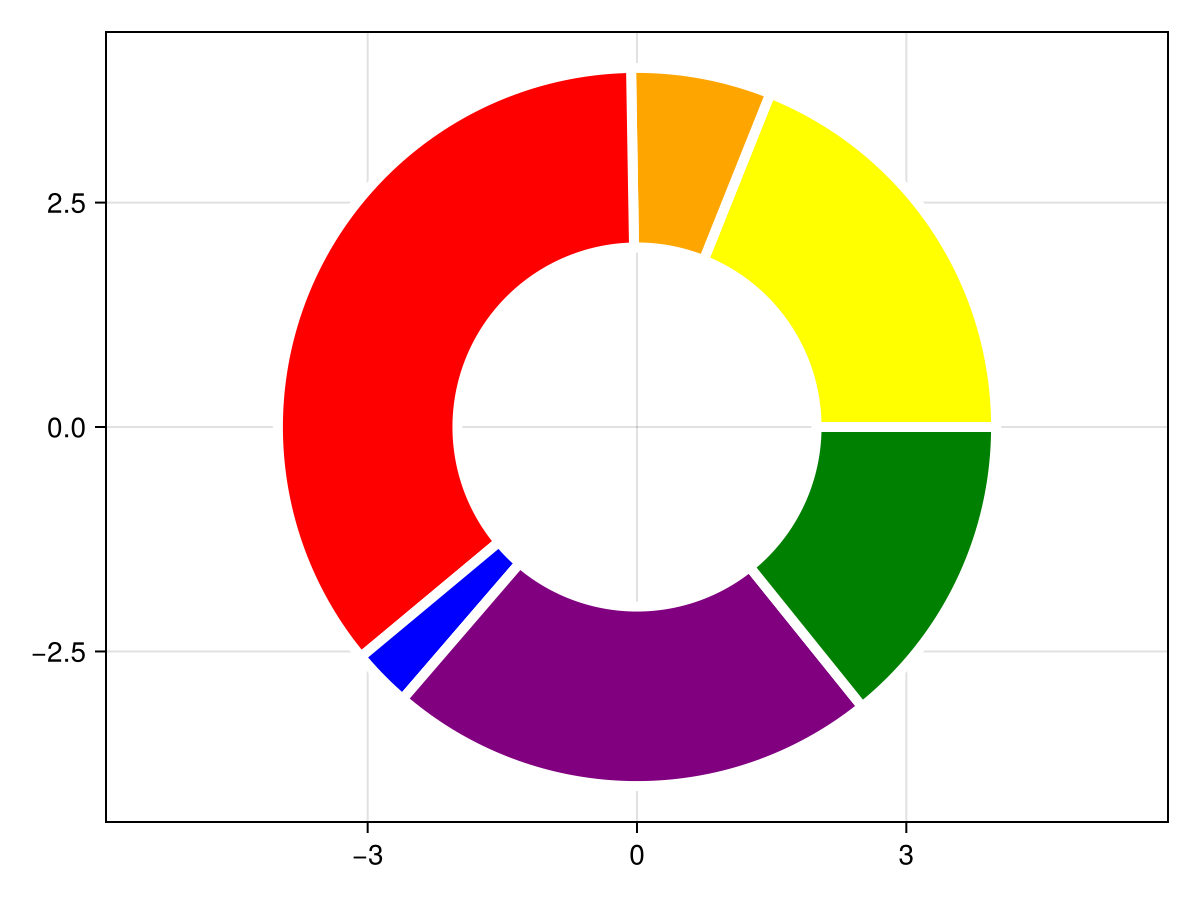
using CairoMakie
f, ax, plt = pie([π/2, 2π/3, π/4],
                normalize=false,
                offset = π/2,
                color = [:orange, :purple, :green],
                axis = (autolimitaspect = 1,)
                )

f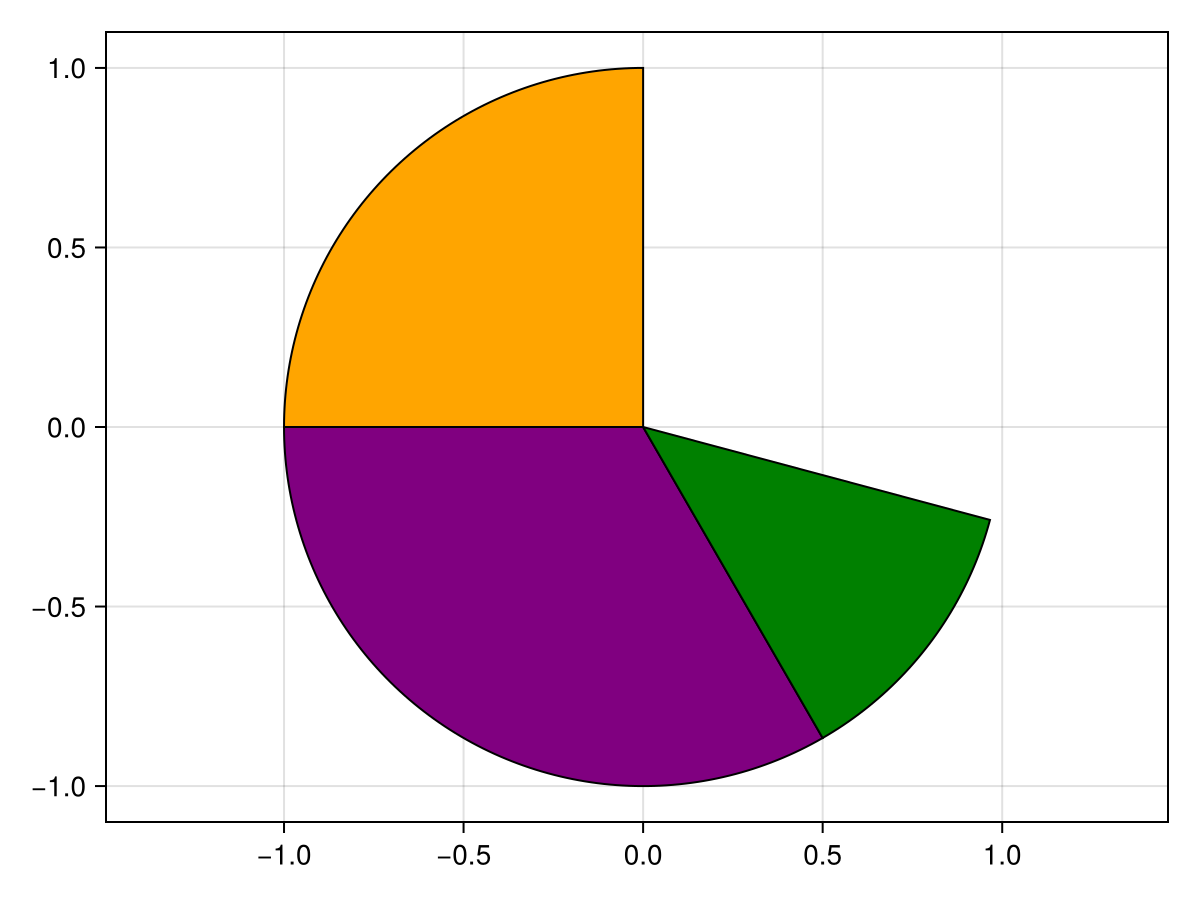
using CairoMakie
fig = Figure()
ax = Axis(fig[1, 1]; autolimitaspect=1)

kw = (; offset_radius=0.4, strokecolor=:transparent, strokewidth=0)
pie!(ax, ones(7); radius=sqrt.(2:8) * 3, kw..., color=Makie.wong_colors(0.8)[1:7])

vs = [2, 3, 4, 5, 6, 7, 8]
vs_inner = [1, 1, 1, 1, 2, 2, 2]
rs = 8
rs_inner = sqrt.(vs_inner ./ vs) * rs

lp = Makie.LinePattern(; direction=Makie.Vec2f(1, -1), width=2, tilesize=(12, 12), linecolor=:darkgrey, background_color=:transparent)
# draw the inner pie twice since `color` can not be vector of `LinePattern` currently
pie!(ax, 20, 0, vs; radius=rs_inner, inner_radius=0, kw..., color=Makie.wong_colors(0.4)[eachindex(vs)])
pie!(ax, 20, 0, vs; radius=rs_inner, inner_radius=0, kw..., color=lp)
pie!(ax, 20, 0, vs; radius=rs, inner_radius=rs_inner, kw..., color=Makie.wong_colors(0.8)[eachindex(vs)])

fig
┌ Warning: LinePattern(background_color = ...) has been deprecated in favor of LinePattern(backgroundcolor = ...)
└ @ Makie ~/work/Makie.jl/Makie.jl/src/patterns.jl:75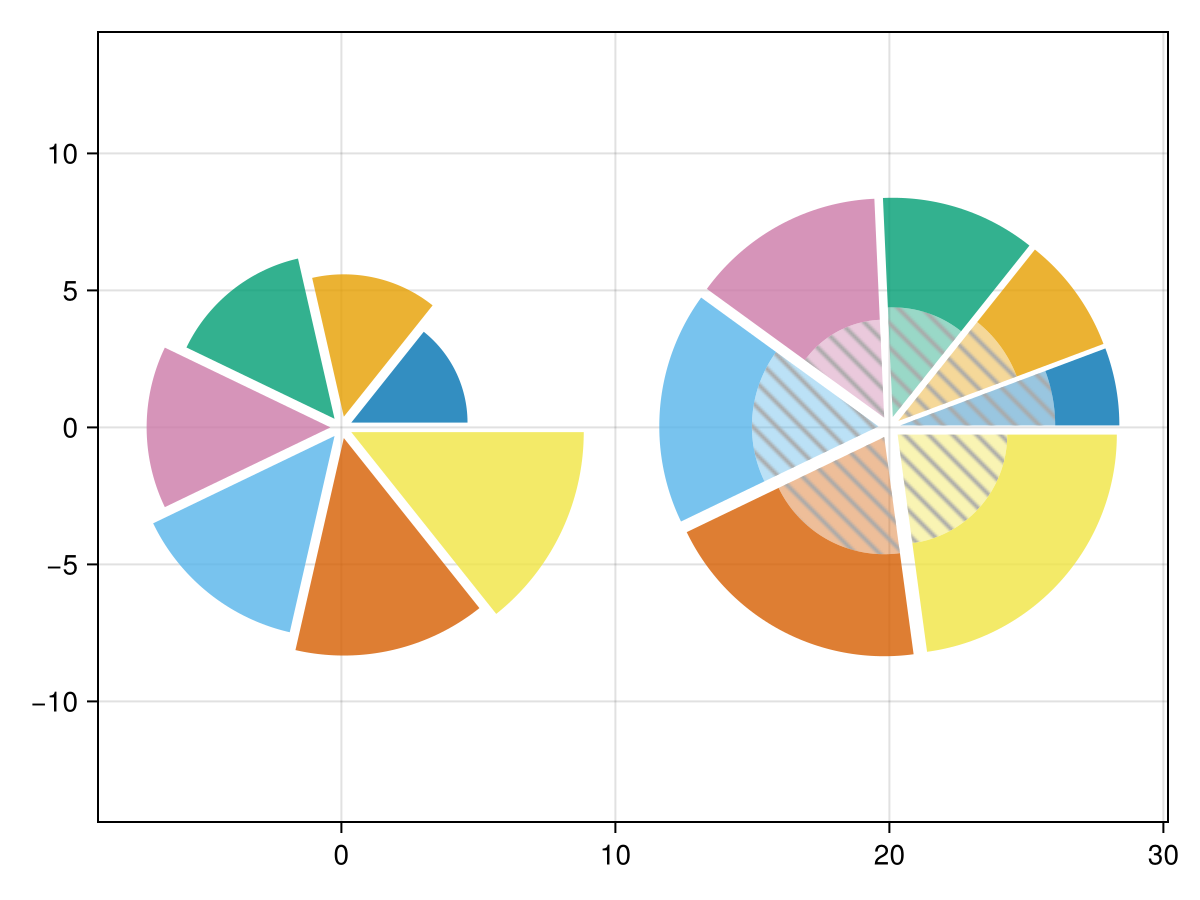
using CairoMakie
fig = Figure()
ax = Axis(fig[1, 1]; autolimitaspect=1)

vs = 0:6 |> Vector
vs_ = vs ./ sum(vs) .* (3/2*π)
cs = Makie.wong_colors()
Δx = [1, 1, 1, -1, -1, -1, 1] ./ 10
Δy = [1, 1, 1, 1, 1, -1, -1] ./ 10
Δr1 = [0, 0, 0.2, 0, 0.2, 0, 0]
Δr2 = [0, 0, 0.2, 0, 0, 0, 0]

pie!(ax, vs; color=cs)
pie!(ax, 3 .+ Δx, 0, vs; color=cs)
pie!(ax, 0, 3 .+ Δy, vs; color=cs)
pie!(ax, 3 .+ Δx, 3 .+ Δy, vs; color=cs)

pie!(ax, 7, 0, vs; color=cs, offset_radius=Δr1)
pie!(ax, 7, 3, vs; color=cs, offset_radius=0.2)
pie!(ax, 10 .+ Δx, 3 .+ Δy, vs; color=cs, offset_radius=0.2)
pie!(ax, 10, 0, vs_; color=cs, offset_radius=Δr1, normalize=false, offset=π/2)

pie!(ax, Point2(0.5, -3), vs_; color=cs, offset_radius=Δr2, normalize=false, offset=π/2)
pie!(ax, Point2.(3.5, -3 .+ Δy), vs_; color=cs, offset_radius=Δr2, normalize=false, offset=π/2)
pie!(ax, Point2.(6.5 .+ Δx, -3), vs_; color=cs, offset_radius=Δr2, normalize=false, offset=π/2)
pie!(ax, Point2.(9.5 .+ Δx, -3 .+ Δy), vs_; color=cs, offset_radius=Δr2, normalize=false, offset=π/2)

pie!(ax, 0.5, -6, vs_; inner_radius=0.2, color=cs, offset_radius=0.2, normalize=false, offset=π/2)
pie!(ax, 3.5, -6 .+ Δy, vs_; inner_radius=0.2, color=cs, offset_radius=0.2, normalize=false, offset=π/2)
pie!(ax, 6.5 .+ Δx, -6, vs_; inner_radius=0.2, color=cs, offset_radius=0.2, normalize=false, offset=π/2)
pie!(ax, 9.5 .+ Δx, -6 .+ Δy, vs_; inner_radius=0.2, color=cs, offset_radius=0.2, normalize=false, offset=π/2)

fig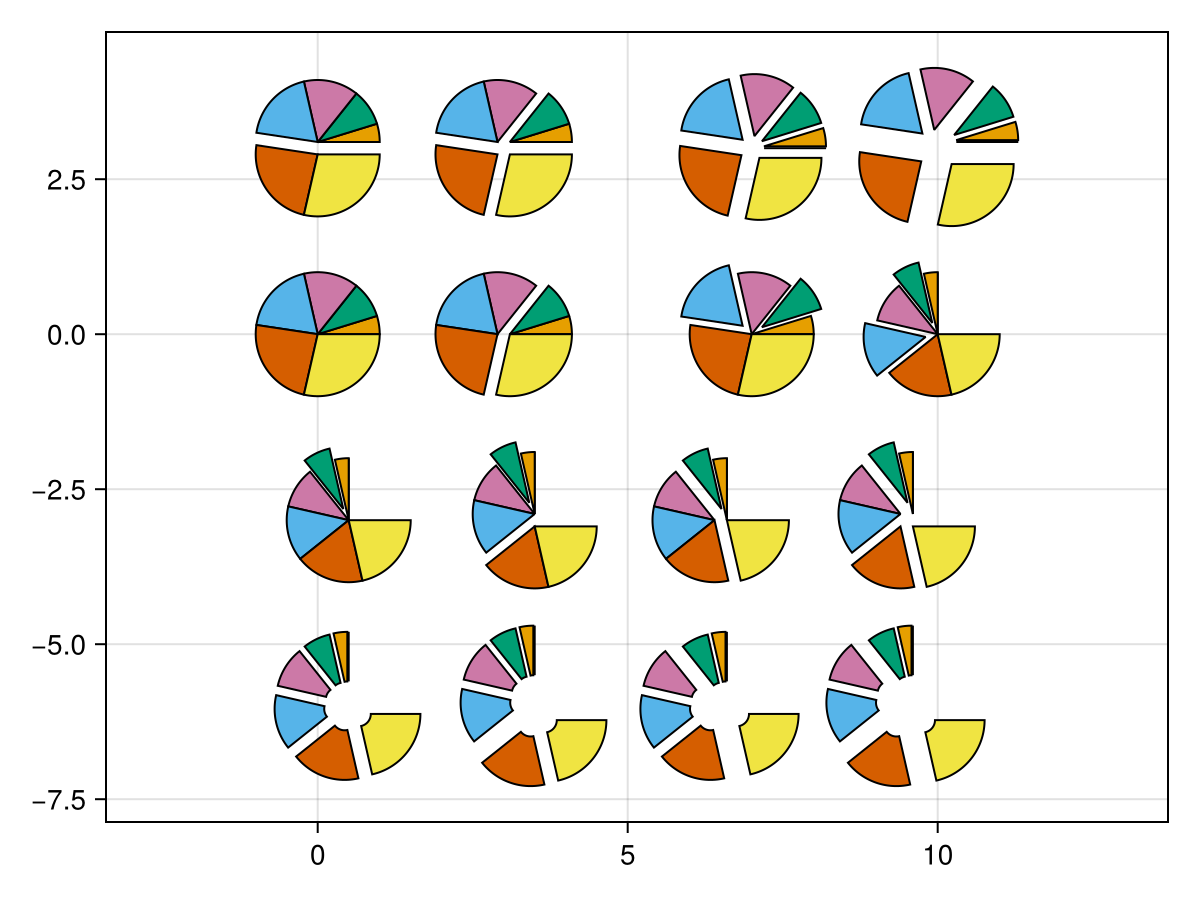
Attributes
clip_planes
Defaults to automatic
Clip planes offer a way to do clipping in 3D space. You can set a Vector of up to 8 Plane3f planes here, behind which plots will be clipped (i.e. become invisible). By default clip planes are inherited from the parent plot or scene. You can remove parent clip_planes by passing Plane3f[].
color
Defaults to :gray
No docs available.
depth_shift
Defaults to 0.0
Adjusts the depth value of a plot after all other transformations, i.e. in clip space, where -1 <= depth <= 1. This only applies to GLMakie and WGLMakie and can be used to adjust render order (like a tunable overdraw).
fxaa
Defaults to true
Adjusts whether the plot is rendered with fxaa (anti-aliasing, GLMakie only).
inner_radius
Defaults to 0
The inner radius of the pie segments. If this is larger than zero, the pie pieces become ring sections.
inspectable
Defaults to @inherit inspectable
Sets whether this plot should be seen by DataInspector. The default depends on the theme of the parent scene.
inspector_clear
Defaults to automatic
Sets a callback function (inspector, plot) -> ... for cleaning up custom indicators in DataInspector.
inspector_hover
Defaults to automatic
Sets a callback function (inspector, plot, index) -> ... which replaces the default show_data methods.
inspector_label
Defaults to automatic
Sets a callback function (plot, index, position) -> string which replaces the default label generated by DataInspector.
model
Defaults to automatic
Sets a model matrix for the plot. This overrides adjustments made with translate!, rotate! and scale!.
normalize
Defaults to true
If true, the sum of all values is normalized to 2π (a full circle).
offset
Defaults to 0
The angular offset of the first pie segment from the (1, 0) vector in radians.
offset_radius
Defaults to 0
The offset of each pie segment from the center along the radius
overdraw
Defaults to false
Controls if the plot will draw over other plots. This specifically means ignoring depth checks in GL backends
radius
Defaults to 1
The outer radius of the pie segments.
space
Defaults to :data
Sets the transformation space for box encompassing the plot. See Makie.spaces() for possible inputs.
ssao
Defaults to false
Adjusts whether the plot is rendered with ssao (screen space ambient occlusion). Note that this only makes sense in 3D plots and is only applicable with fxaa = true.
strokecolor
Defaults to :black
No docs available.
strokewidth
Defaults to 1
No docs available.
transformation
Defaults to :automatic
No docs available.
transparency
Defaults to false
Adjusts how the plot deals with transparency. In GLMakie transparency = true results in using Order Independent Transparency.
vertex_per_deg
Defaults to 1
Controls how many polygon vertices are used for one degree of rotation.
visible
Defaults to true
Controls whether the plot will be rendered or not.