hexbin
Makie.hexbin Function
hexbin(xs, ys; kwargs...)Plots a heatmap with hexagonal bins for the observations xs and ys.
Plot type
The plot type alias for the hexbin function is Hexbin.
Examples
Setting the number of bins
Setting bins to an integer sets the number of bins to this value for both x and y. The minimum number of bins in one dimension is 2.
using CairoMakie
using Random
Random.seed!(1234)

f = Figure(size = (800, 800))

x = rand(300)
y = rand(300)

for i in 2:5
    ax = Axis(f[fldmod1(i-1, 2)...], title = "bins = $i", aspect = DataAspect())
    hexbin!(ax, x, y, bins = i)
    wireframe!(ax, Rect2f(Point2f.(x, y)), color = :red)
    scatter!(ax, x, y, color = :red, markersize = 5)
end

f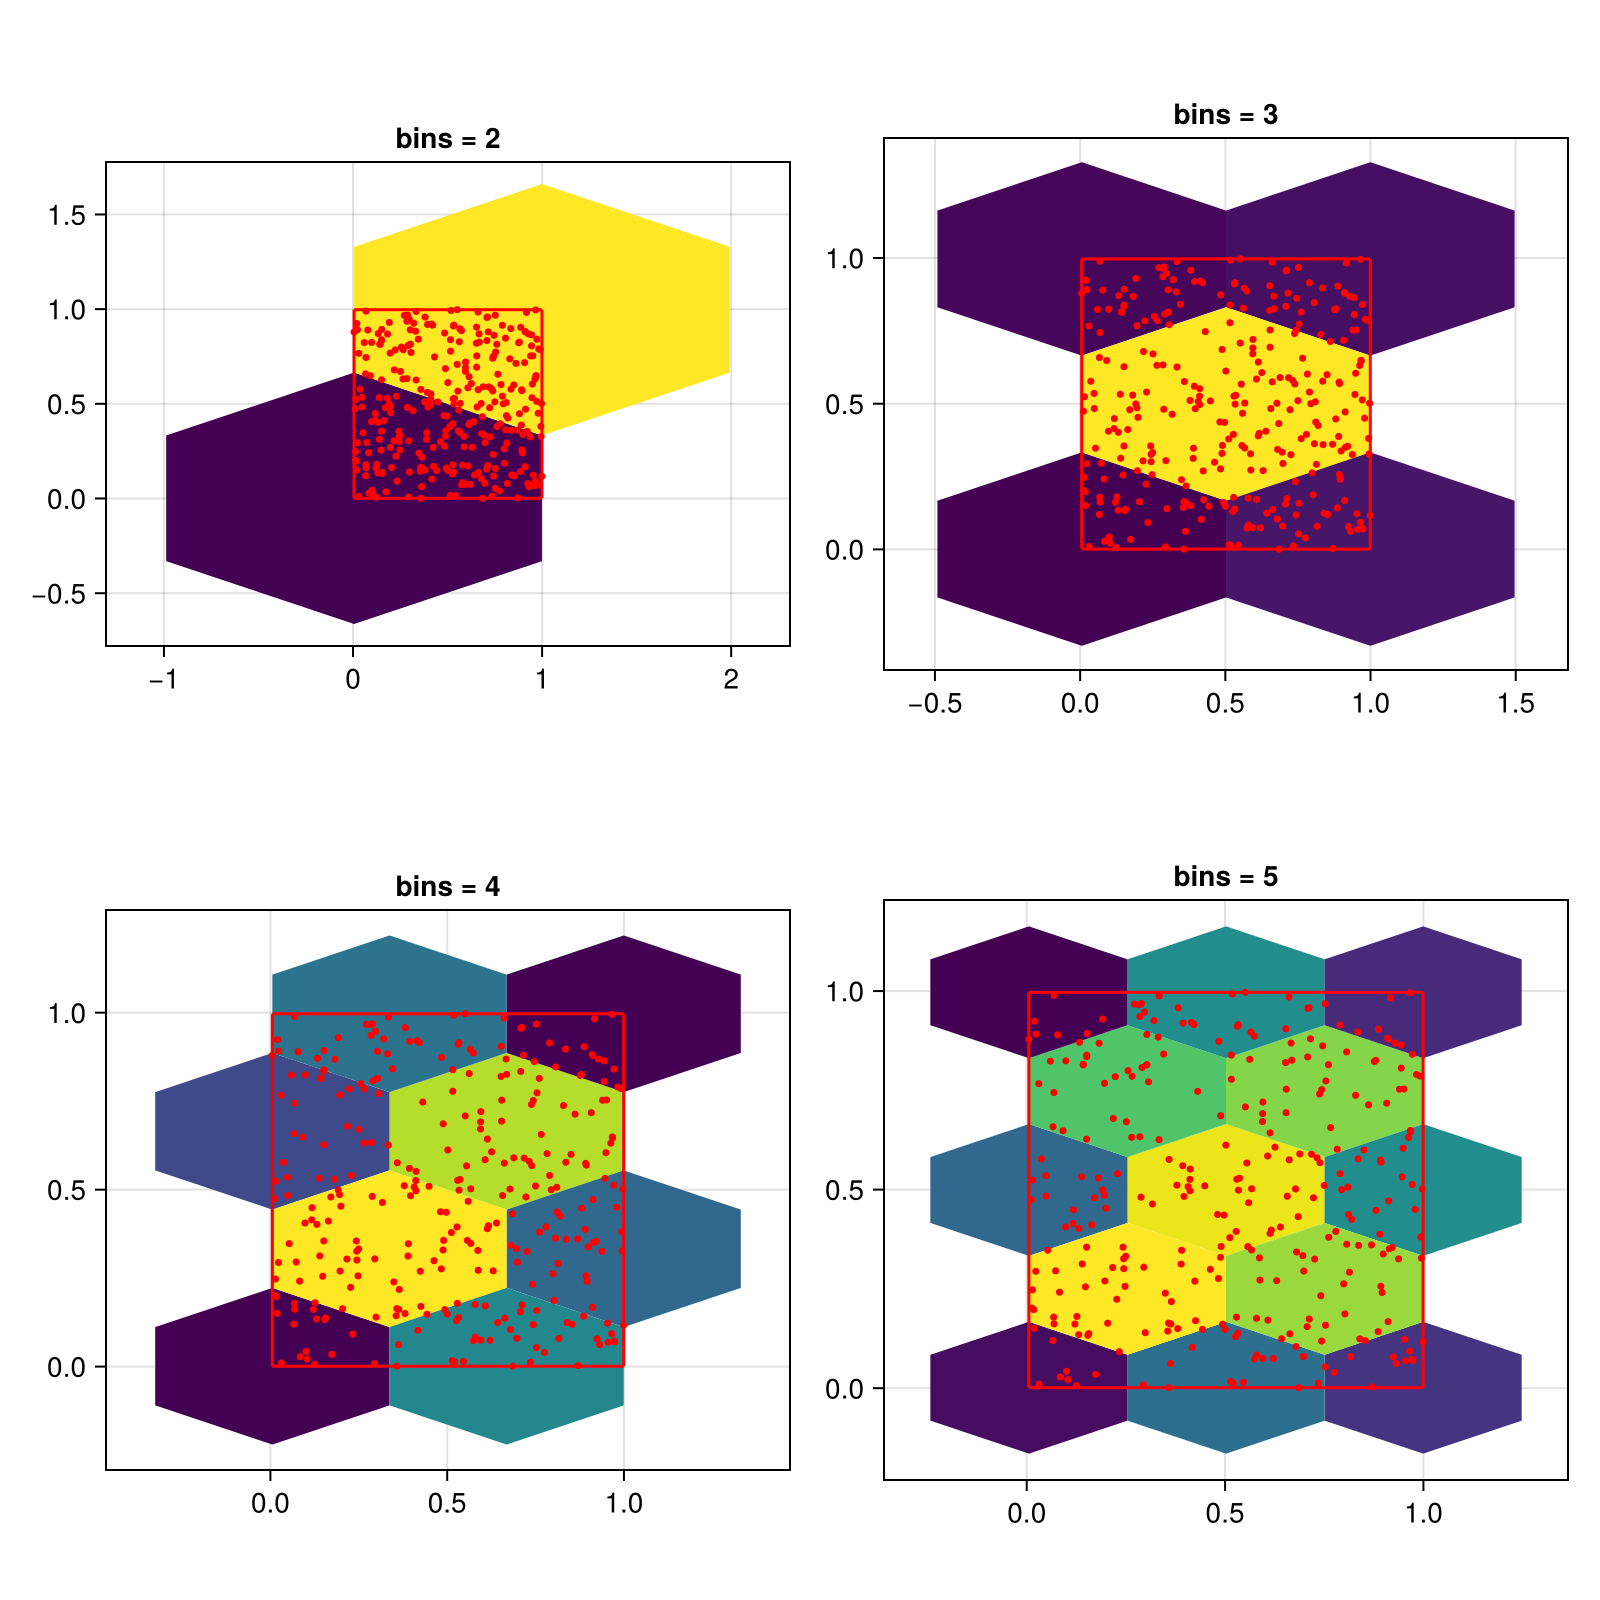
You can also pass a tuple of integers to control x and y separately.
using CairoMakie
using Random
Random.seed!(1234)

f = Figure(size = (800, 800))

x = rand(300)
y = rand(300)

for i in 2:5
    ax = Axis(f[fldmod1(i-1, 2)...], title = "bins = (3, $i)", aspect = DataAspect())
    hexbin!(ax, x, y, bins = (3, i))
    wireframe!(ax, Rect2f(Point2f.(x, y)), color = :red)
    scatter!(ax, x, y, color = :red, markersize = 5)
end

f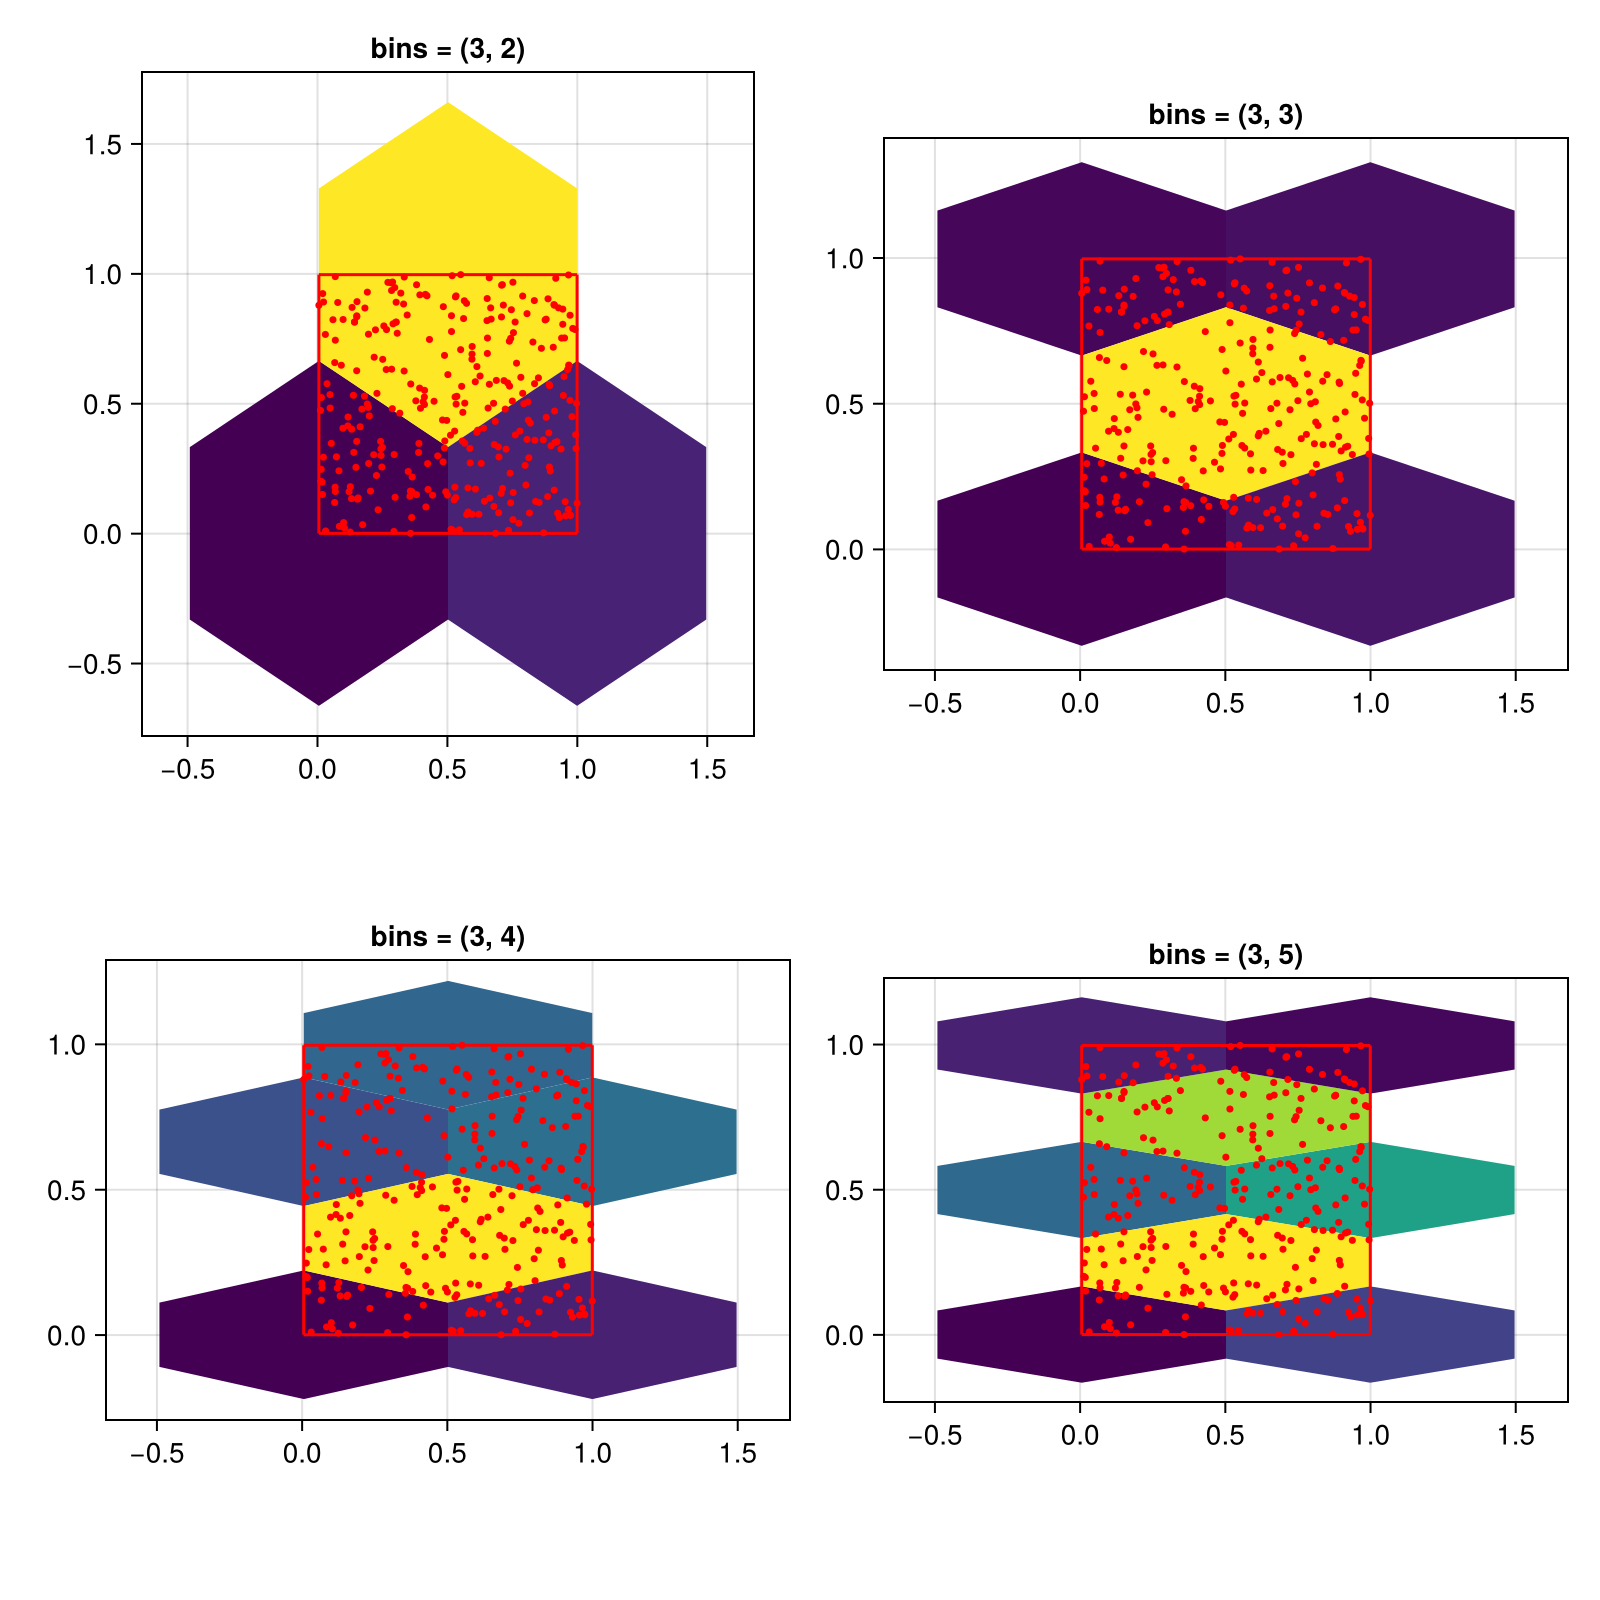
Setting the size of cells
You can also control the cell size directly by setting the cellsize keyword. In this case, the bins setting is ignored.
The height of a hexagon is larger than its width. This is why setting the same size for x and y will result in uneven hexagons.
using CairoMakie
using Random
Random.seed!(1234)

f = Figure(size = (800, 800))

x = rand(300)
y = rand(300)

for (i, cellsize) in enumerate([0.1, 0.15, 0.2, 0.25])
    ax = Axis(f[fldmod1(i, 2)...], title = "cellsize = ($cellsize, $cellsize)", aspect = DataAspect())
    hexbin!(ax, x, y, cellsize = (cellsize, cellsize))
    wireframe!(ax, Rect2f(Point2f.(x, y)), color = :red)
    scatter!(ax, x, y, color = :red, markersize = 5)
end

f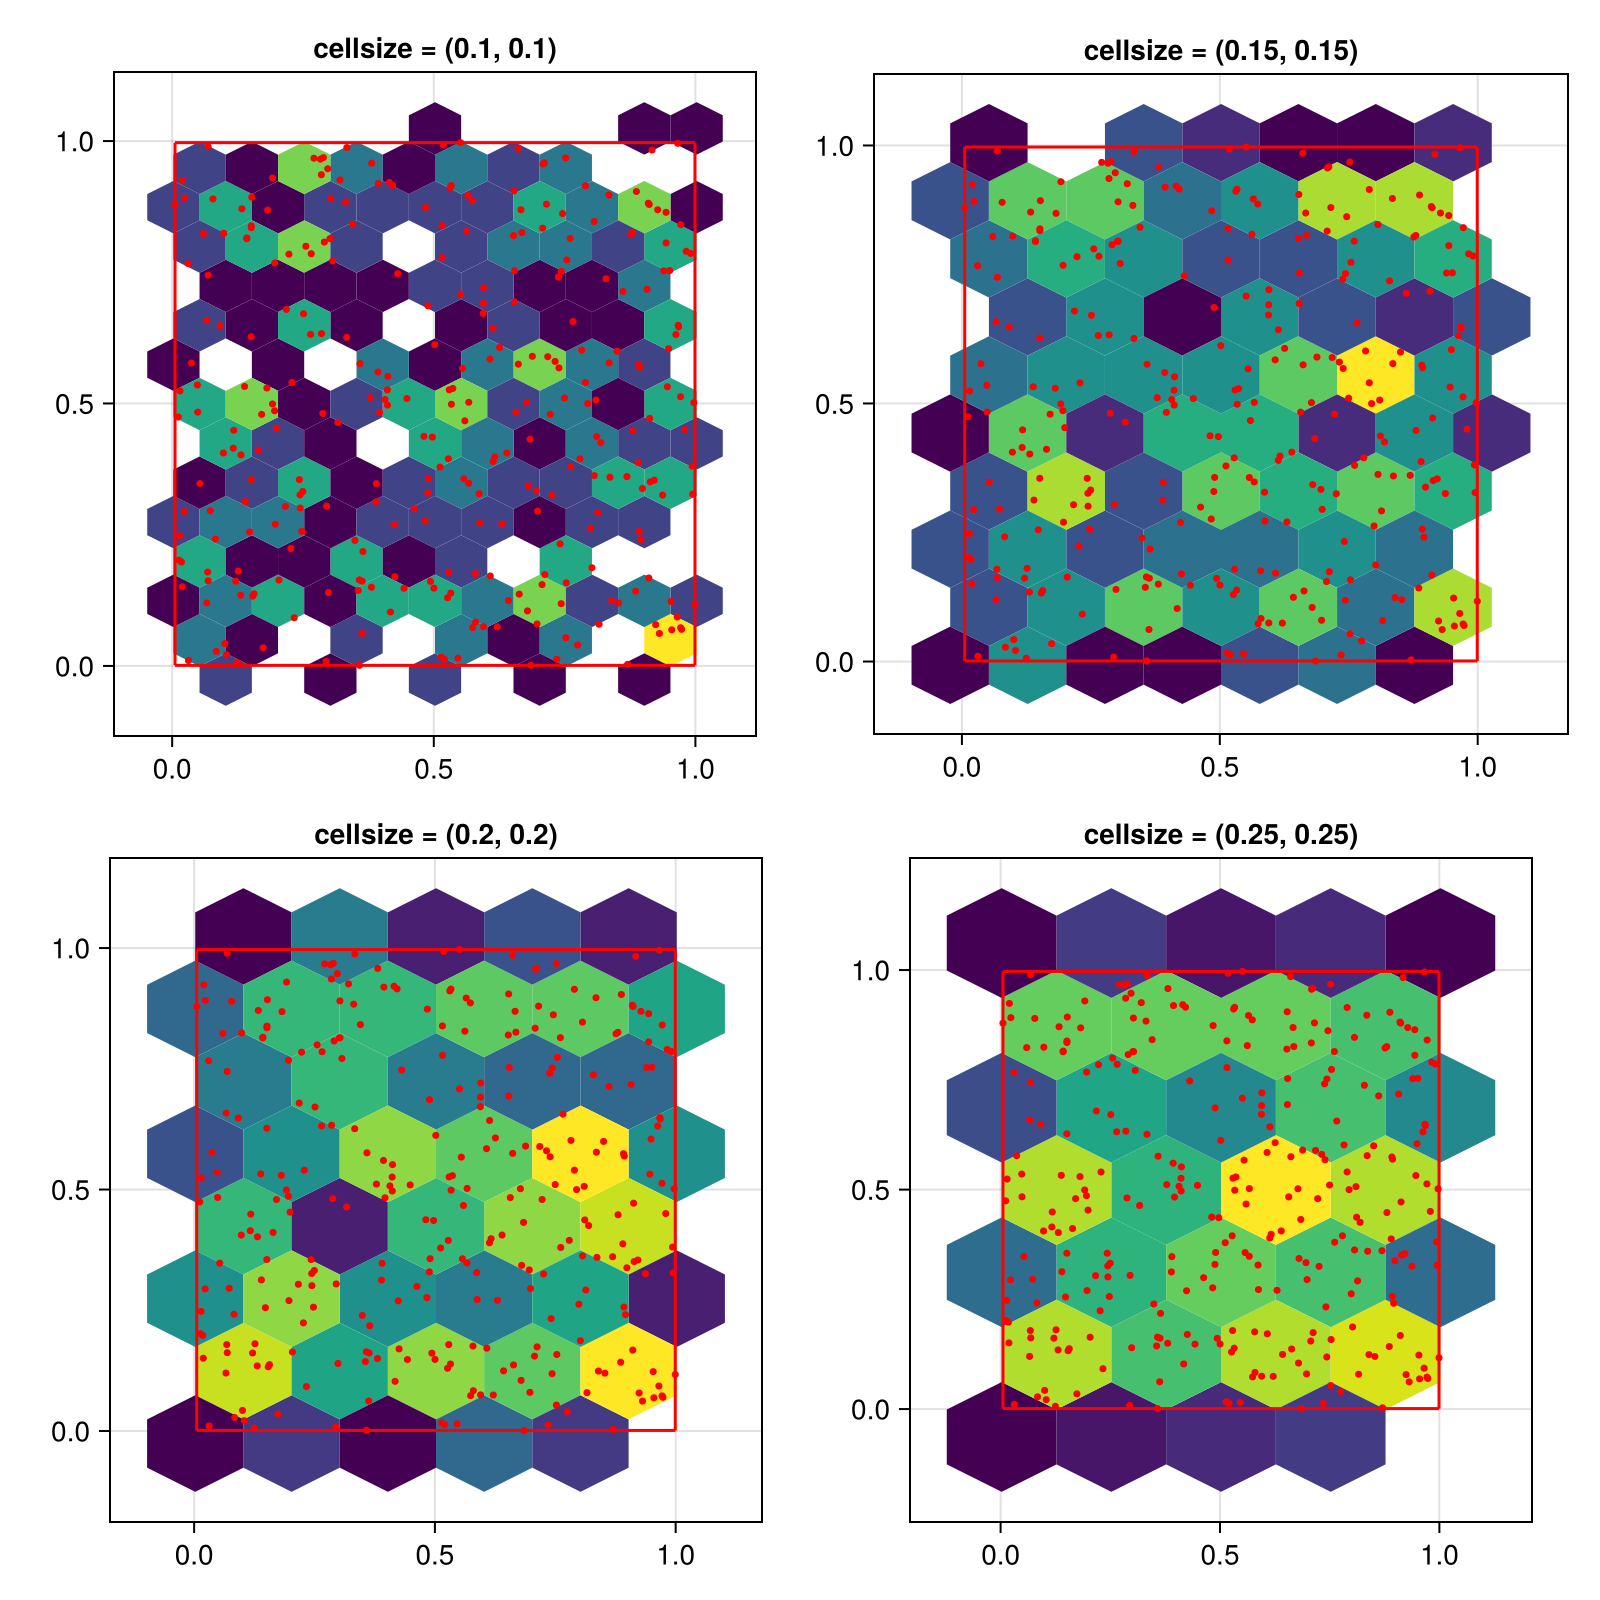
To get evenly sized hexagons, set the cell size to a single number. This number defines the cell width, the height will be computed as 2 * step_x / sqrt(3). Note that the visual appearance of the hexagons will only be even if the x and y axis have the same scaling, which is why we use aspect = DataAspect() in these examples.
using CairoMakie
using Random
Random.seed!(1234)

f = Figure(size = (800, 800))

x = rand(300)
y = rand(300)

for (i, cellsize) in enumerate([0.1, 0.15, 0.2, 0.25])
    ax = Axis(f[fldmod1(i, 2)...], title = "cellsize = $cellsize", aspect = DataAspect())
    hexbin!(ax, x, y, cellsize = cellsize)
    wireframe!(ax, Rect2f(Point2f.(x, y)), color = :red)
    scatter!(ax, x, y, color = :red, markersize = 5)
end

f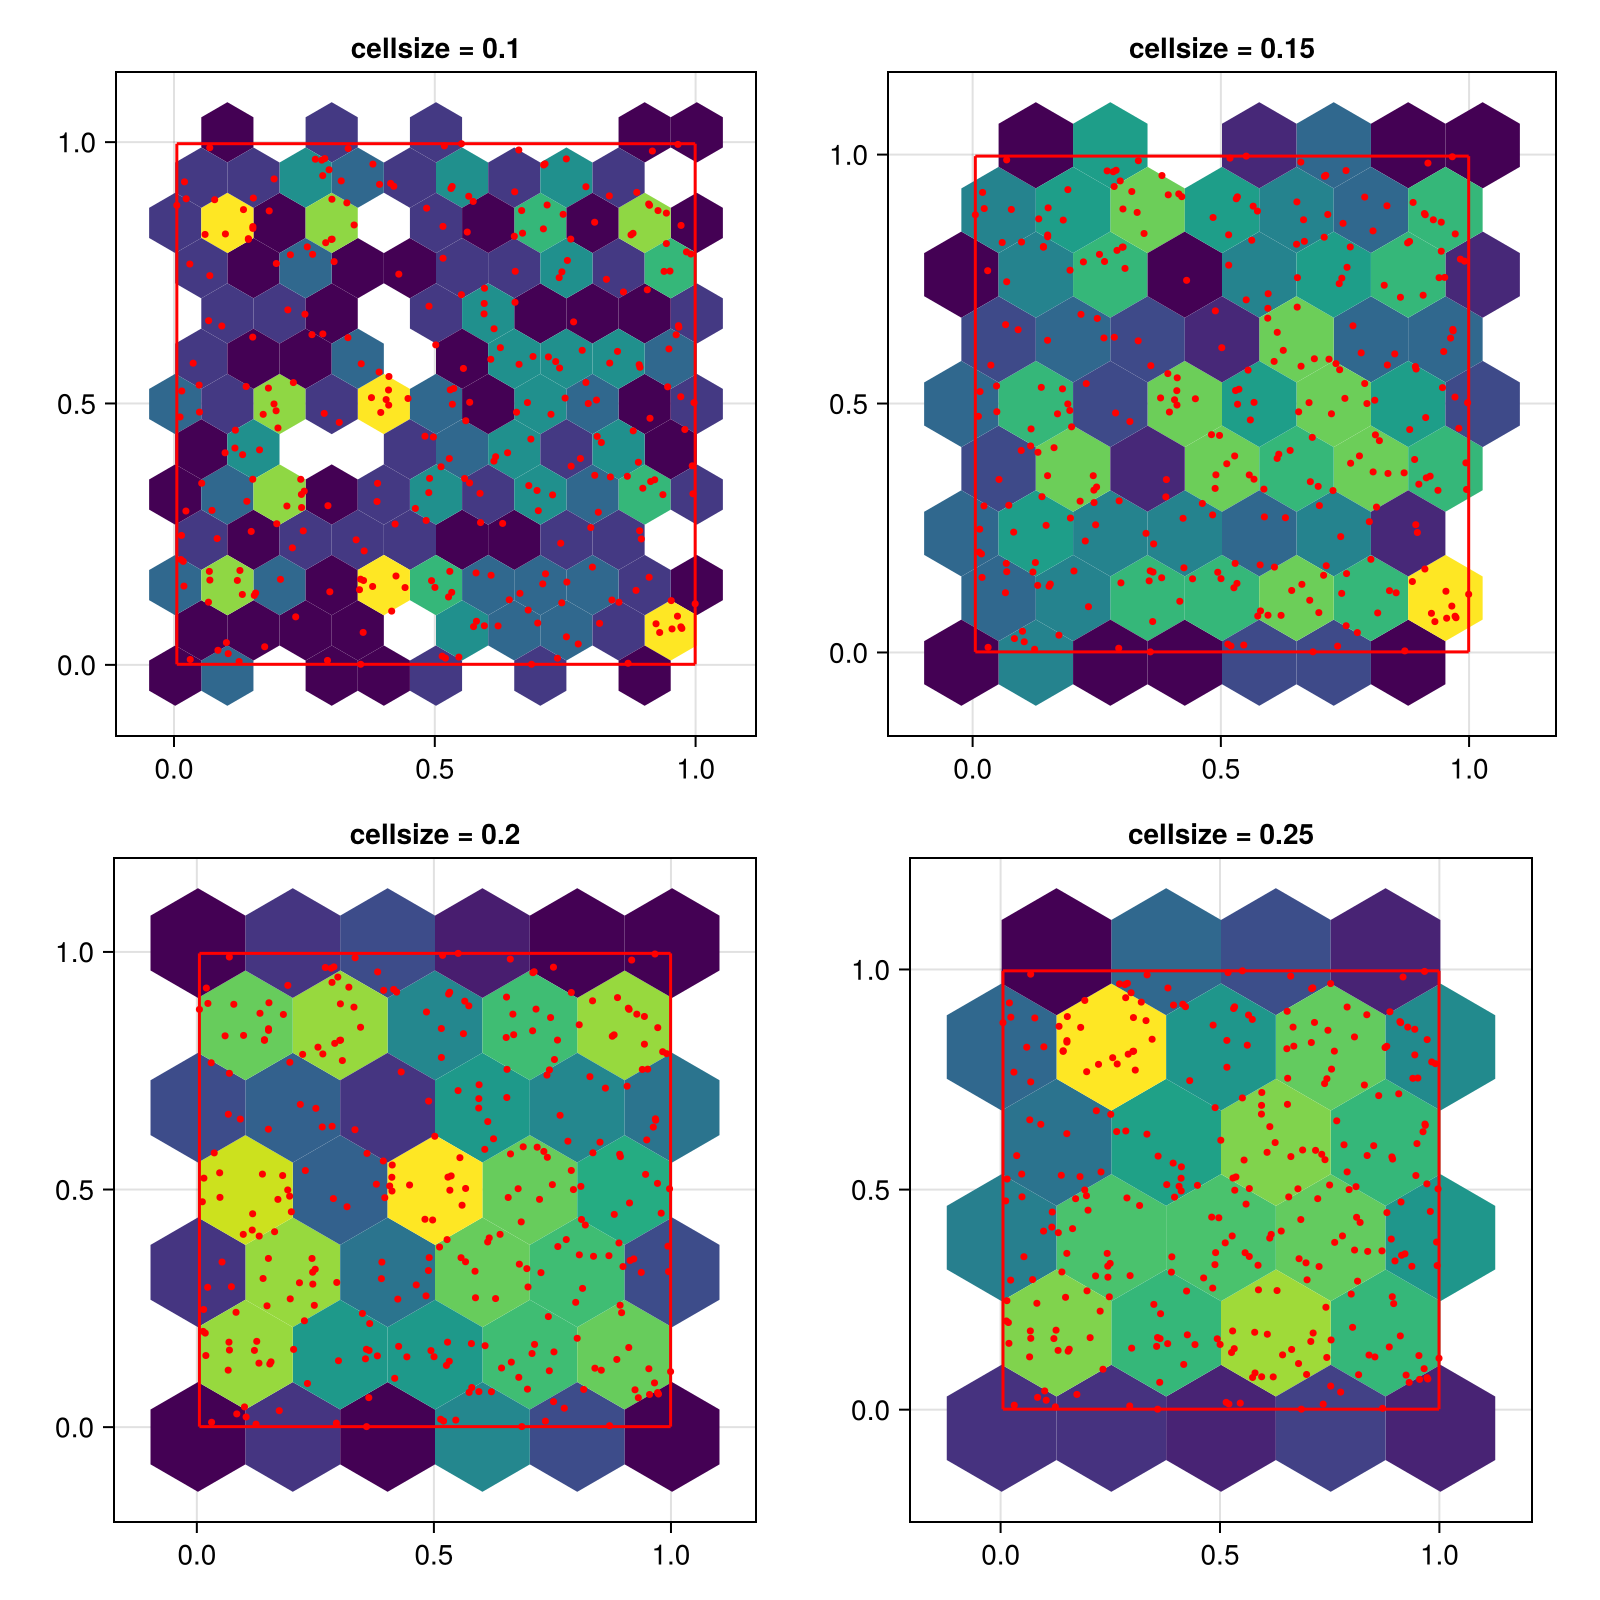
Hiding hexagons with low counts
All hexagons with a count lower than threshold will be removed:
using CairoMakie
using Random
Random.seed!(1234)

f = Figure(size = (800, 800))

x = randn(100000)
y = randn(100000)

for (i, threshold) in enumerate([1, 10, 100, 500])
    ax = Axis(f[fldmod1(i, 2)...], title = "threshold = $threshold", aspect = DataAspect())
    hexbin!(ax, x, y, cellsize = 0.4, threshold = threshold)
end
f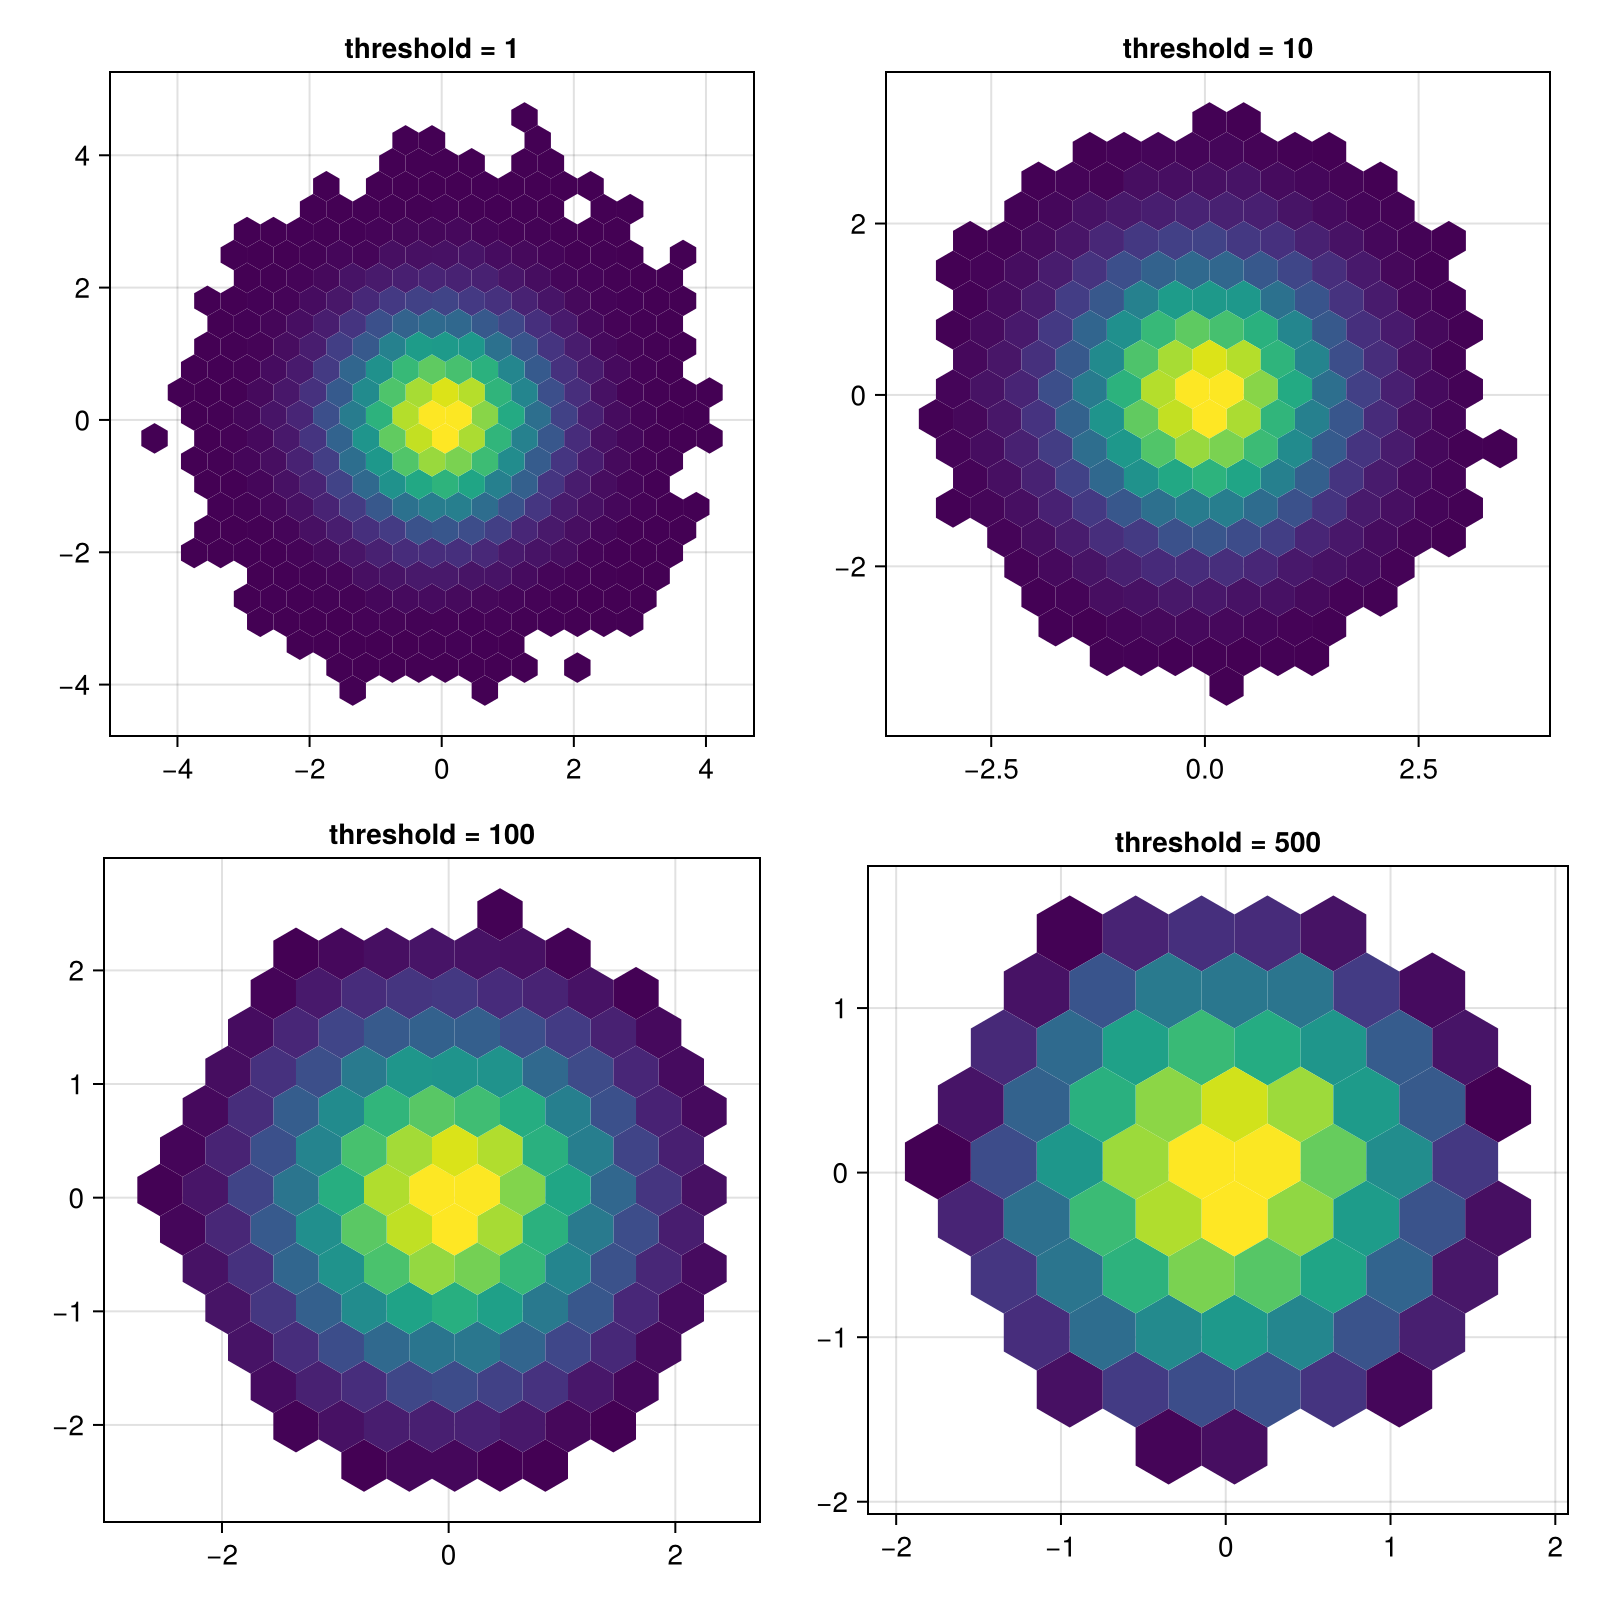
Changing the scale of the number of observations in a bin
You can pass a scale function to via the colorscale keyword, which will be applied to the bin counts before plotting.
using CairoMakie
using Random
Random.seed!(1234)

x = randn(100000)
y = randn(100000)

f = Figure()
hexbin(f[1, 1], x, y, bins = 40,
    axis = (aspect = DataAspect(), title = "colorscale = identity"))
hexbin(f[1, 2], x, y, bins = 40, colorscale=log10,
    axis = (aspect = DataAspect(), title = "colorscale = log10"))
f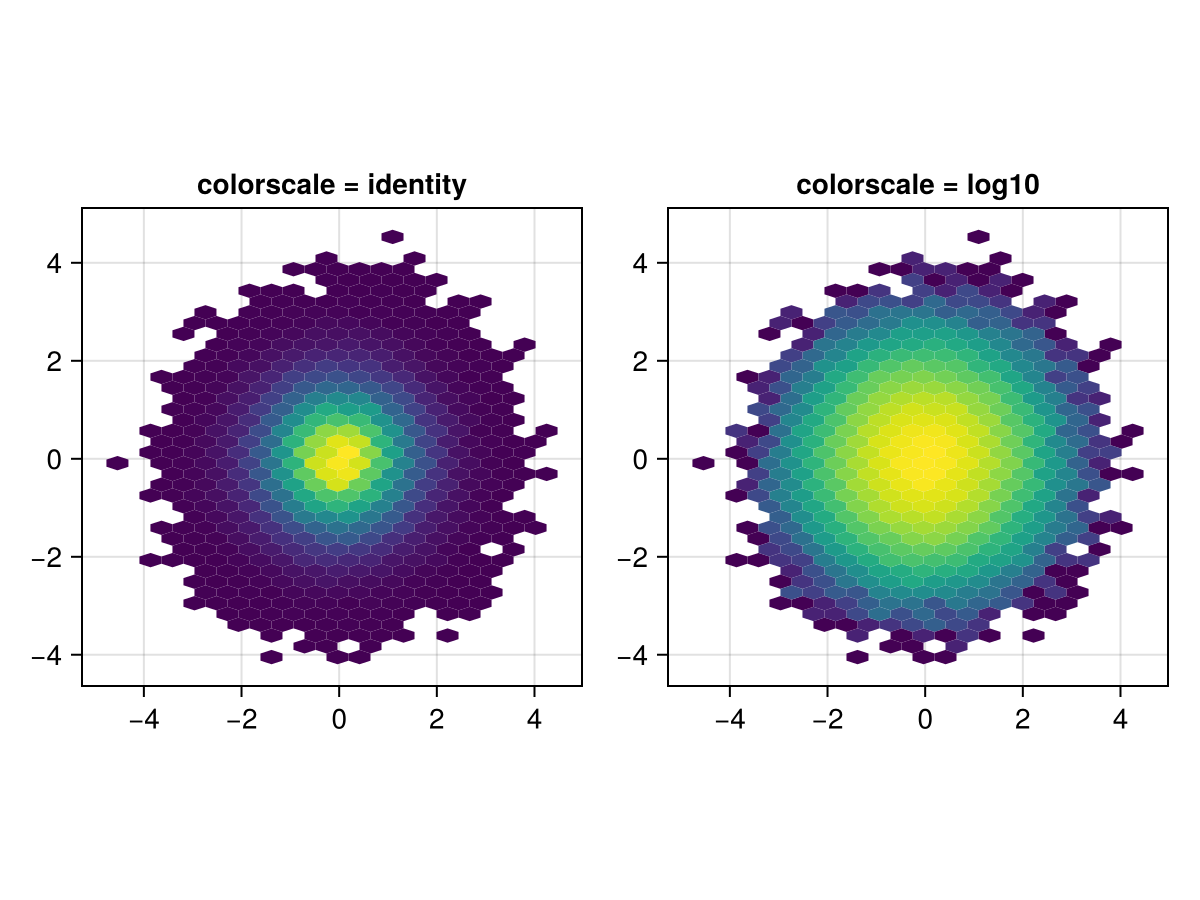
Showing zero count hexagons
By setting threshold = 0, all hexagons that fit into the limits of the input data are shown. In this example, we add a transparent color to the start of the colormap and stroke each hexagon so the empty hexagons are visible but not too distracting.
using CairoMakie
using DelimitedFiles


a = map(Point2f, eachrow(readdlm(assetpath("airportlocations.csv"))))

f, ax, hb = hexbin(a,
    cellsize = 6,
    axis = (; aspect = DataAspect()),
    threshold = 0,
    colormap = [Makie.to_color(:transparent); Makie.to_colormap(:viridis)],
    strokewidth = 0.5,
    strokecolor = :gray50,
    colorscale = Makie.pseudolog10)

tightlimits!(ax)

Colorbar(f[1, 2], hb,
    label = "Number of airports",
    height = Relative(0.5)
)
f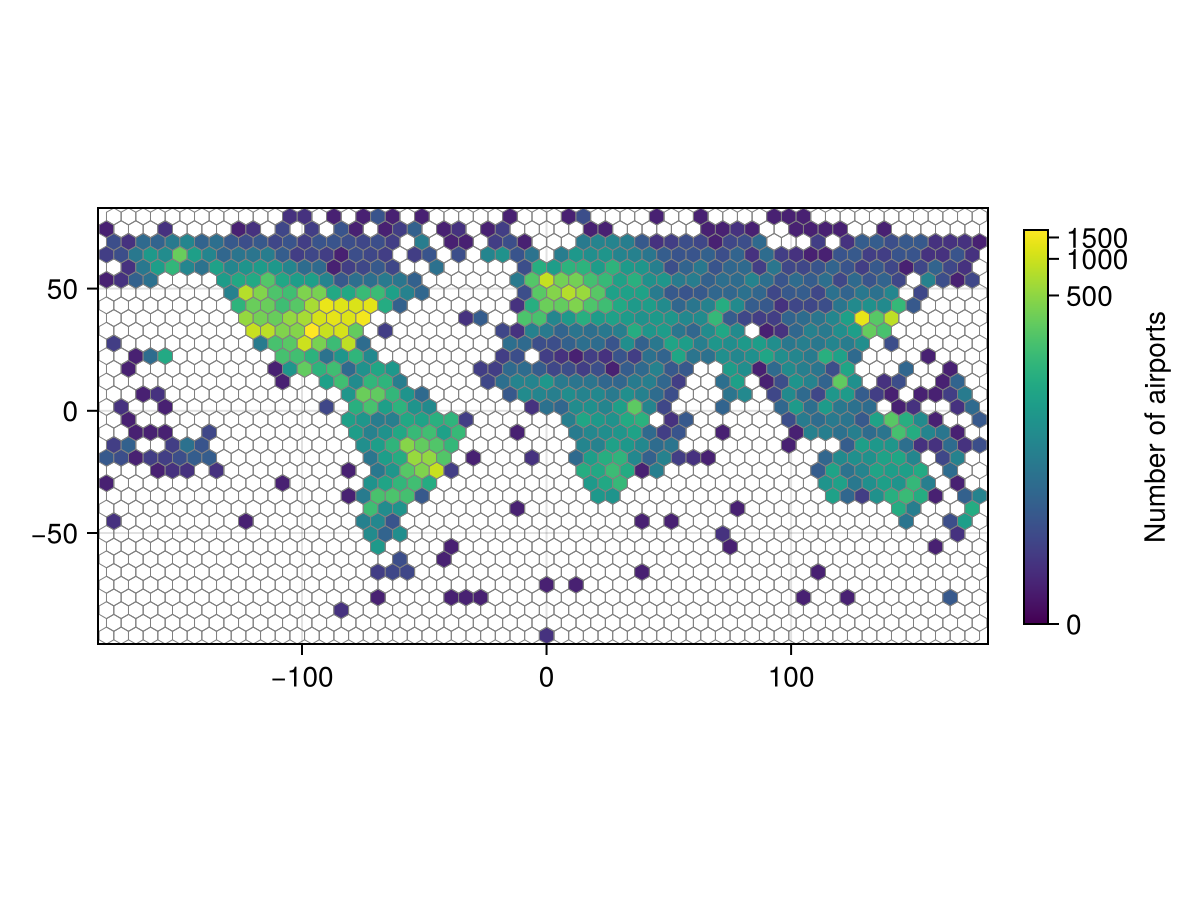
Applying weights to observations
using CairoMakie

using Random
Random.seed!(1234)

f = Figure(size = (800, 800))

x = 1:100
y = 1:100
points = vec(Point2f.(x, y'))

weights = [nothing, rand(length(points)), Makie.StatsBase.eweights(length(points), 0.005), Makie.StatsBase.weights(randn(length(points)))]
weight_labels = ["No weights", "Vector{<: Real}", "Exponential weights (StatsBase.eweights)", "StatesBase.weights(randn(...))"]

for (i, (weight, title)) in enumerate(zip(weights, weight_labels))
    ax = Axis(f[fldmod1(i, 2)...], title = title, aspect = DataAspect())
    hexbin!(ax, points; weights = weight)
    autolimits!(ax)
end

f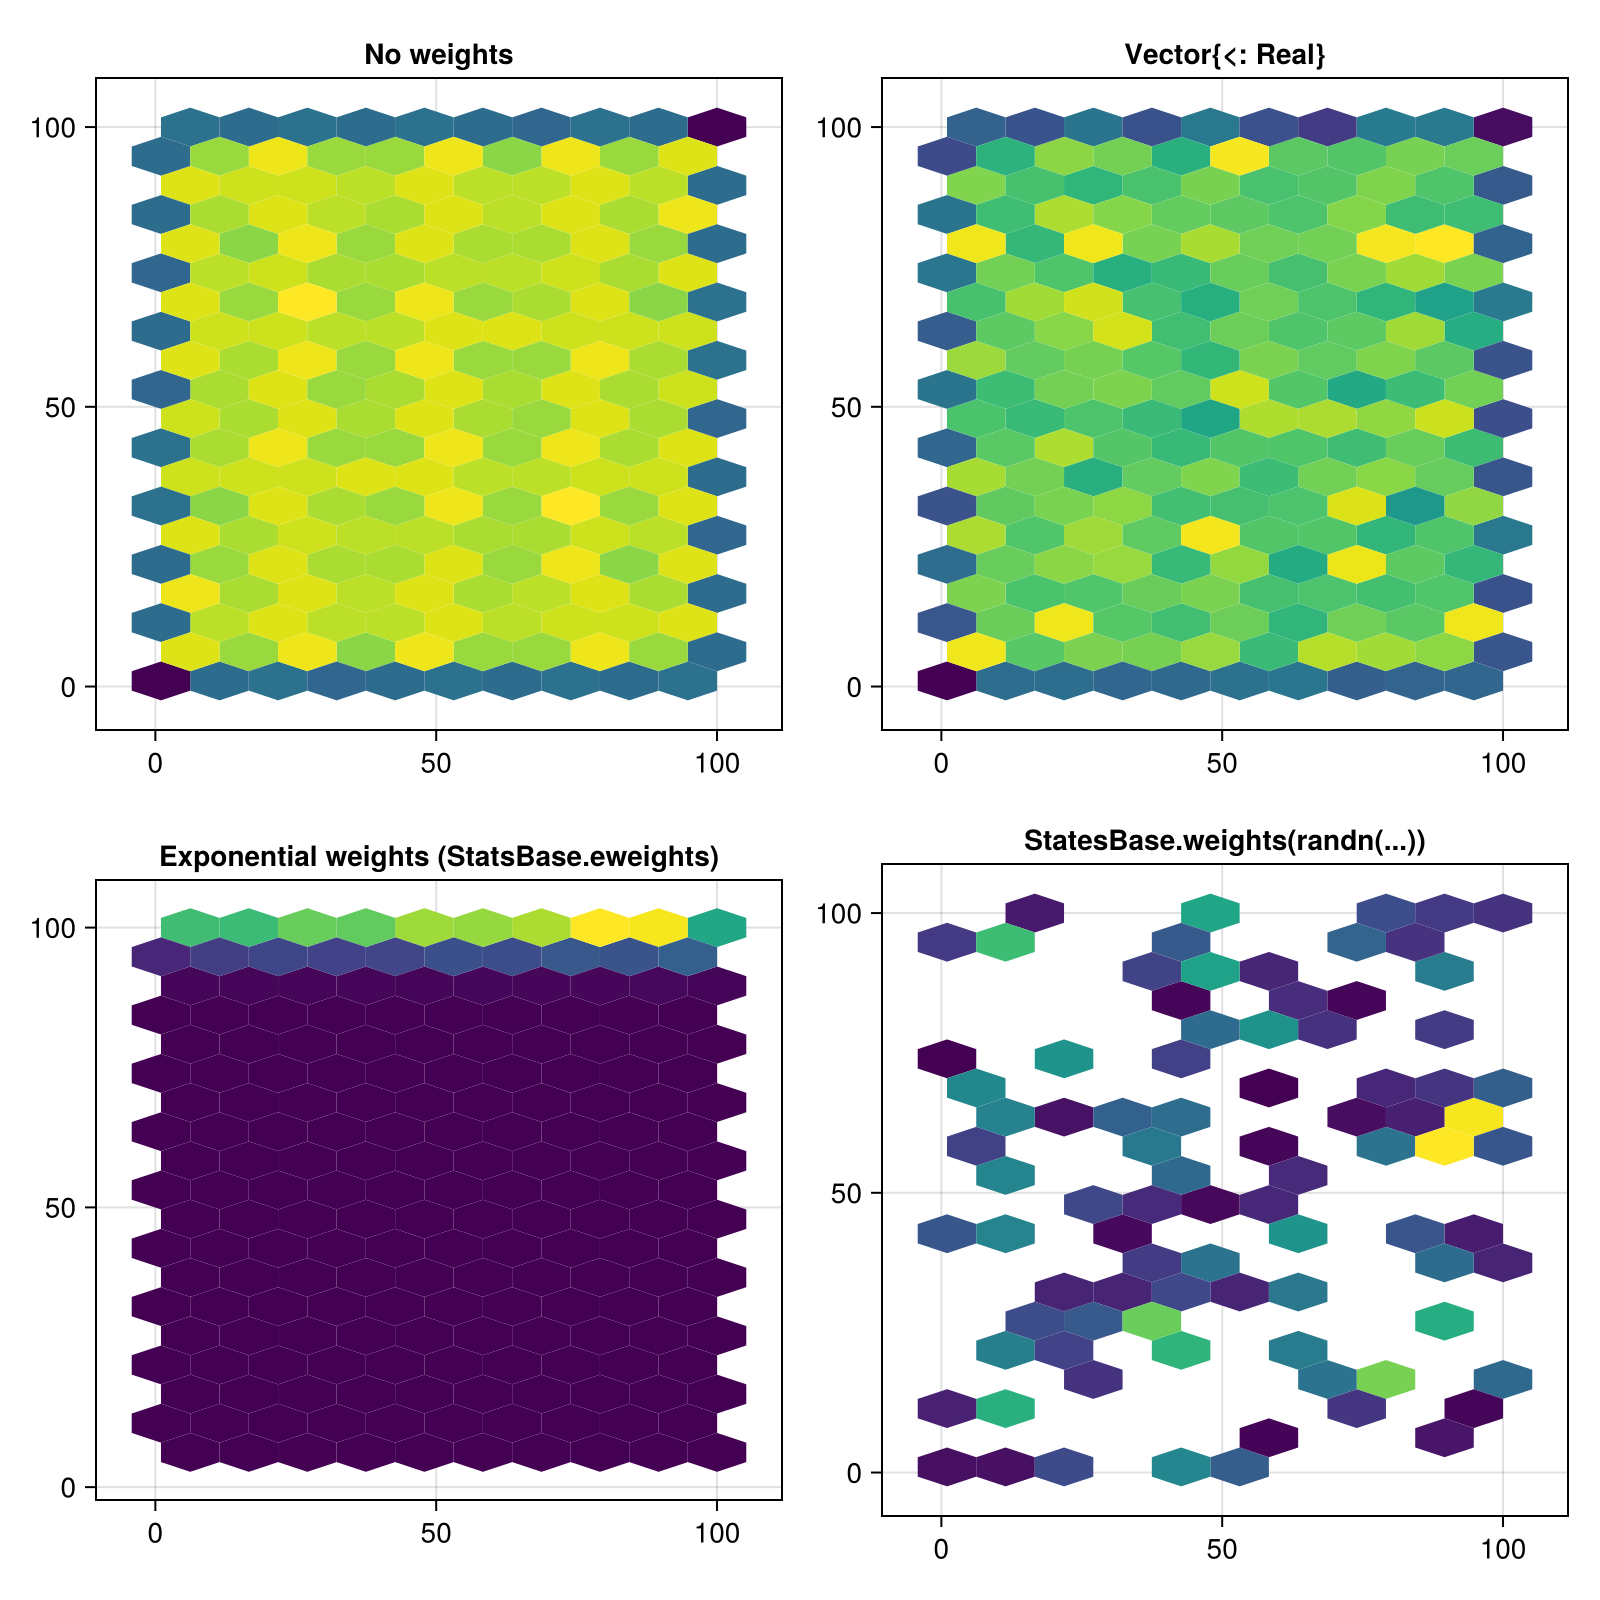
Attributes
alpha
Defaults to 1.0
The alpha value of the colormap or color attribute. Multiple alphas like in plot(alpha=0.2, color=(:red, 0.5), will get multiplied.
bins
Defaults to 20
If an Int, sets the number of bins in x and y direction. If a NTuple{2, Int}, sets the number of bins for x and y separately.
cellsize
Defaults to nothing
If a Real, makes equally-sided hexagons with width cellsize. If a Tuple{Real, Real} specifies hexagon width and height separately.
colormap
Defaults to @inherit colormap :viridis
Sets the colormap that is sampled for numeric colors. PlotUtils.cgrad(...), Makie.Reverse(any_colormap) can be used as well, or any symbol from ColorBrewer or PlotUtils. To see all available color gradients, you can call Makie.available_gradients().
colorrange
Defaults to automatic
The values representing the start and end points of colormap.
colorscale
Defaults to identity
The color transform function. Can be any function, but only works well together with Colorbar for identity, log, log2, log10, sqrt, logit, Makie.pseudolog10 and Makie.Symlog10.
highclip
Defaults to automatic
The color for any value above the colorrange.
lowclip
Defaults to automatic
The color for any value below the colorrange.
nan_color
Defaults to :transparent
The color for NaN values.
strokecolor
Defaults to :black
No docs available.
strokewidth
Defaults to 0
No docs available.
threshold
Defaults to 1
The minimal number of observations in the bin to be shown. If 0, all zero-count hexagons fitting into the data limits will be shown.
weights
Defaults to nothing
Weights for each observation. Can be nothing (each observation carries weight 1) or any AbstractVector{<: Real} or StatsBase.AbstractWeights.