
heatmap
MakieCore.heatmap Function
heatmap(x, y, matrix)
heatmap(x, y, func)
heatmap(matrix)
heatmap(xvector, yvector, zvector)
Plots a heatmap as a collection of rectangles. x and y can either be of length i and j where (i, j) is size(matrix), in this case the rectangles will be placed around these grid points like voronoi cells. Note that for irregularly spaced x and y, the points specified by them are not centered within the resulting rectangles.
x and y can also be of length i+1 and j+1, in this case they are interpreted as the edges of the rectangles.
Colors of the rectangles are derived from matrix[i, j]. The third argument may also be a Function (i, j) -> v which is then evaluated over the grid spanned by x and y.
Another allowed form is using three vectors xvector, yvector and zvector. In this case it is assumed that no pair of elements x and y exists twice. Pairs that are missing from the resulting grid will be treated as if zvector had a NaN element at that position.
If x and y are omitted with a matrix argument, they default to x, y = axes(matrix).
Note that heatmap is slower to render than image so image should be preferred for large, regularly spaced grids.
Plot type
The plot type alias for the heatmap function is Heatmap.
Examples
Two vectors and a matrix
In this example, x and y specify the points around which the heatmap cells are placed.
using CairoMakie
f = Figure()
ax = Axis(f[1, 1])

centers_x = 1:5
centers_y = 6:10
data = reshape(1:25, 5, 5)

heatmap!(ax, centers_x, centers_y, data)

scatter!(ax, [(x, y) for x in centers_x for y in centers_y], color=:white, strokecolor=:black, strokewidth=1)

f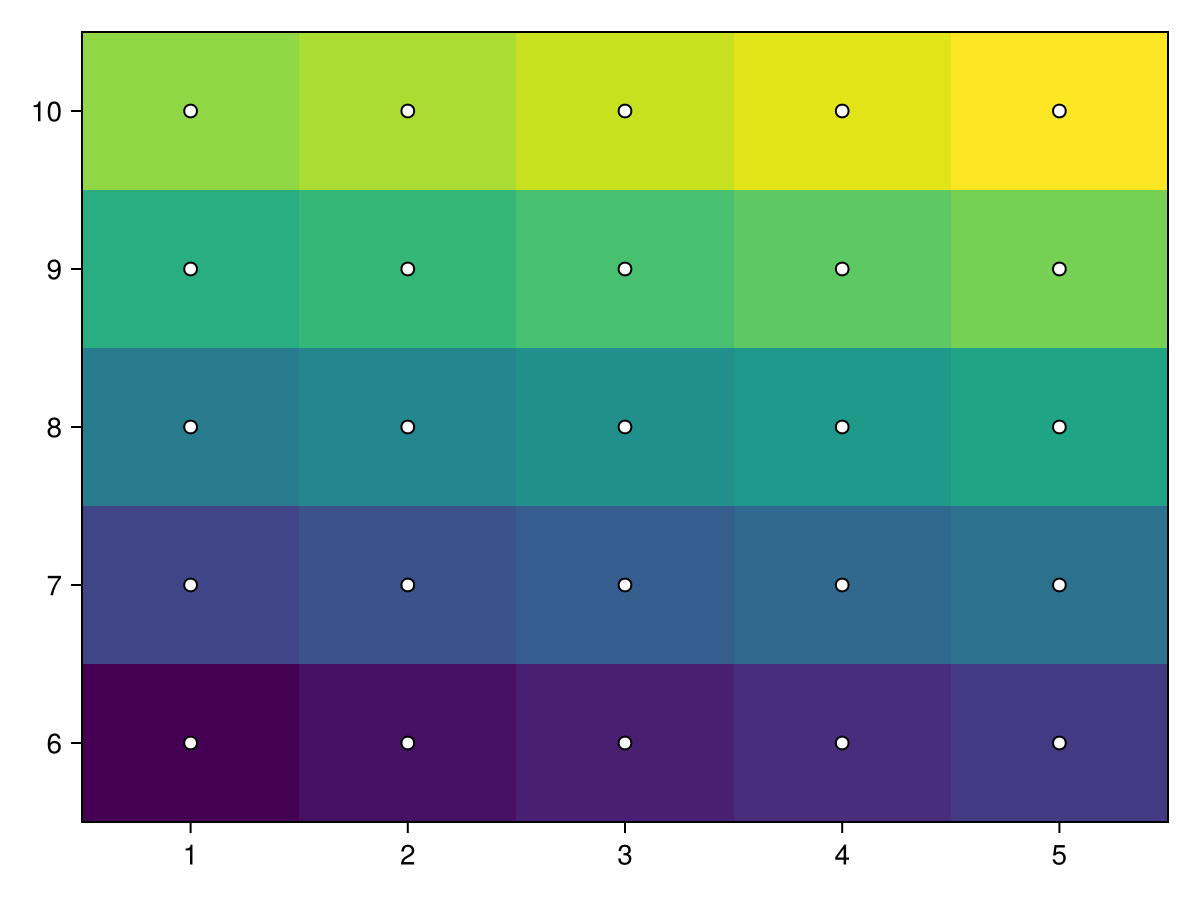
The same approach works for irregularly spaced cells. Note how the rectangles are not centered around the points, because the boundaries are between adjacent points like voronoi cells.
using CairoMakie
f = Figure()
ax = Axis(f[1, 1])

centers_x = [1, 2, 4, 7, 11]
centers_y = [6, 7, 9, 12, 16]
data = reshape(1:25, 5, 5)

heatmap!(ax, centers_x, centers_y, data)

scatter!(ax, [(x, y) for x in centers_x for y in centers_y], color=:white, strokecolor=:black, strokewidth=1)
f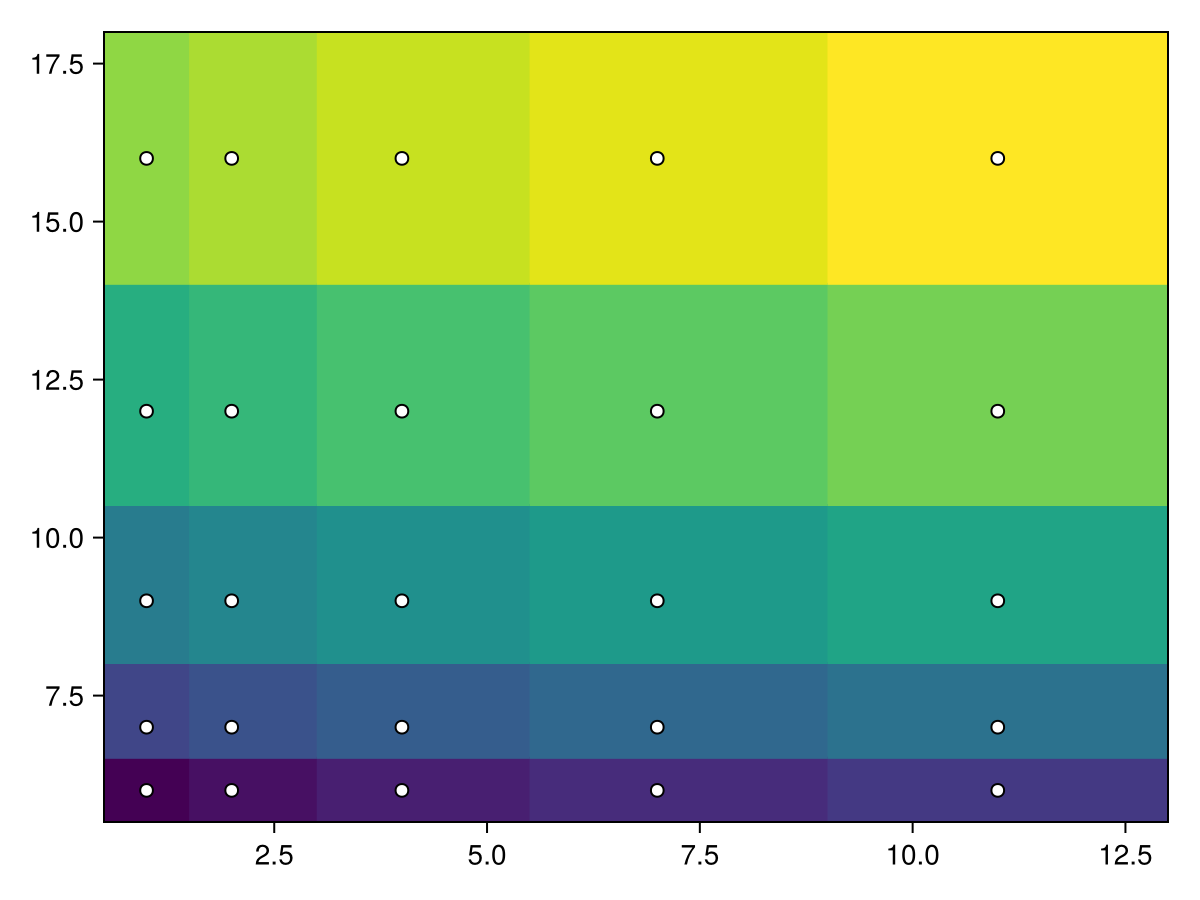
If we add one more element to x and y, they now specify the edges of the rectangular cells. Here's a regular grid:
using CairoMakie
f = Figure()
ax = Axis(f[1, 1])

edges_x = 1:6
edges_y = 7:12
data = reshape(1:25, 5, 5)

heatmap!(ax, edges_x, edges_y, data)

scatter!(ax, [(x, y) for x in edges_x for y in edges_y], color=:white, strokecolor=:black, strokewidth=1)
f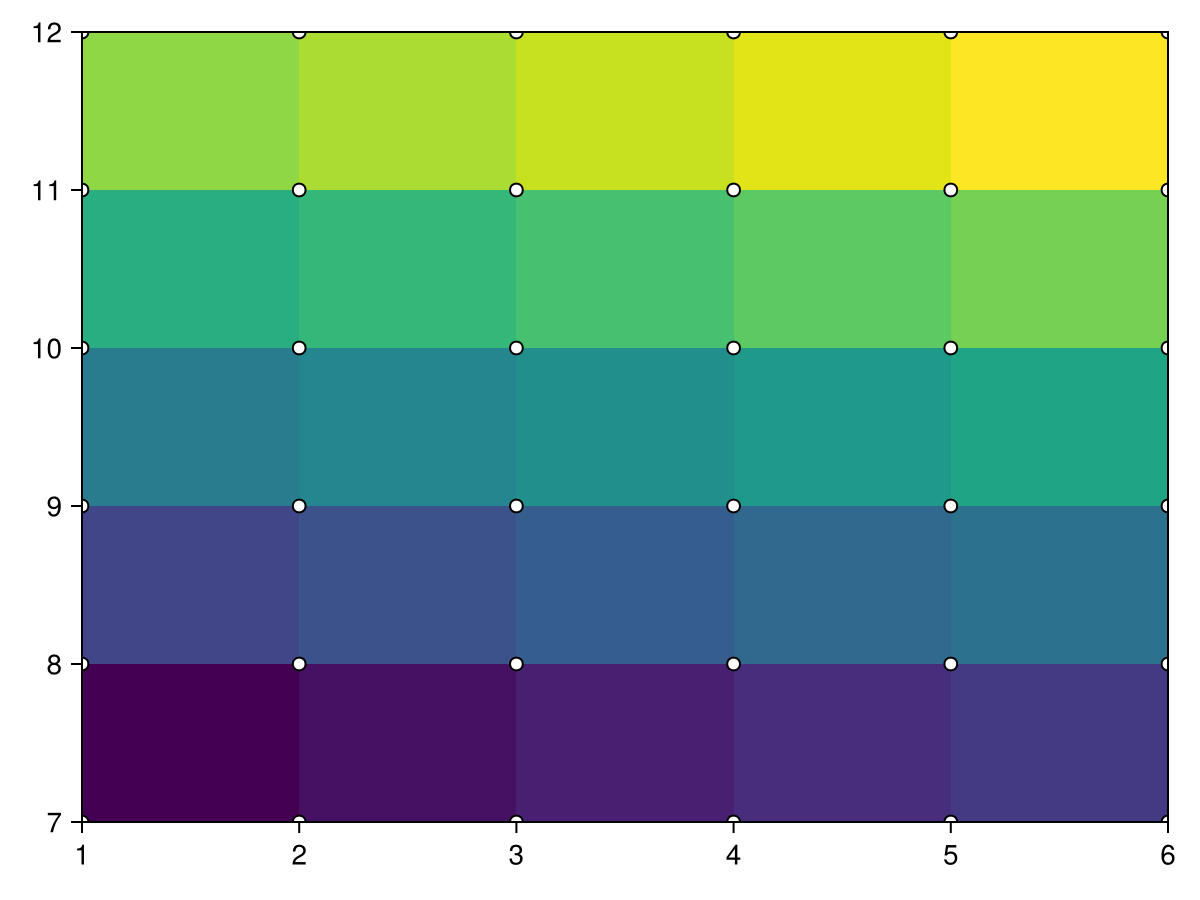
We can do the same with an irregular grid as well:
using CairoMakie
f = Figure()
ax = Axis(f[1, 1])

borders_x = [1, 2, 4, 7, 11, 16]
borders_y = [6, 7, 9, 12, 16, 21]
data = reshape(1:25, 5, 5)

heatmap!(ax, borders_x, borders_y, data)
scatter!(ax, [(x, y) for x in borders_x for y in borders_y], color=:white, strokecolor=:black, strokewidth=1)
f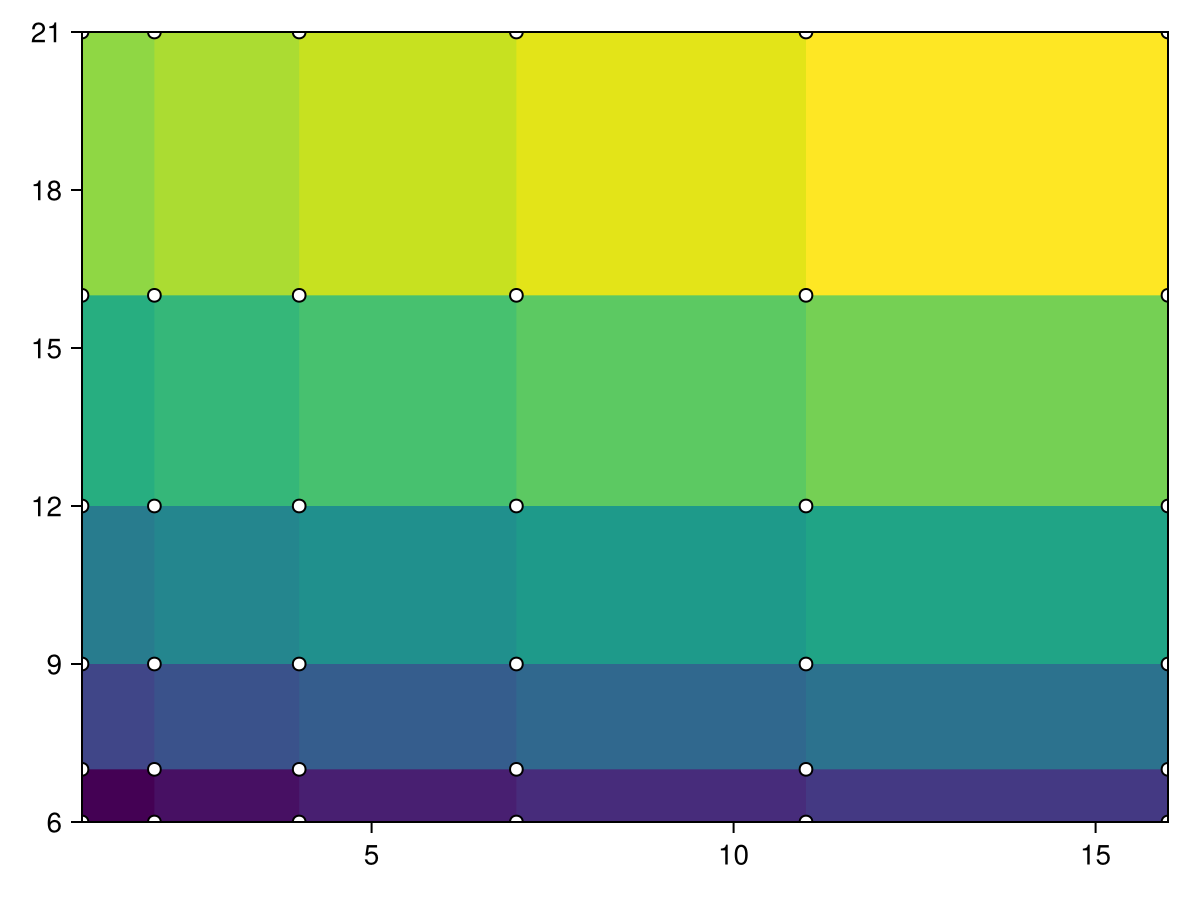
Using a Function instead of a Matrix
When using a Function of the form (i, j) -> v as the values argument, it is evaluated over the grid spanned by x and y.
using CairoMakie
function mandelbrot(x, y)
    z = c = x + y*im
    for i in 1:30.0; abs(z) > 2 && return i; z = z^2 + c; end; 0
end

heatmap(-2:0.001:1, -1.1:0.001:1.1, mandelbrot,
    colormap = Reverse(:deep))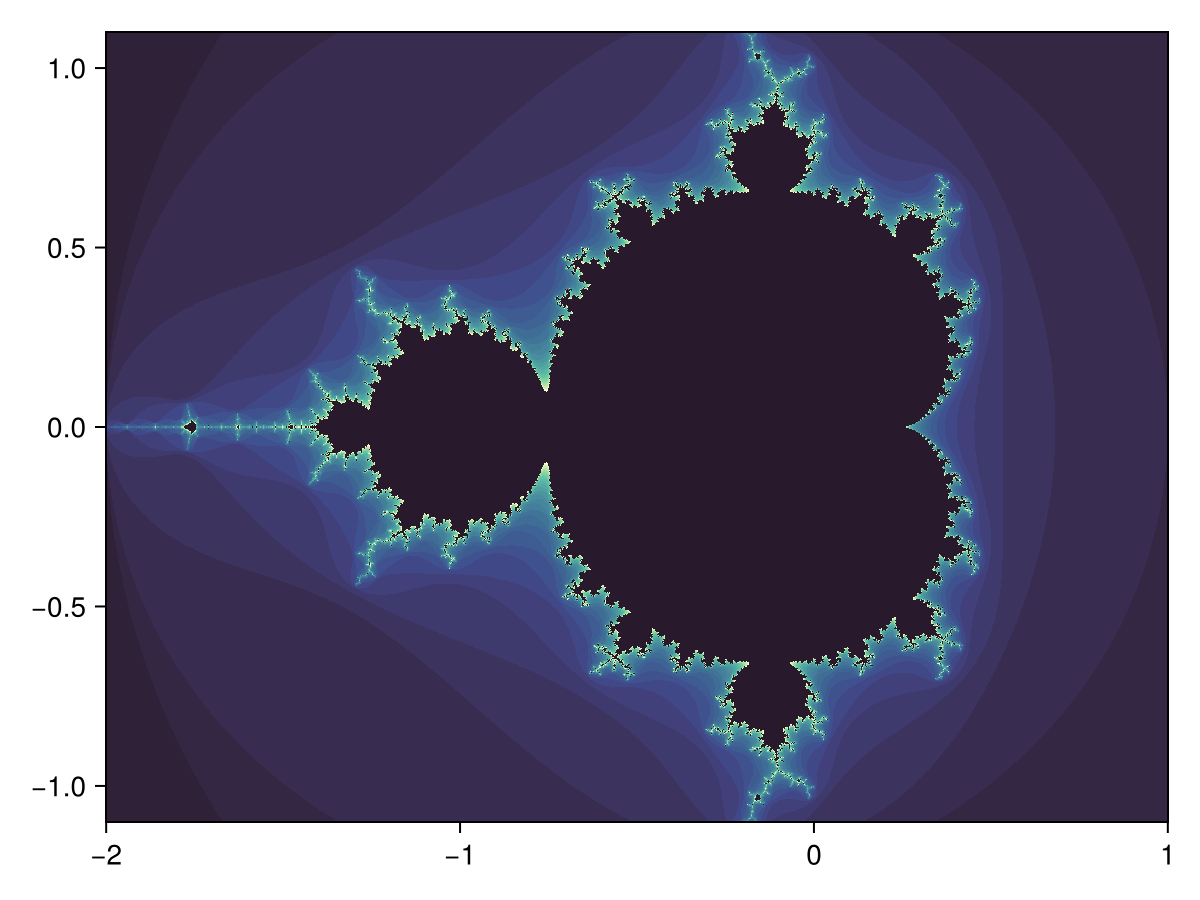
Three vectors
There must be no duplicate combinations of x and y, but it is allowed to leave out values.
using CairoMakie
xs = [1, 2, 3, 1, 2, 3, 1, 2, 3]
ys = [1, 1, 1, 2, 2, 2, 3, 3, 3]
zs = [1, 2, 3, 4, 5, 6, 7, 8, NaN]

heatmap(xs, ys, zs)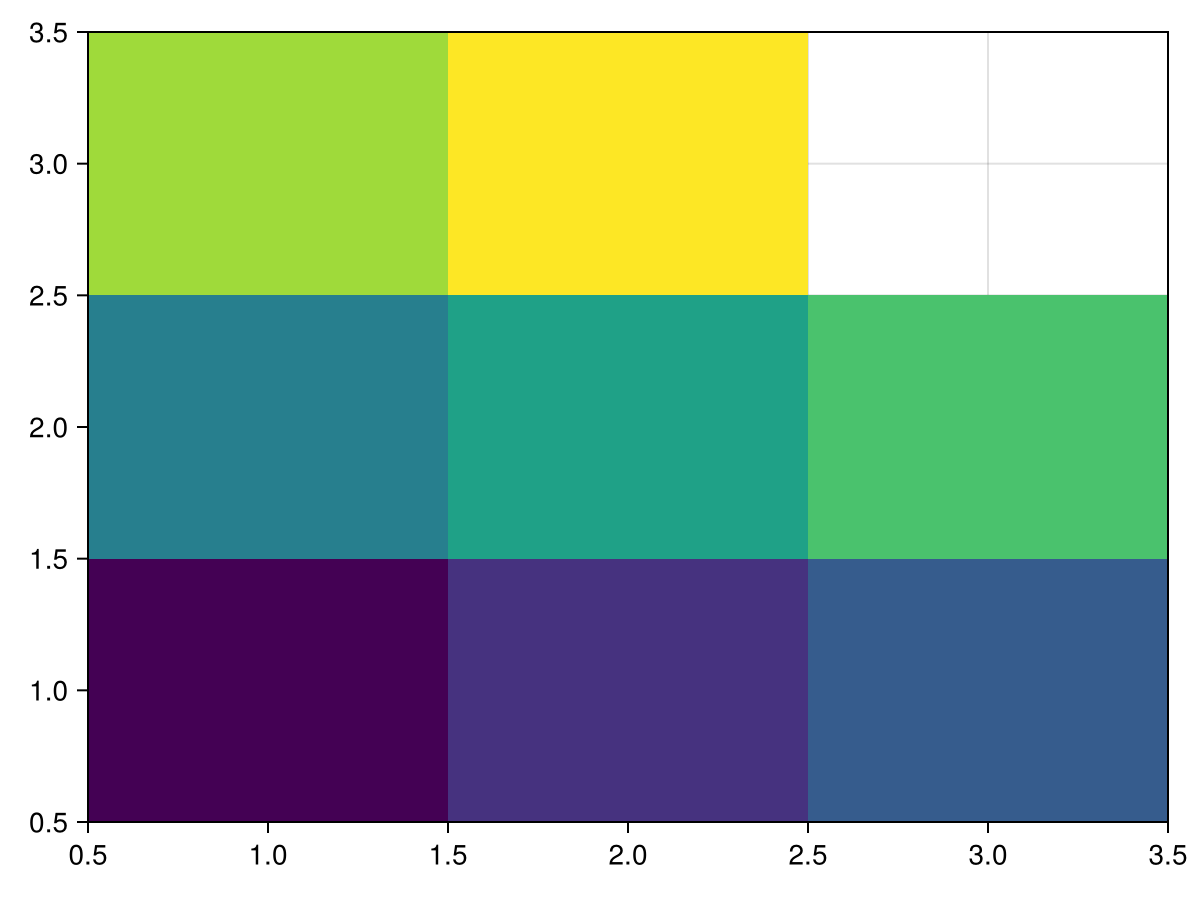
Colorbar for single heatmap
To get a scale for what the colors represent, add a colorbar. The colorbar is placed within the figure in the first argument, and the scale and colormap can be conveniently set by passing the relevant heatmap to it.
using CairoMakie
xs = range(0, 2π, length=100)
ys = range(0, 2π, length=100)
zs = [sin(x*y) for x in xs, y in ys]

fig, ax, hm = heatmap(xs, ys, zs)
Colorbar(fig[:, end+1], hm)

fig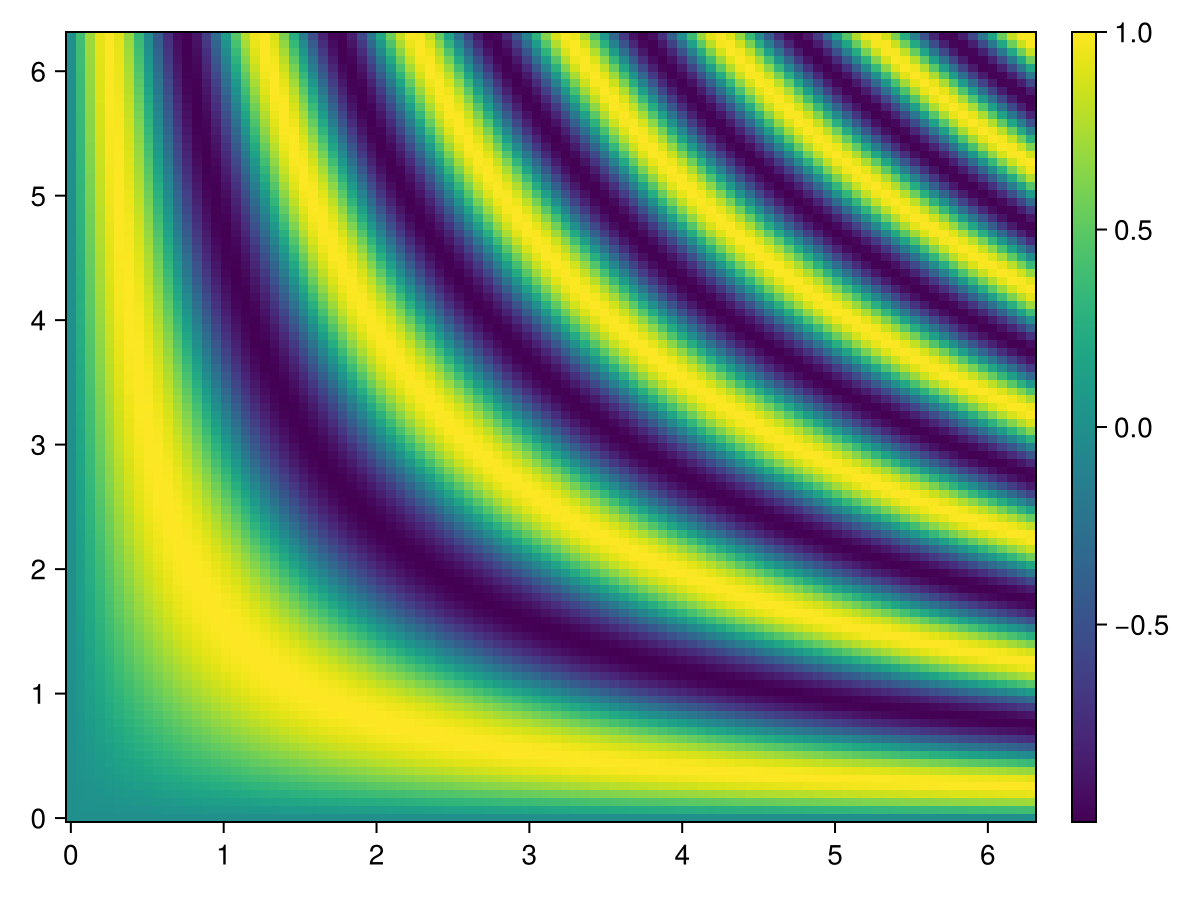
Colorbar for multiple heatmaps
When there are several heatmaps in a single figure, it can be useful to have a single colorbar represent all of them. It is important to then have synchronized scales and colormaps for the heatmaps and colorbar. This is done by setting the colorrange explicitly, so that it is independent of the data shown by that particular heatmap.
Since the heatmaps in the example below have the same colorrange and colormap, any of them can be passed to Colorbar to give the colorbar the same attributes. Alternatively, the colorbar attributes can be set explicitly.
using CairoMakie
xs = range(0, 2π, length=100)
ys = range(0, 2π, length=100)
zs1 = [sin(x*y) for x in xs, y in ys]
zs2 = [2sin(x*y) for x in xs, y in ys]

joint_limits = (-2, 2)  # here we pick the limits manually for simplicity instead of computing them

fig, ax1, hm1 = heatmap(xs, ys, zs1,  colorrange = joint_limits)
ax2, hm2 = heatmap(fig[1, end+1], xs, ys, zs2, colorrange = joint_limits)

Colorbar(fig[:, end+1], hm1)                     # These three
Colorbar(fig[:, end+1], hm2)                     # colorbars are
Colorbar(fig[:, end+1], colorrange = joint_limits)  # equivalent

fig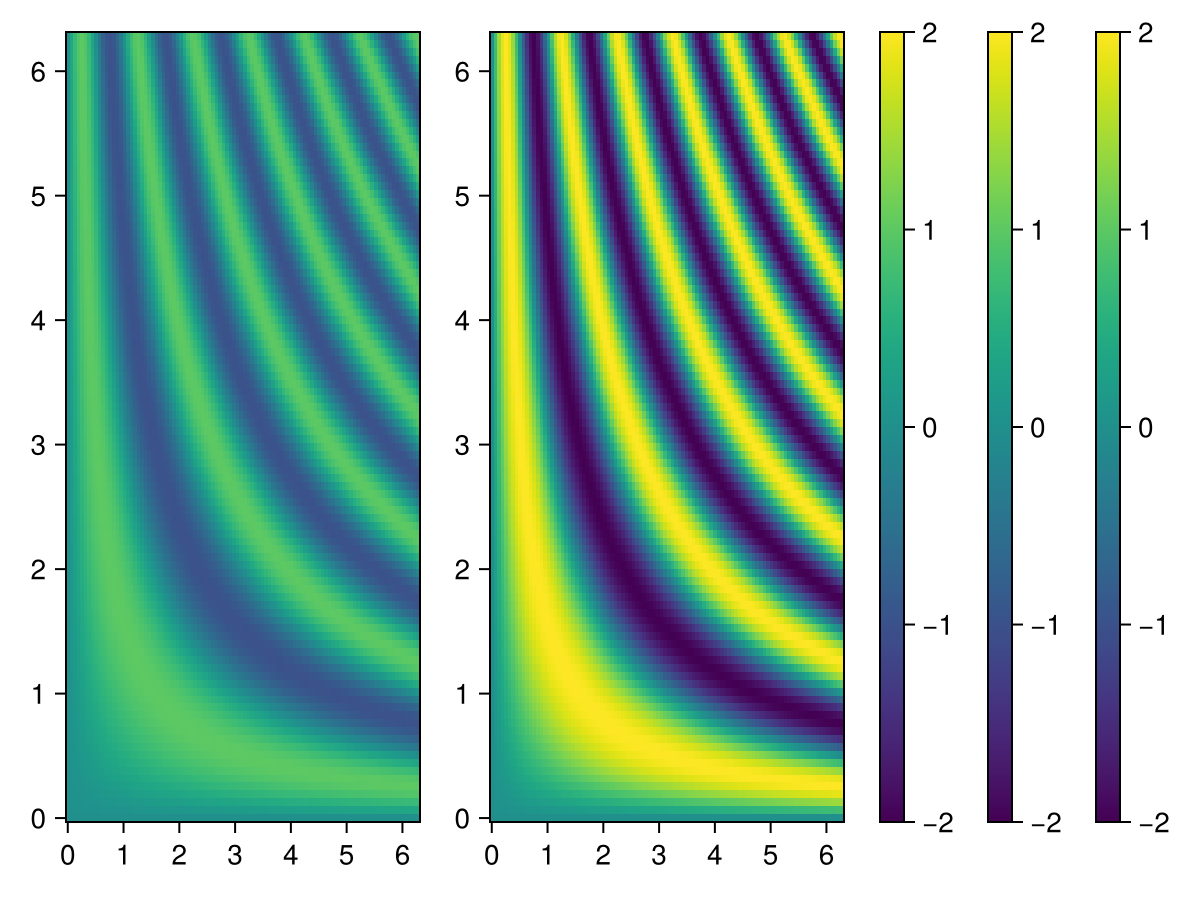
Using a custom colorscale
One can define a custom (color)scale using the ReversibleScale type. When the transformation is simple enough (log, sqrt, ...), the inverse transform is automatically deduced.
using CairoMakie
x = 10.0.^(1:0.1:4)
y = 1.0:0.1:5.0
z = broadcast((x, y) -> x - 10, x, y')

scale = ReversibleScale(x -> asinh(x / 2) / log(10), x -> 2sinh(log(10) * x))
fig, ax, hm = heatmap(x, y, z; colorscale = scale, axis = (; xscale = scale))
Colorbar(fig[1, 2], hm)

fig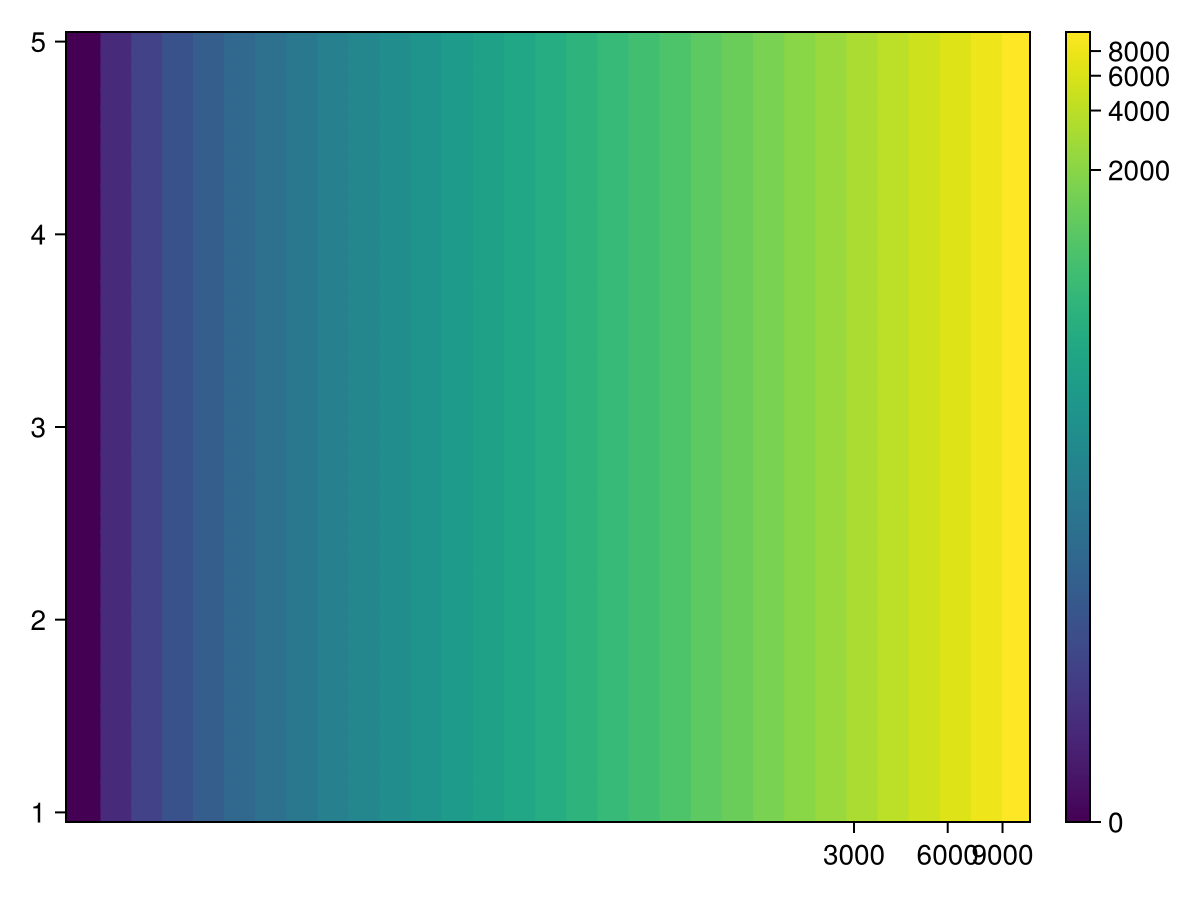
Plotting large Heatmaps
You can wrap your data into Makie.Resampler, to automatically resample large heatmaps only for the viewing area. When zooming in, it will update the resampled version, to show it at best fidelity. It blocks updates while any mouse or keyboard button is pressed, to not spam e.g. WGLMakie with data updates. This goes well with Axis(figure; zoombutton=Keyboard.left_control). You can disable this behavior with:
Resampler(data; update_while_button_pressed=true).
Example:
using Downloads, FileIO, GLMakie
# 30000×22943 image
path = Downloads.download("https://upload.wikimedia.org/wikipedia/commons/7/7e/In_the_Conservatory.jpg")
img = rotr90(load(path))
f, ax, pl = heatmap(Resampler(img); axis=(; aspect=DataAspect()), figure=(;size=size(img)./20))
hidedecorations!(ax)
f
For better down sampling quality we recommend using Makie.Pyramid (might be moved to another package), which creates a simple gaussian pyramid for efficient and artifact free down sampling:
pyramid = Makie.Pyramid(img)
fsize = (size(img) ./ 30) .* (1, 2)
fig, ax, pl = heatmap(Resampler(pyramid);
    axis=(; aspect=DataAspect(), title="Pyramid"), figure=(; size=fsize))
hidedecorations!(ax)
ax, pl = heatmap(fig[2, 1], Resampler(img1);
    axis=(; aspect=DataAspect(), title="No Pyramid"))
hidedecorations!(ax)
save("heatmap-pyramid.png", fig)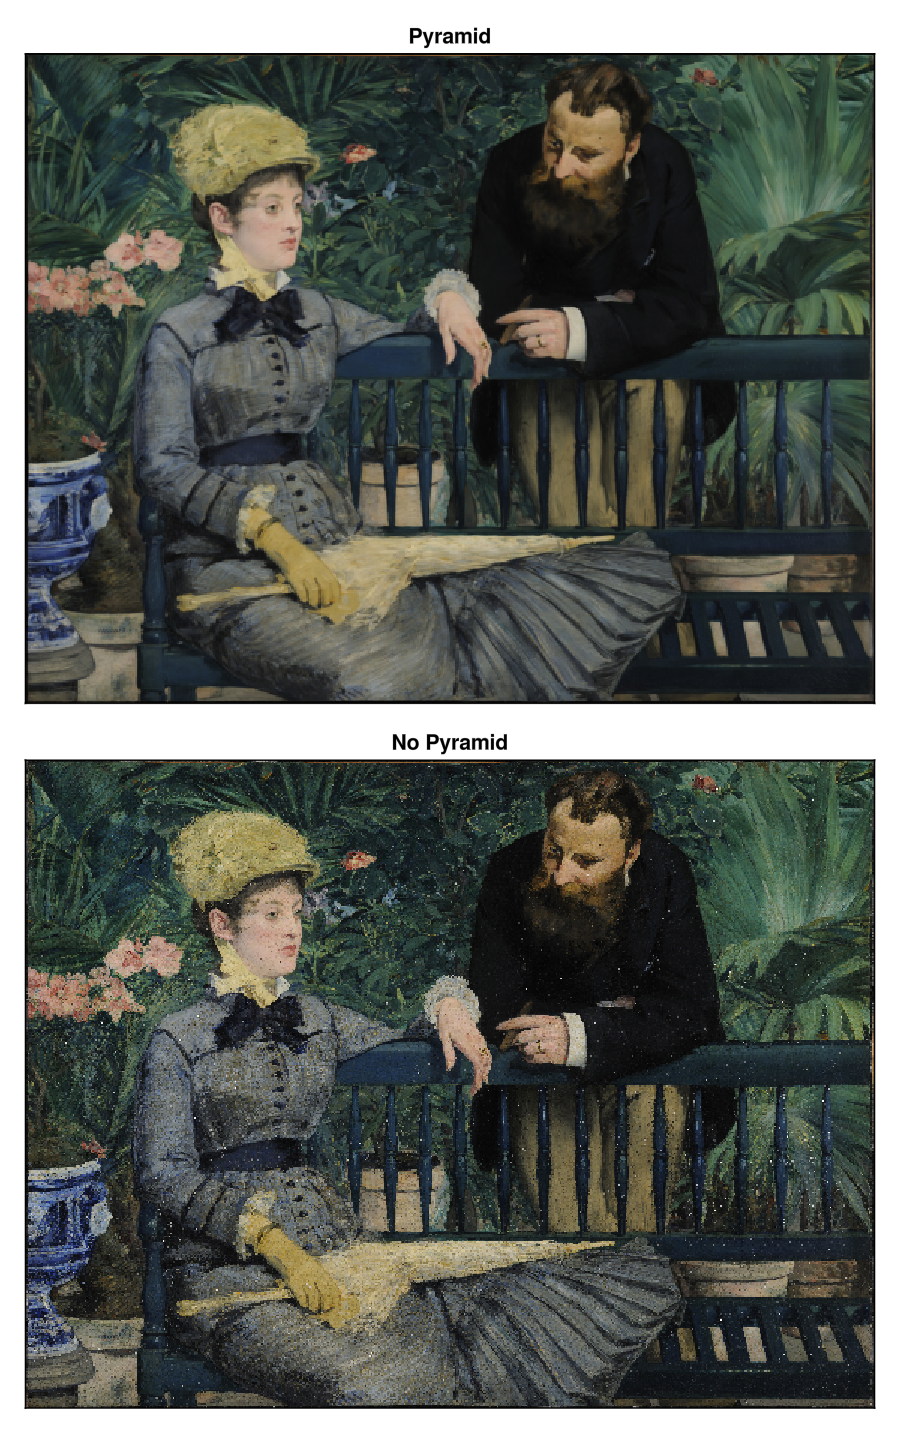
Any other Array type is allowed in Resampler, and it may also implement it's own interpolation strategy by overloading:
function (array::ArrayType)(xrange::LinRange, yrange::LinRange)
    ...
end
Attributes
alpha
Defaults to 1.0
The alpha value of the colormap or color attribute. Multiple alphas like in plot(alpha=0.2, color=(:red, 0.5), will get multiplied.
clip_planes
Defaults to automatic
Clip planes offer a way to do clipping in 3D space. You can set a Vector of up to 8 Plane3f planes here, behind which plots will be clipped (i.e. become invisible). By default clip planes are inherited from the parent plot or scene. You can remove parent clip_planes by passing Plane3f[].
colormap
Defaults to @inherit colormap :viridis
Sets the colormap that is sampled for numeric colors. PlotUtils.cgrad(...), Makie.Reverse(any_colormap) can be used as well, or any symbol from ColorBrewer or PlotUtils. To see all available color gradients, you can call Makie.available_gradients().
colorrange
Defaults to automatic
The values representing the start and end points of colormap.
colorscale
Defaults to identity
The color transform function. Can be any function, but only works well together with Colorbar for identity, log, log2, log10, sqrt, logit, Makie.pseudolog10 and Makie.Symlog10.
depth_shift
Defaults to 0.0
Adjusts the depth value of a plot after all other transformations, i.e. in clip space, where -1 <= depth <= 1. This only applies to GLMakie and WGLMakie and can be used to adjust render order (like a tunable overdraw).
fxaa
Defaults to true
Adjusts whether the plot is rendered with fxaa (anti-aliasing, GLMakie only).
highclip
Defaults to automatic
The color for any value above the colorrange.
inspectable
Defaults to @inherit inspectable
Sets whether this plot should be seen by DataInspector. The default depends on the theme of the parent scene.
inspector_clear
Defaults to automatic
Sets a callback function (inspector, plot) -> ... for cleaning up custom indicators in DataInspector.
inspector_hover
Defaults to automatic
Sets a callback function (inspector, plot, index) -> ... which replaces the default show_data methods.
inspector_label
Defaults to automatic
Sets a callback function (plot, index, position) -> string which replaces the default label generated by DataInspector.
interpolate
Defaults to false
Sets whether colors should be interpolated
lowclip
Defaults to automatic
The color for any value below the colorrange.
model
Defaults to automatic
Sets a model matrix for the plot. This overrides adjustments made with translate!, rotate! and scale!.
nan_color
Defaults to :transparent
The color for NaN values.
overdraw
Defaults to false
Controls if the plot will draw over other plots. This specifically means ignoring depth checks in GL backends
space
Defaults to :data
Sets the transformation space for box encompassing the plot. See Makie.spaces() for possible inputs.
ssao
Defaults to false
Adjusts whether the plot is rendered with ssao (screen space ambient occlusion). Note that this only makes sense in 3D plots and is only applicable with fxaa = true.
transformation
Defaults to :automatic
No docs available.
transparency
Defaults to false
Adjusts how the plot deals with transparency. In GLMakie transparency = true results in using Order Independent Transparency.
visible
Defaults to true
Controls whether the plot will be rendered or not.