
density
Makie.density Function
density(values)Plot a kernel density estimate of values.
Plot type
The plot type alias for the density function is Density.
Examples
using CairoMakie
f = Figure()
Axis(f[1, 1])

density!(randn(200))
density!(randn(200) .+ 2, alpha = 0.8)

f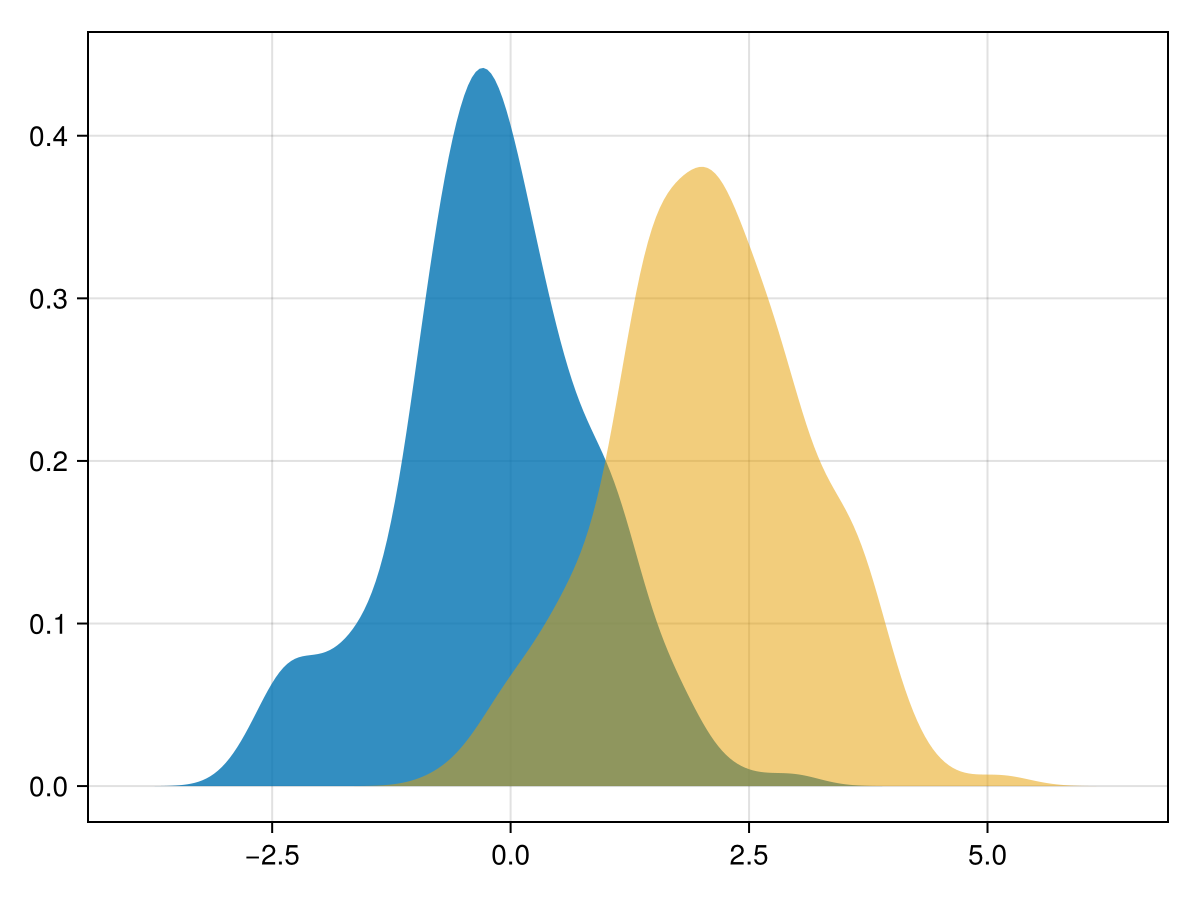
using CairoMakie
f = Figure()
Axis(f[1, 1])

density!(randn(200), direction = :y, npoints = 10)

f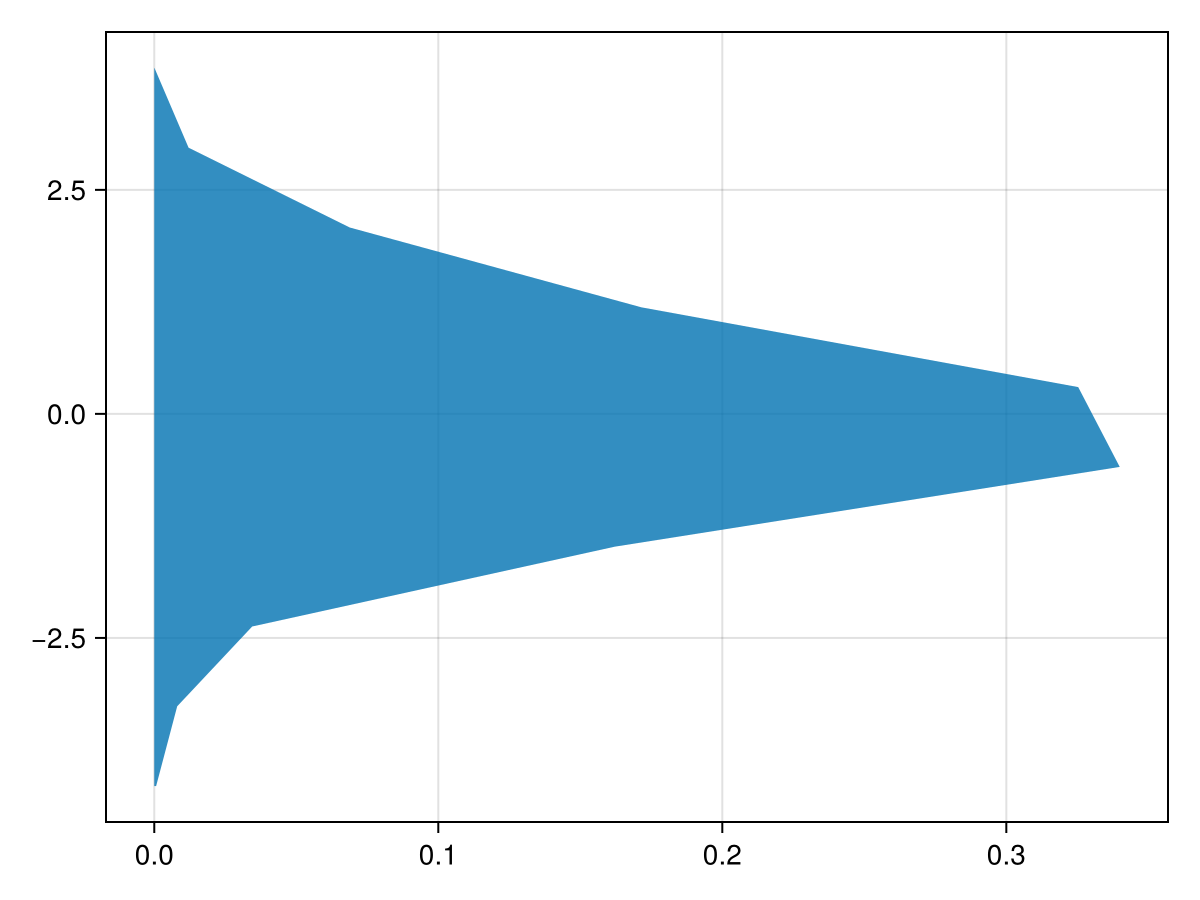
using CairoMakie
f = Figure()
Axis(f[1, 1])

density!(randn(200), color = (:red, 0.3),
    strokecolor = :red, strokewidth = 3, strokearound = true)

f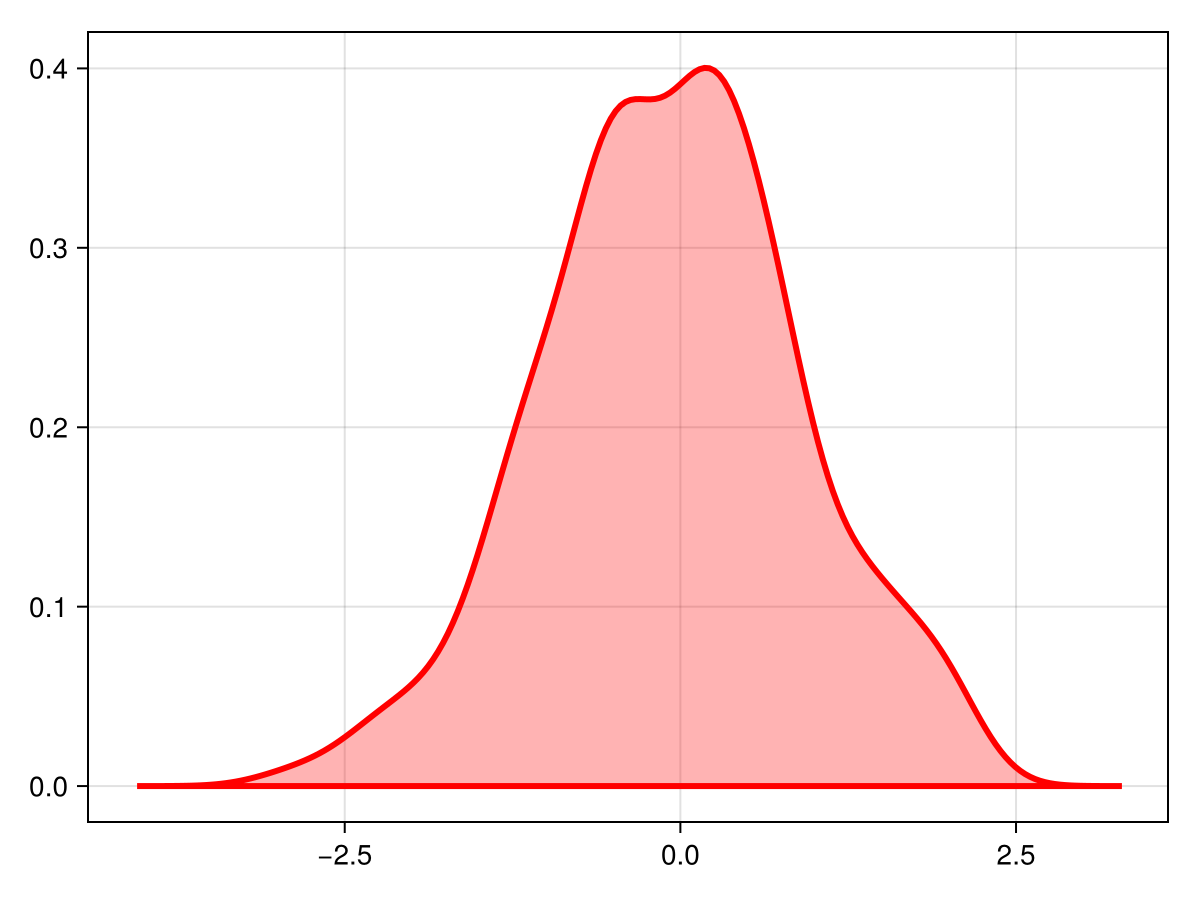
using CairoMakie
f = Figure()
Axis(f[1, 1])

vectors = [randn(1000) .+ i/2 for i in 0:5]

for (i, vector) in enumerate(vectors)
    density!(vector, offset = -i/4, color = (:slategray, 0.4),
        bandwidth = 0.1)
end

f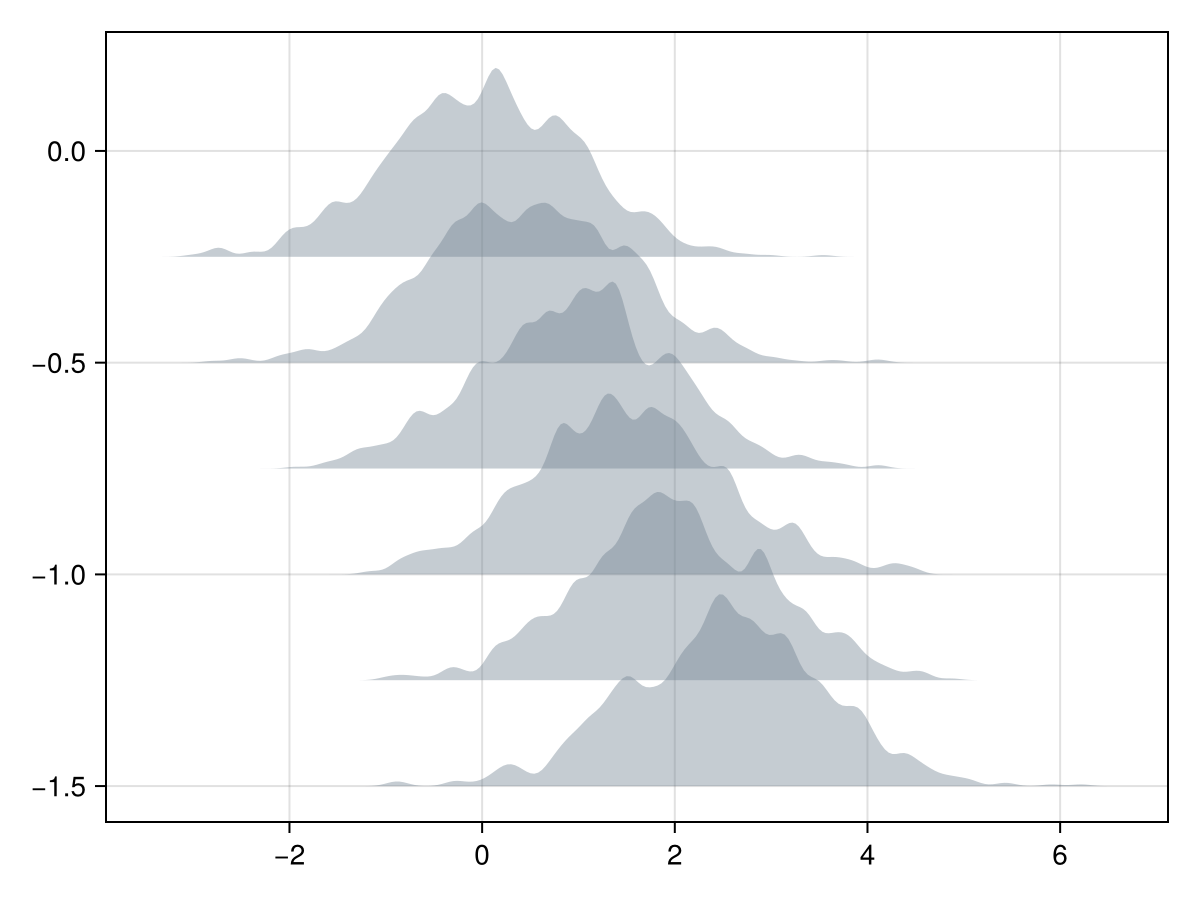
Gradients
You can color density plots with gradients by choosing color = :x or :y, depending on the direction attribute.
using CairoMakie
months = ["January", "February", "March", "April",
    "May", "June", "July", "August", "September",
    "October", "November", "December"]

f = Figure()
Axis(f[1, 1], title = "Fictive temperatures",
    yticks = ((1:12) ./ 4,  reverse(months)))

for i in 12:-1:1
    d = density!(randn(200) .- 2sin((i+3)/6*pi), offset = i / 4,
        color = :x, colormap = :thermal, colorrange = (-5, 5),
        strokewidth = 1, strokecolor = :black)
    # this helps with layering in GLMakie
    translate!(d, 0, 0, -0.1i)
end
f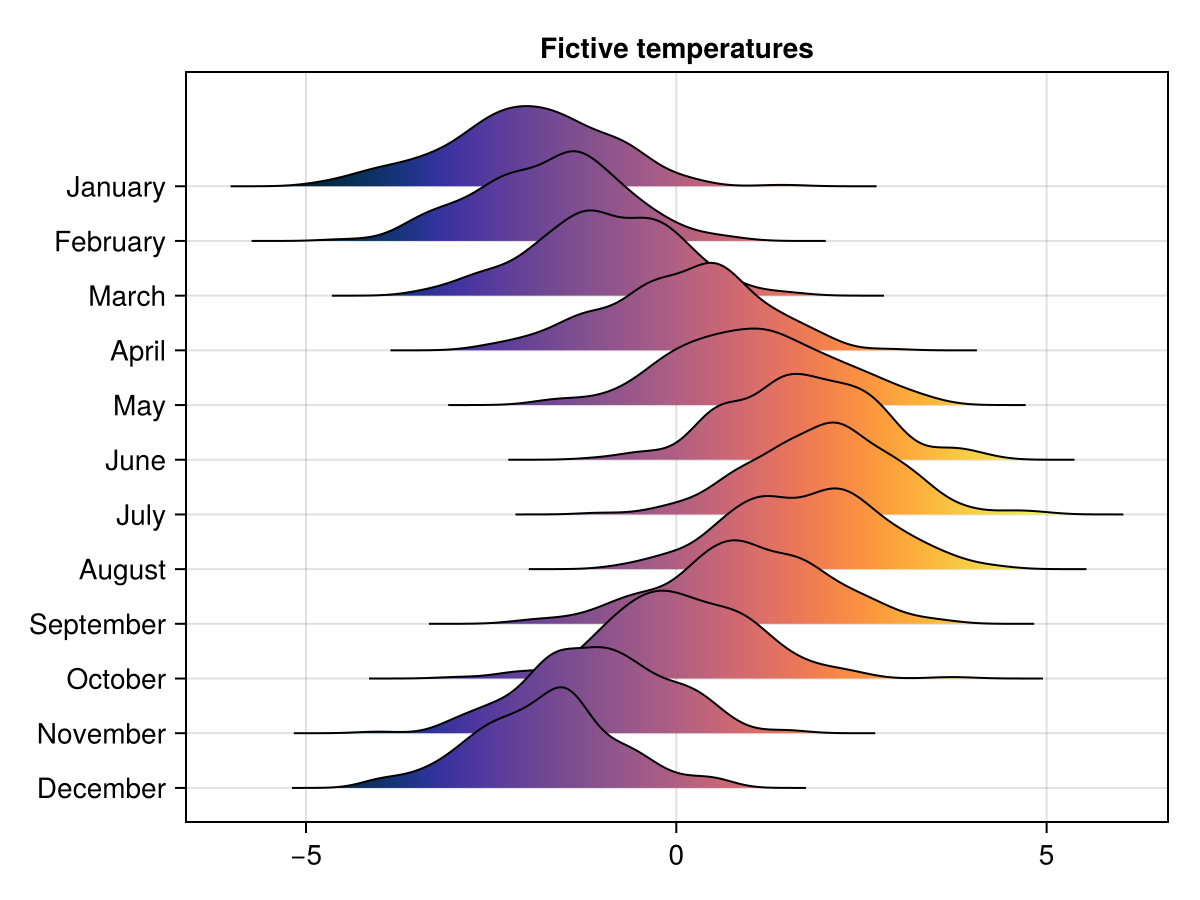
Due to technical limitations, if you color the :vertical dimension (or :horizontal with direction = :y), only a colormap made with just two colors can currently work:
using CairoMakie
f = Figure()
Axis(f[1, 1])
for x in 1:5
    d = density!(x * randn(200) .+ 3x,
        color = :y, colormap = [:darkblue, :gray95])
end
f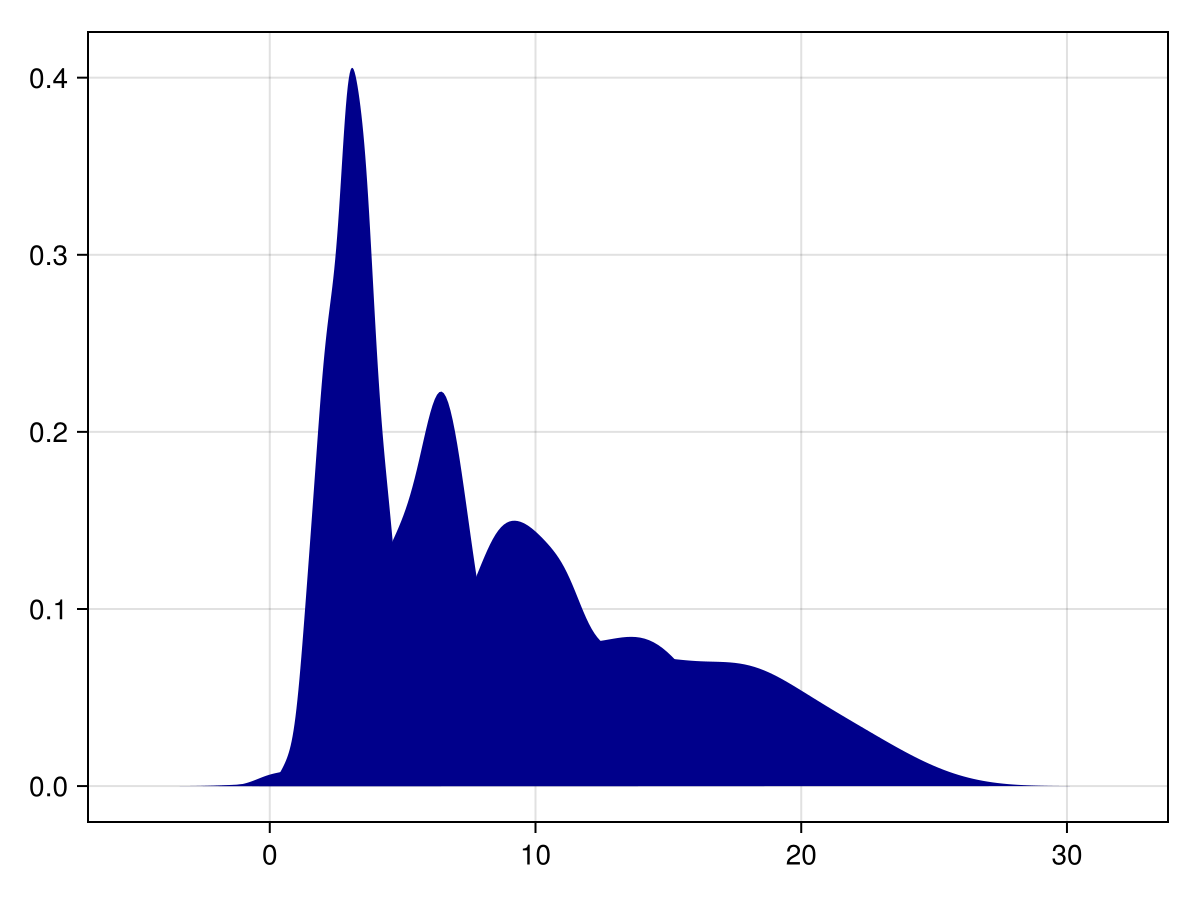
Using statistical weights
using CairoMakie
using Distributions


N = 100_000
x = rand(Uniform(-2, 2), N)

w = pdf.(Normal(), x)

fig = Figure()
density(fig[1,1], x)
density(fig[1,2], x, weights = w)

fig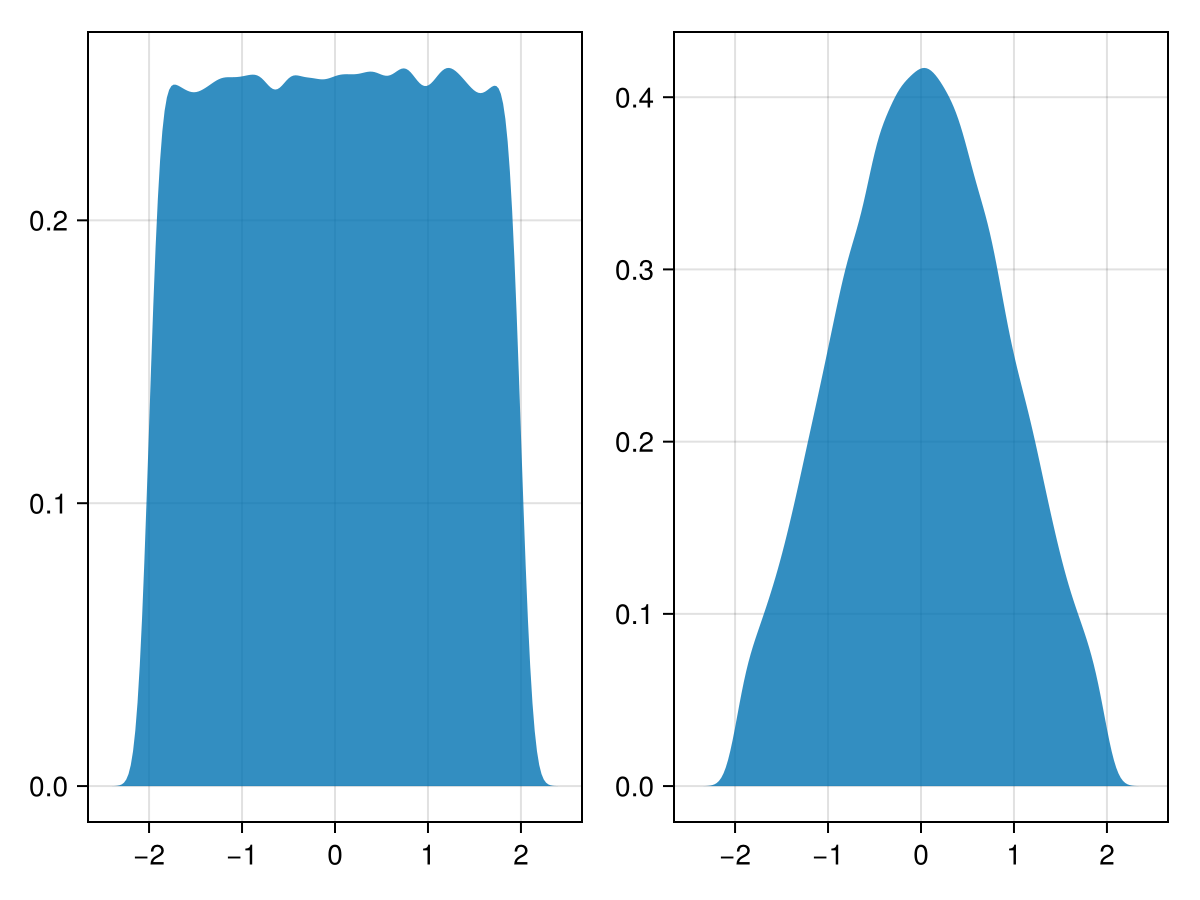
Attributes
alpha
Defaults to 1.0
The alpha value of the colormap or color attribute. Multiple alphas like in plot(alpha=0.2, color=(:red, 0.5), will get multiplied.
bandwidth
Defaults to automatic
Kernel density bandwidth, determined automatically if automatic.
boundary
Defaults to automatic
Boundary of the density estimation, determined automatically if automatic.
color
Defaults to @inherit patchcolor
Usually set to a single color, but can also be set to :x or :y to color with a gradient. If you use :y when direction = :x (or vice versa), note that only 2-element colormaps can work correctly.
colormap
Defaults to @inherit colormap
No docs available.
colorrange
Defaults to Makie.automatic
No docs available.
colorscale
Defaults to identity
No docs available.
cycle
Defaults to [:color => :patchcolor]
No docs available.
direction
Defaults to :x
The dimension along which the values are distributed. Can be :x or :y.
inspectable
Defaults to @inherit inspectable
No docs available.
linestyle
Defaults to nothing
No docs available.
npoints
Defaults to 200
The resolution of the estimated curve along the dimension set in direction.
offset
Defaults to 0.0
Shift the density baseline, for layering multiple densities on top of each other.
strokearound
Defaults to false
No docs available.
strokecolor
Defaults to @inherit patchstrokecolor
No docs available.
strokewidth
Defaults to @inherit patchstrokewidth
No docs available.
weights
Defaults to automatic
Assign a vector of statistical weights to values.