
Axis
Creating an Axis
The Axis is a 2D axis that works well with automatic layouts. Here's how you create one
using CairoMakie

f = Figure()

ax = Axis(f[1, 1], xlabel = "x label", ylabel = "y label",
    title = "Title")

f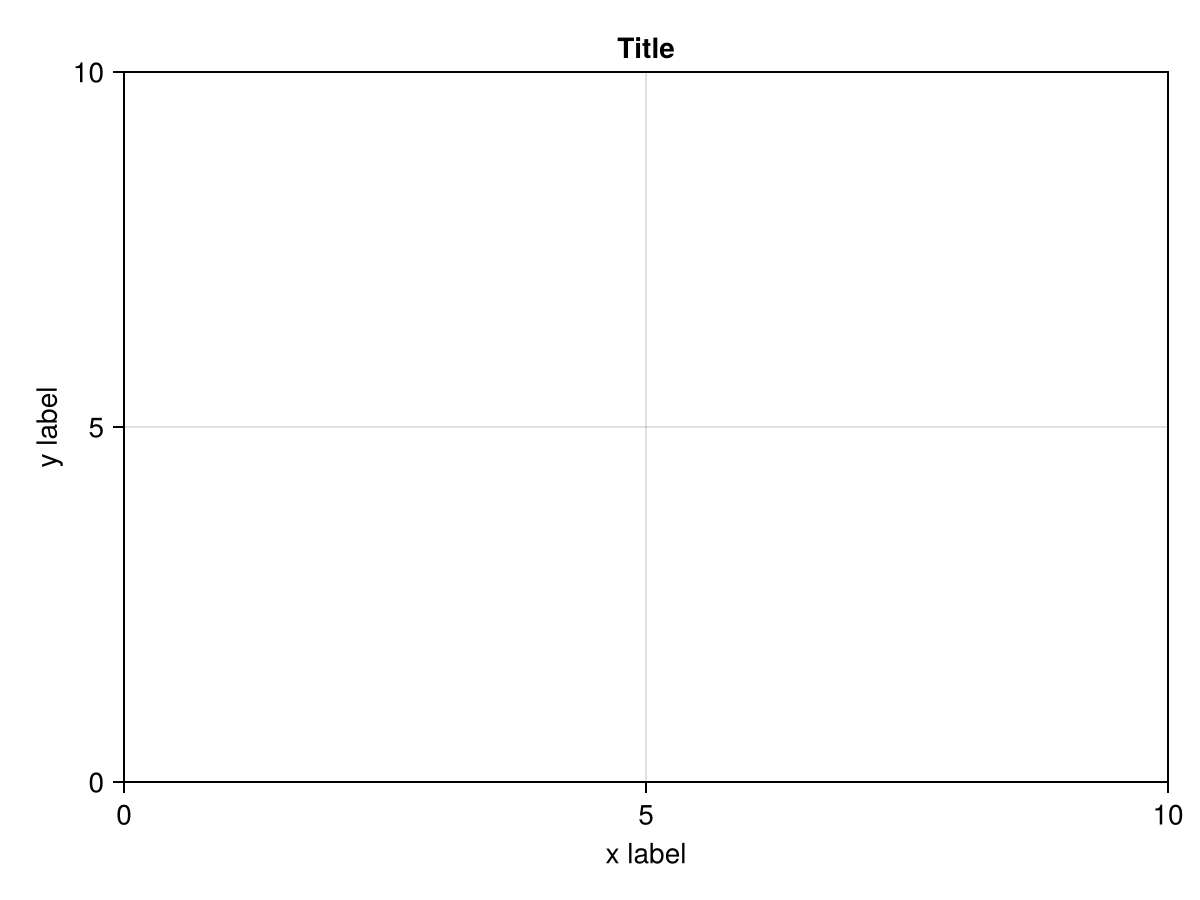
Plotting into an Axis
You can use all the normal mutating 2D plotting functions with an Axis. These functions return the created plot object. Omitting the ax argument plots into the current_axis(), which is usually the axis that was last created.
lineobject = lines!(ax, 0..10, sin, color = :red)
scatobject = scatter!(0:0.5:10, cos, color = :orange)

f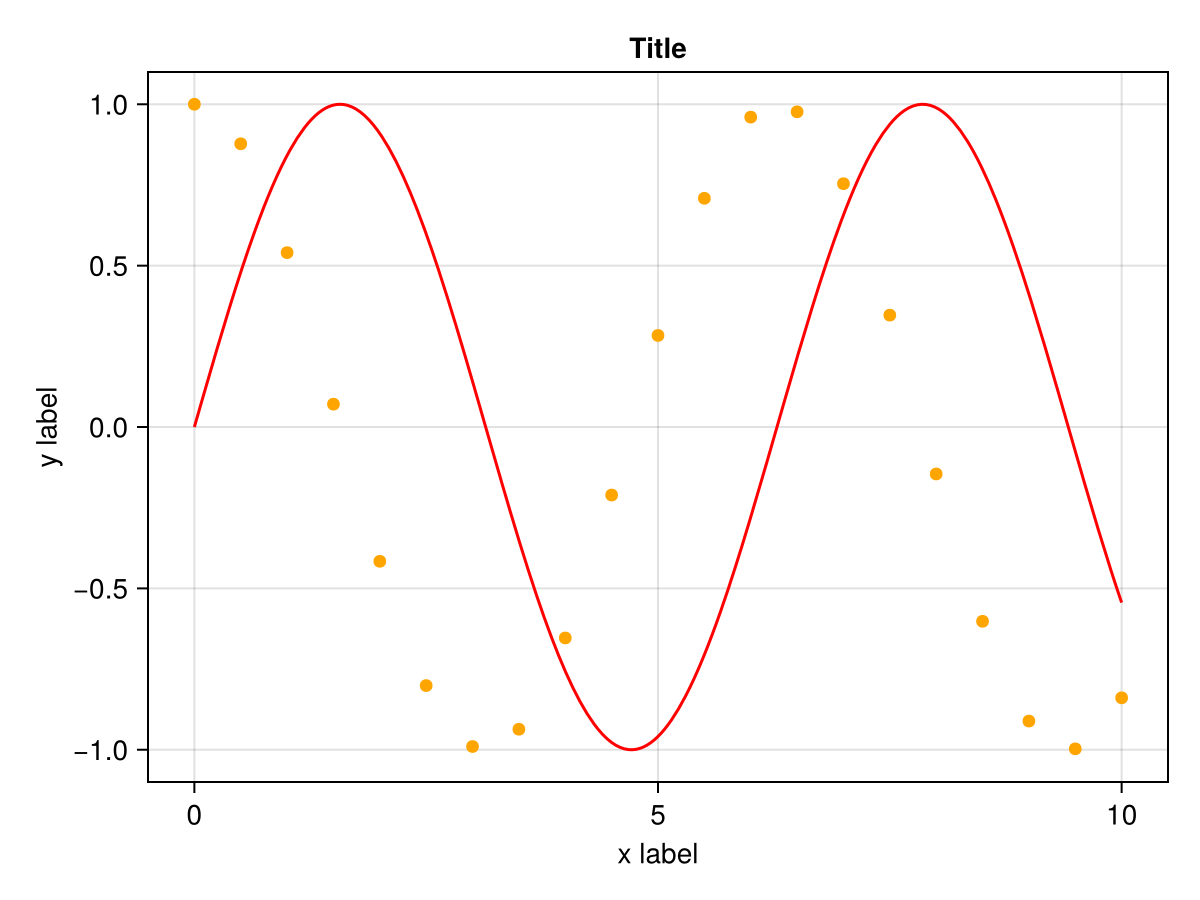
Deleting plots
You can delete a plot object directly via delete!(ax, plotobj). You can also remove all plots with empty!(ax).
using CairoMakie
f = Figure()

axs = [Axis(f[1, i]) for i in 1:3]

scatters = map(axs) do ax
    [scatter!(ax, 0:0.1:10, x -> sin(x) + i) for i in 1:3]
end

delete!(axs[2], scatters[2][2])
empty!(axs[3])

f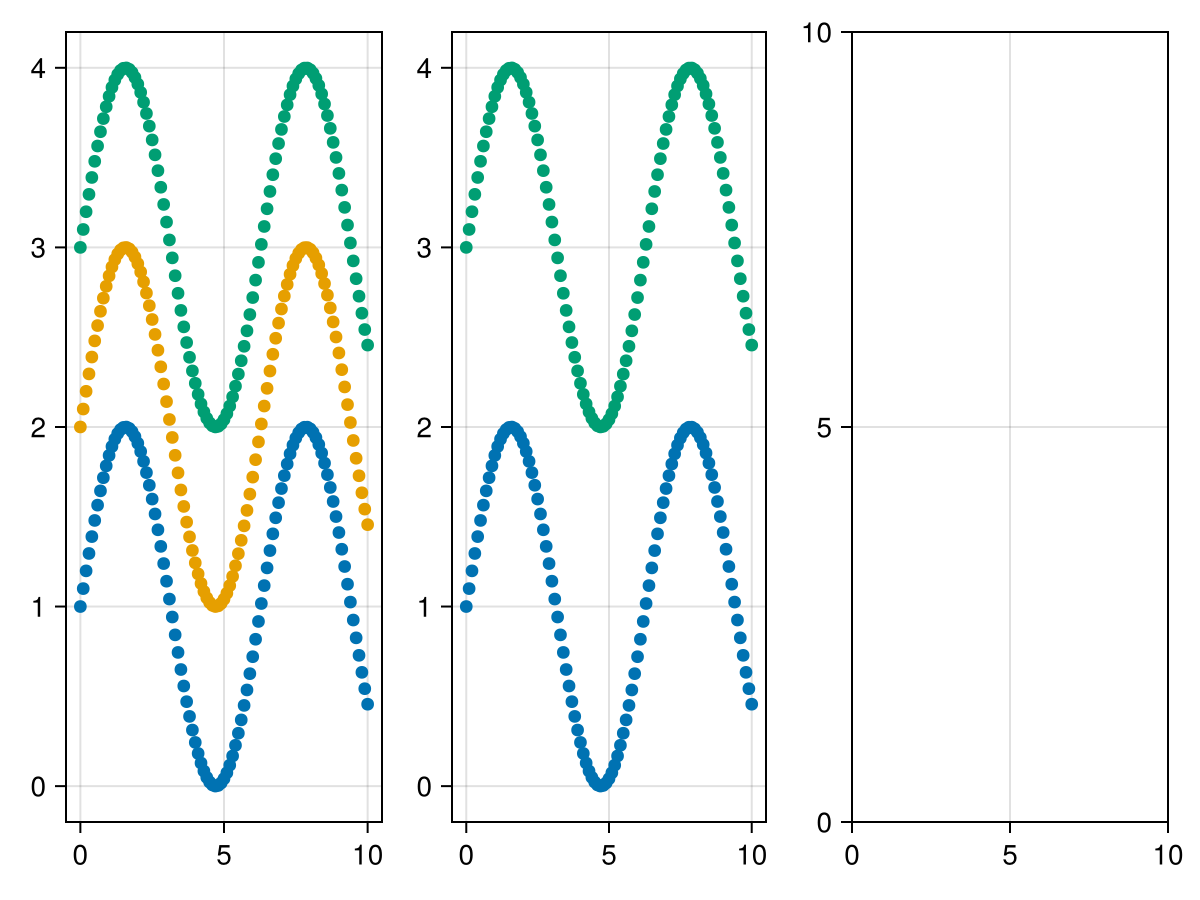
Hiding Axis spines and decorations
You can hide all axis elements manually, by setting their specific visibility attributes to false, like xticklabelsvisible, but that can be tedious. There are a couple of convenience functions for this.
To hide spines, you can use hidespines!.
using CairoMakie
f = Figure()

ax1 = Axis(f[1, 1], title = "Axis 1")
ax2 = Axis(f[1, 2], title = "Axis 2")

hidespines!(ax1)
hidespines!(ax2, :t, :r) # only top and right

f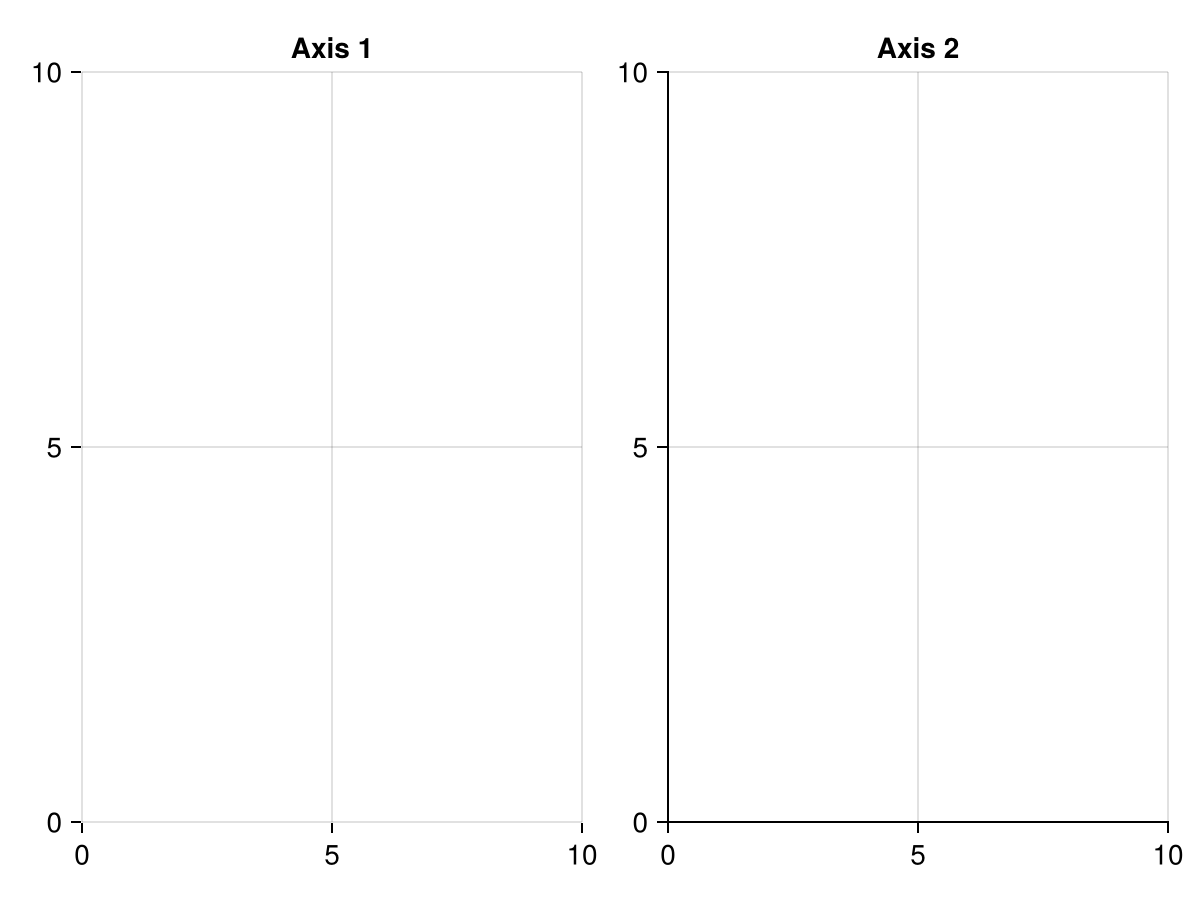
To hide decorations, you can use hidedecorations!, or the specific hidexdecorations! and hideydecorations!. When hiding, you can set label = false, ticklabels = false, ticks = false, grid = false, minorgrid = false or minorticks = false as keyword arguments if you want to keep those elements. It's common, e.g., to hide everything but the grid lines in facet plots.
using CairoMakie

f = Figure()

ax1 = Axis(f[1, 1], title = "Axis 1")
ax2 = Axis(f[1, 2], title = "Axis 2")
ax3 = Axis(f[1, 3], title = "Axis 3")

hidedecorations!(ax1)
hidexdecorations!(ax2, grid = false)
hideydecorations!(ax3, ticks = false)

f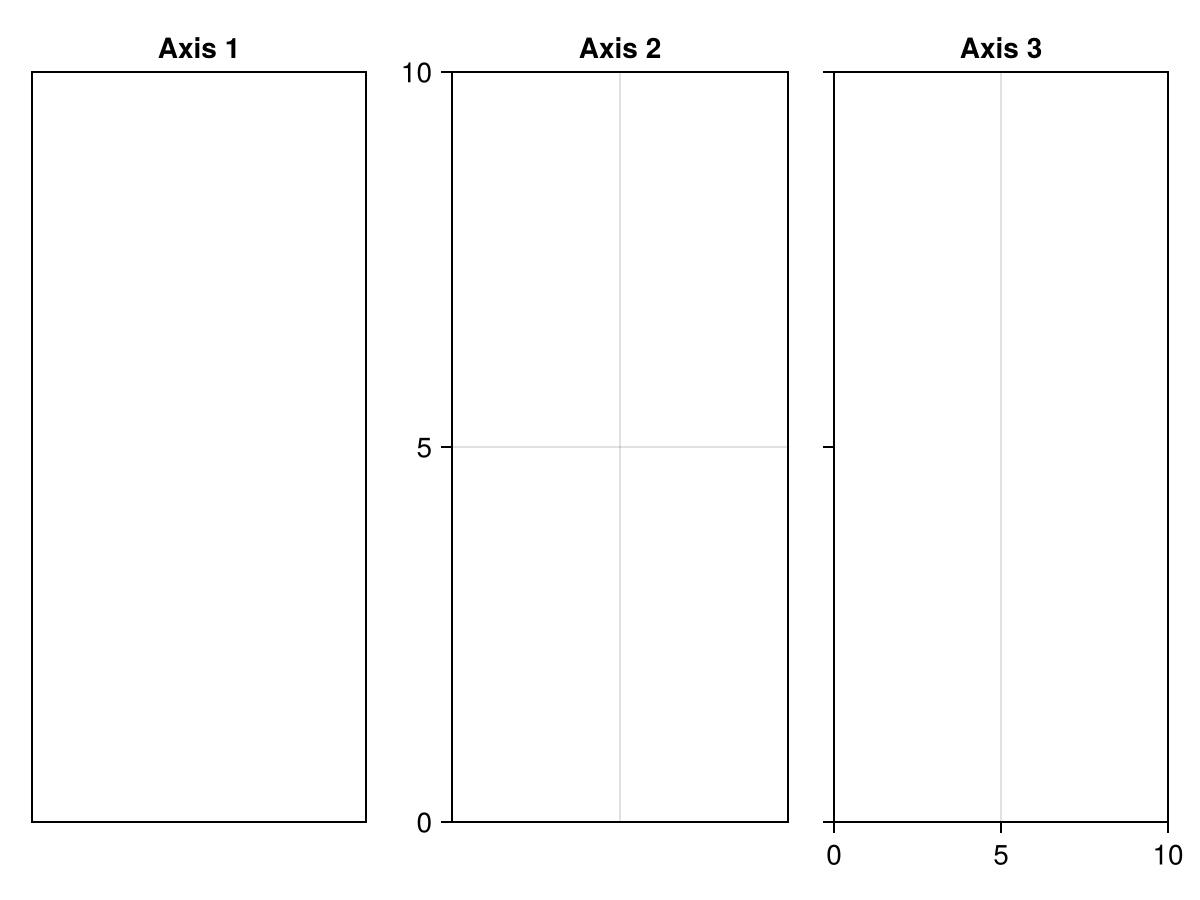
Linking axes
You can link axes to each other. Every axis simply keeps track of a list of other axes which it updates when it is changed itself. You can link x and y dimensions separately.
using CairoMakie

f = Figure()

ax1 = Axis(f[1, 1])
ax2 = Axis(f[1, 2])
ax3 = Axis(f[2, 2])

linkyaxes!(ax1, ax2)
linkxaxes!(ax2, ax3)

ax1.title = "y linked"
ax2.title = "x & y linked"
ax3.title = "x linked"

for (i, ax) in enumerate([ax1, ax2, ax3])
    lines!(ax, 1:10, 1:10, color = "green")
    if i != 1
        lines!(ax, 11:20, 1:10, color = "red")
    end
    if i != 3
        lines!(ax, 1:10, 11:20, color = "blue")
    end
end

f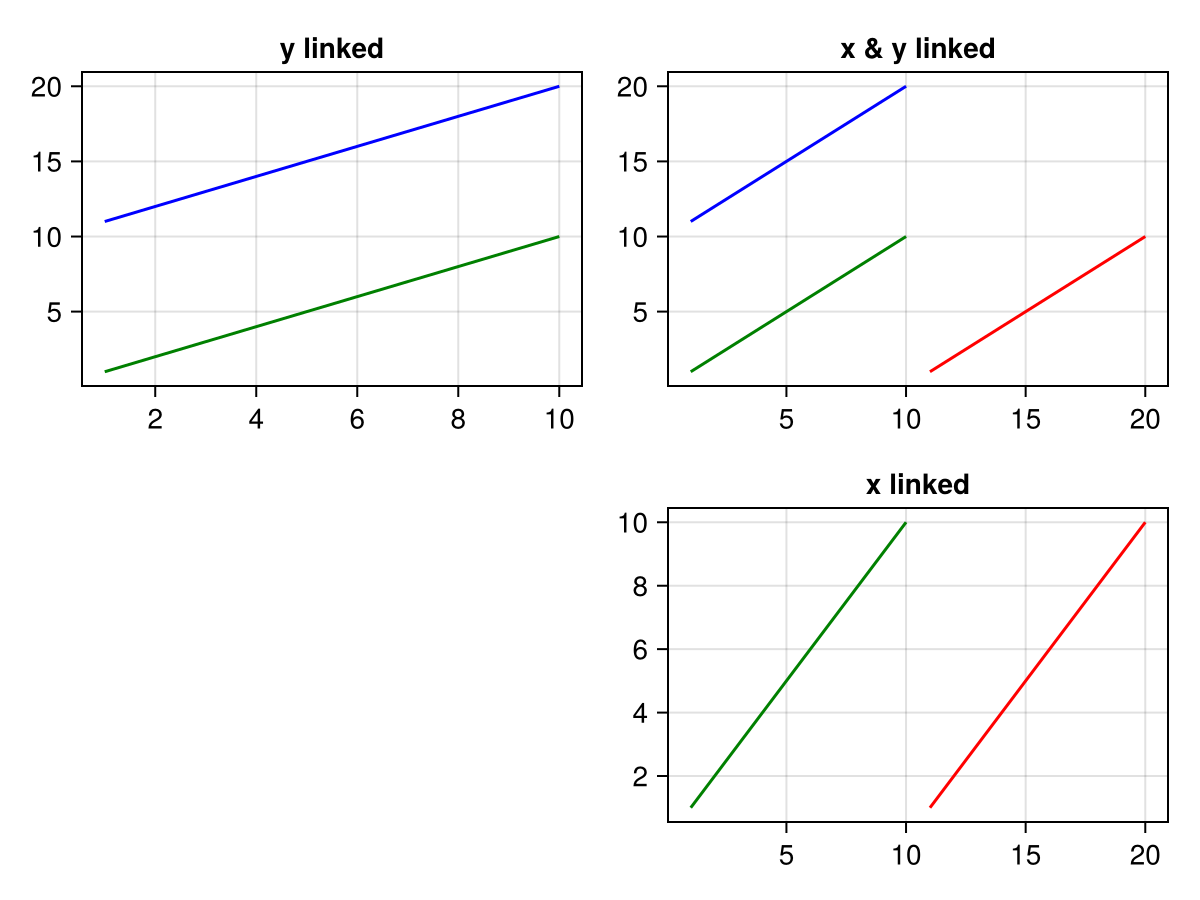
Aligning neighboring axis labels
When placing axes with different ticks next to each other it can be desirable to visually align the labels of these axes. By default, the space allocated for the ticklabels is minimized. This value can be fixed by using the functions tight_xticklabel_spacing!, tight_yticklabel_spacing! or tight_ticklabel_spacing! for both.
Note how x and y labels are misaligned in this figure due to different tick label lengths.
using CairoMakie

f = Figure()

ax1 = Axis(f[1, 1], title = "Axis 1", ylabel = "y label", ytickformat = "{:.3f}")
ax2 = Axis(f[2, 1], title = "Axis 2", ylabel = "y label", xlabel = "x label")
ax3 = Axis(f[2, 2], title = "Axis 3", xlabel = "x label", xtickformat = "{:.3f}", xticklabelrotation = pi/4)

f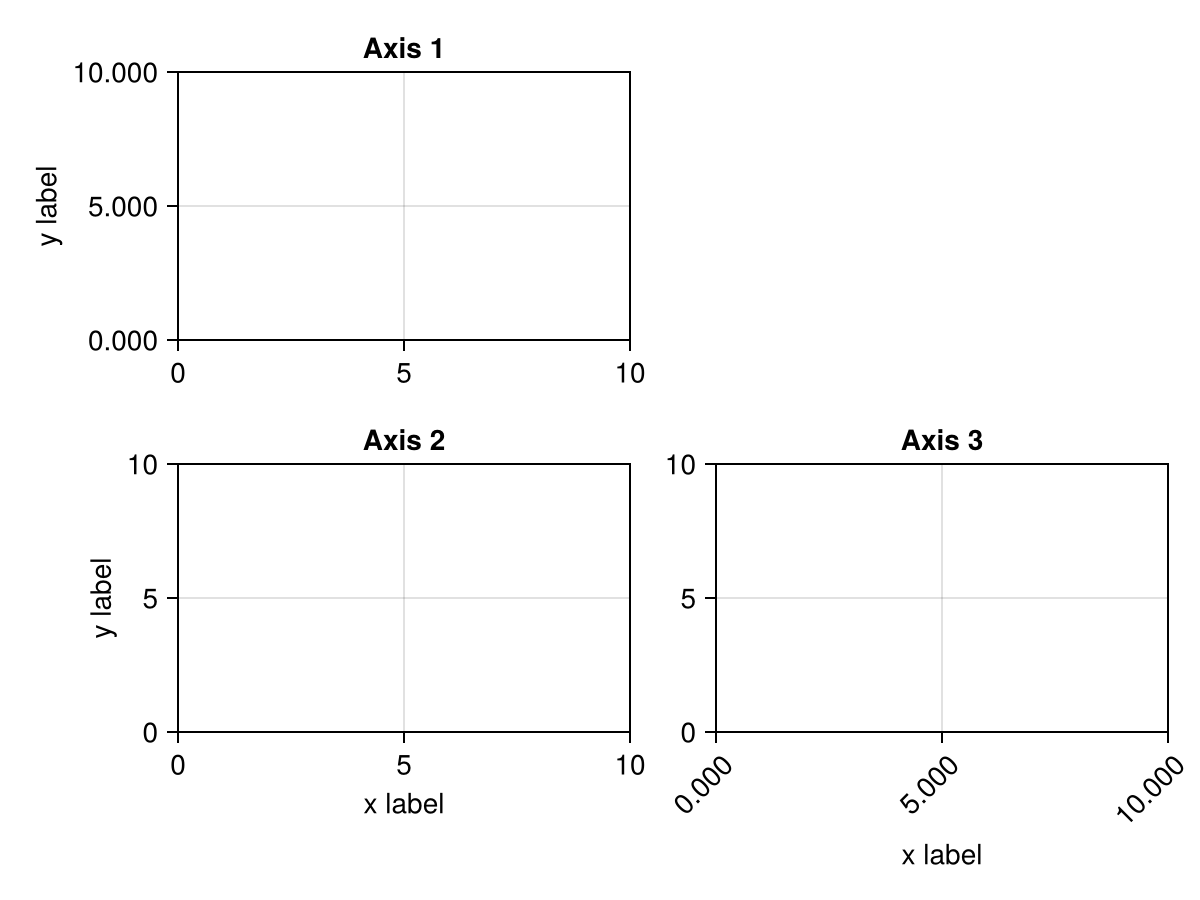
To align the labels, we can set the xticklabelspace or yticklabelspace attributes of the linked axes to the maximum space.
yspace = maximum(tight_yticklabel_spacing!, [ax1, ax2])
xspace = maximum(tight_xticklabel_spacing!, [ax2, ax3])

ax1.yticklabelspace = yspace
ax2.yticklabelspace = yspace

ax2.xticklabelspace = xspace
ax3.xticklabelspace = xspace

f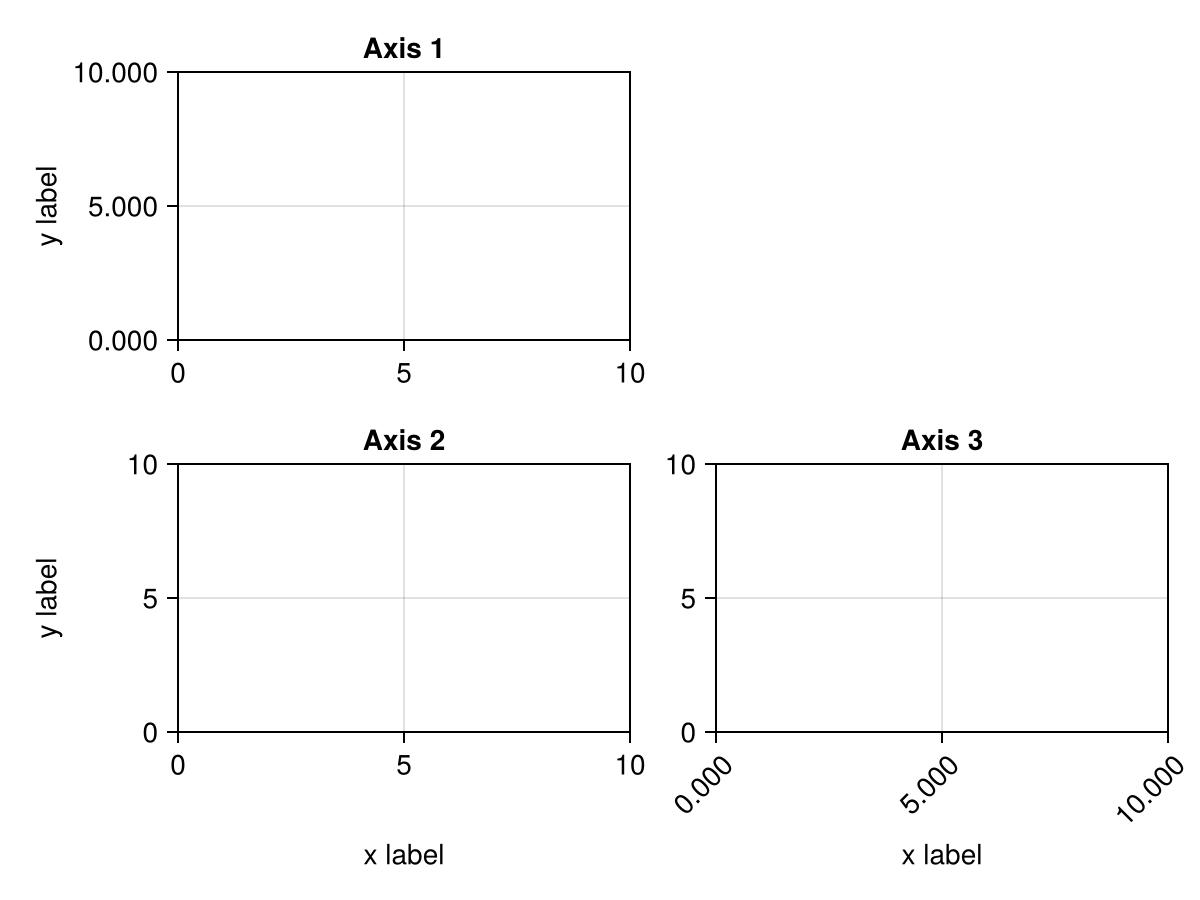
Creating a twin axis
There is currently no dedicated function to do this, but you can simply add an Axis on top of another, then hide everything but the second axis.
Here's an example how to do this with a second y axis on the right.
using CairoMakie

f = Figure()

ax1 = Axis(f[1, 1], yticklabelcolor = :blue)
ax2 = Axis(f[1, 1], yticklabelcolor = :red, yaxisposition = :right)
hidespines!(ax2)
hidexdecorations!(ax2)

lines!(ax1, 0..10, sin, color = :blue)
lines!(ax2, 0..10, x -> 100 * cos(x), color = :red)

f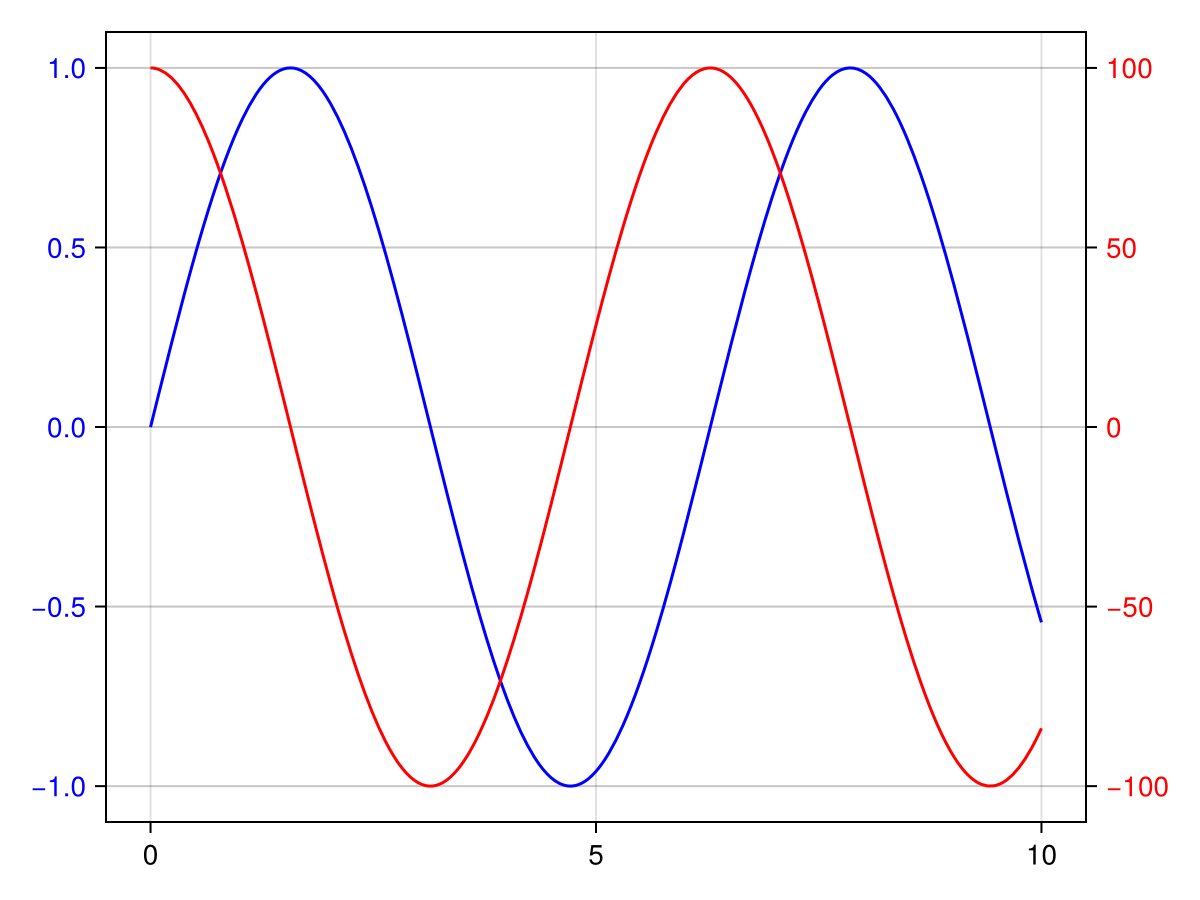
Axis interaction
An Axis has a couple of predefined interactions enabled.
Scroll zoom
You can zoom in an axis by scrolling in and out. If you press x or y while scrolling, the zoom movement is restricted to that dimension. These keys can be changed with the attributes xzoomkey and yzoomkey. You can also restrict the zoom dimensions all the time by setting the axis attributes xzoomlock or yzoomlock to true.
Drag pan
You can pan around the axis by right-clicking and dragging. If you press x or y while panning, the pan movement is restricted to that dimension. These keys can be changed with the attributes xpankey and ypankey. You can also restrict the pan dimensions all the time by setting the axis attributes xpanlock or ypanlock to true.
Limit reset
You can reset the limits with ctrl + leftclick. This is the same as doing reset_limits!(ax). This sets the limits back to the values stored in ax.limits, and if they are nothing, computes them automatically. If you have previously called limits!, xlims! or ylims!, these settings therefore stay intact when doing a limit reset.
You can alternatively press ctrl + shift + leftclick, which is the same as calling autolimits!(ax). This function ignores previously set limits and computes them all anew given the axis content.
These key combination can be adjusted with resetlimitskey and recomputelimitskey.
Rectangle selection zoom
Left-click and drag zooms into the selected rectangular area. If you press x or y while panning, only the respective dimension is affected. You can also restrict the selection zoom dimensions all the time by setting the axis attributes xrectzoom or yrectzoom to true.
Custom interactions
The interaction system is an additional abstraction upon Makie's low-level event system to make it easier to quickly create your own interaction patterns.
Registering and deregistering interactions
To register a new interaction, call register_interaction!(ax, name::Symbol, interaction). The interaction argument can be of any type.
To remove an existing interaction completely, call deregister_interaction!(ax, name::Symbol). You can check which interactions are currently active by calling interactions(ax). The default interactions are :dragpan, :limitreset, :rectanglezoom and :scrollzoom.
Activating and deactivating interactions
Often, you don't want to remove an interaction entirely but only disable it for a moment, then re-enable it again. You can use the functions activate_interaction!(ax, name::Symbol) and deactivate_interaction!(ax, name::Symbol) for that.
Function interaction
If interaction is a Function, it should accept two arguments, which correspond to an event and the axis. This function will then be called whenever the axis generates an event.
Here's an example of such a function. Note that we use the special dispatch signature for Functions that allows to use the do-syntax:
register_interaction!(ax, :my_interaction) do event::MouseEvent, axis
    if event.type === MouseEventTypes.leftclick
        println("You clicked on the axis!")
    end
end
As you can see, it's possible to restrict the type parameter of the event argument. Choices are one of MouseEvent, KeysEvent or ScrollEvent if you only want to handle a specific class. Your function can also have multiple methods dealing with each type.
Custom object interaction
The function option is most suitable for interactions that don't involve much state. A more verbose but flexible option is available. For this, you define a new type which typically holds all the state variables you're interested in.
Whenever the axis generates an event, it calls process_interaction(interaction, event, axis) on all stored interactions. By defining process_interaction for specific types of interaction and event, you can create more complex interaction patterns.
Here's an example with simple state handling where we allow left clicks while l is pressed, and right clicks while r is pressed:
mutable struct MyInteraction
    allow_left_click::Bool
    allow_right_click::Bool
end

function Makie.process_interaction(interaction::MyInteraction, event::MouseEvent, axis)
    if interaction.allow_left_click && event.type === MouseEventTypes.leftclick
        println("Left click in correct mode")
    end
    if interaction.allow_right_click && event.type === MouseEventTypes.rightclick
        println("Right click in correct mode")
    end
end

function Makie.process_interaction(interaction::MyInteraction, event::KeysEvent, axis)
    interaction.allow_left_click = Keyboard.l in event.keys
    interaction.allow_right_click = Keyboard.r in event.keys
end

register_interaction!(ax, :left_and_right, MyInteraction(false, false))
Setup and cleanup
Some interactions might have more complex state involving plot objects that need to be setup or removed. For those purposes, you can overload the methods registration_setup!(parent, interaction) and deregistration_cleanup!(parent, interaction) which are called during registration and deregistration, respectively.
Attributes
alignmode
Defaults to Inside()
The align mode of the axis in its parent GridLayout.
aspect
Defaults to nothing
Controls the forced aspect ratio of the axis.
The default nothing will not constrain the aspect ratio. The axis area will span the available width and height in the layout.
DataAspect() reduces the effective axis size within the available layout space so that the axis aspect ratio width/height matches that of the data limits. For example, if the x limits range from 0 to 300 and the y limits from 100 to 250, DataAspect() will result in an aspect ratio of (300 - 0) / (250 - 100) = 2. This can be useful when plotting images, because the image will be displayed unsquished.
AxisAspect(ratio) reduces the effective axis size within the available layout space so that the axis aspect ratio width/height matches ratio.
Note that both DataAspect and AxisAspect can result in excess whitespace around the axis. To make a GridLayout aware of aspect ratio constraints, refer to the Aspect column or row size setting.
using CairoMakie
using FileIO

f = Figure()

ax1 = Axis(f[1, 1], aspect = nothing, title = "nothing")
ax2 = Axis(f[1, 2], aspect = DataAspect(), title = "DataAspect()")
ax3 = Axis(f[2, 1], aspect = AxisAspect(1), title = "AxisAspect(1)")
ax4 = Axis(f[2, 2], aspect = AxisAspect(2), title = "AxisAspect(2)")

img = rotr90(load(assetpath("cow.png")))
for ax in [ax1, ax2, ax3, ax4]
    image!(ax, img)
end

f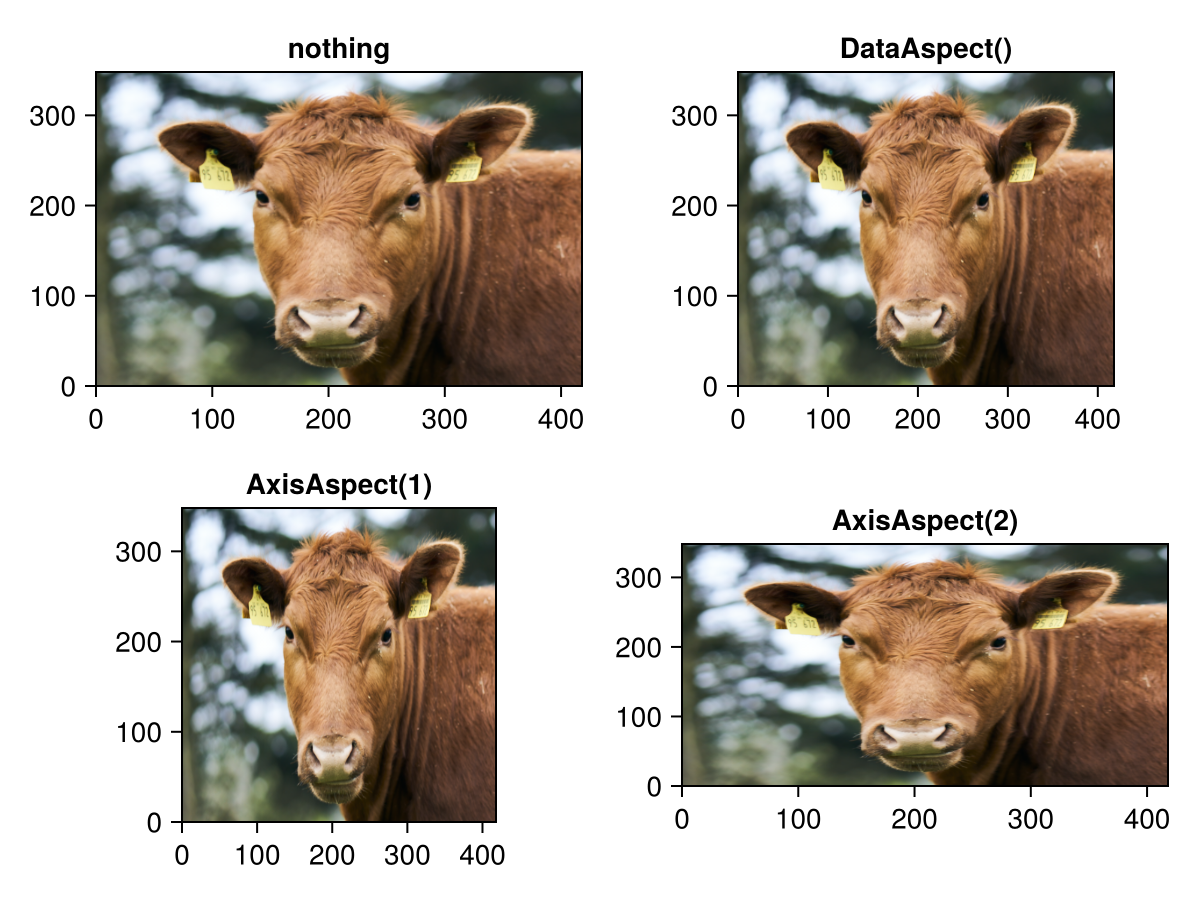
autolimitaspect
Defaults to nothing
If autolimitaspect is set to a number, the limits of the axis will autoadjust such that the ratio of the limits to the axis size equals that number.
For example, if the axis size is 100 x 200, then with autolimitaspect = 1, the autolimits will also have a ratio of 1 to 2. The setting autolimitaspect = 1 is the complement to aspect = AxisAspect(1), but while aspect changes the axis size, autolimitaspect changes the limits to achieve the desired ratio.
Warning
autolimitaspect can introduce cyclical updates which result in stack overflow errors. This happens when the expanded limits have different ticks than the unexpanded ones. The difference in size causes a relayout which might again result in different autolimits to match the new aspect ratio, new ticks and again a relayout.
You can hide the ticklabels or fix xticklabelspace and yticklabelspace to avoid the relayouts. You can choose the amount of space manually or pick the current automatic one with tight_ticklabel_spacing!.
using CairoMakie
f = Figure()

ax1 = Axis(f[1, 1], autolimitaspect = nothing)
ax2 = Axis(f[1, 2], autolimitaspect = 1)

for ax in [ax1, ax2]
    lines!(ax, 0..10, sin)
end

f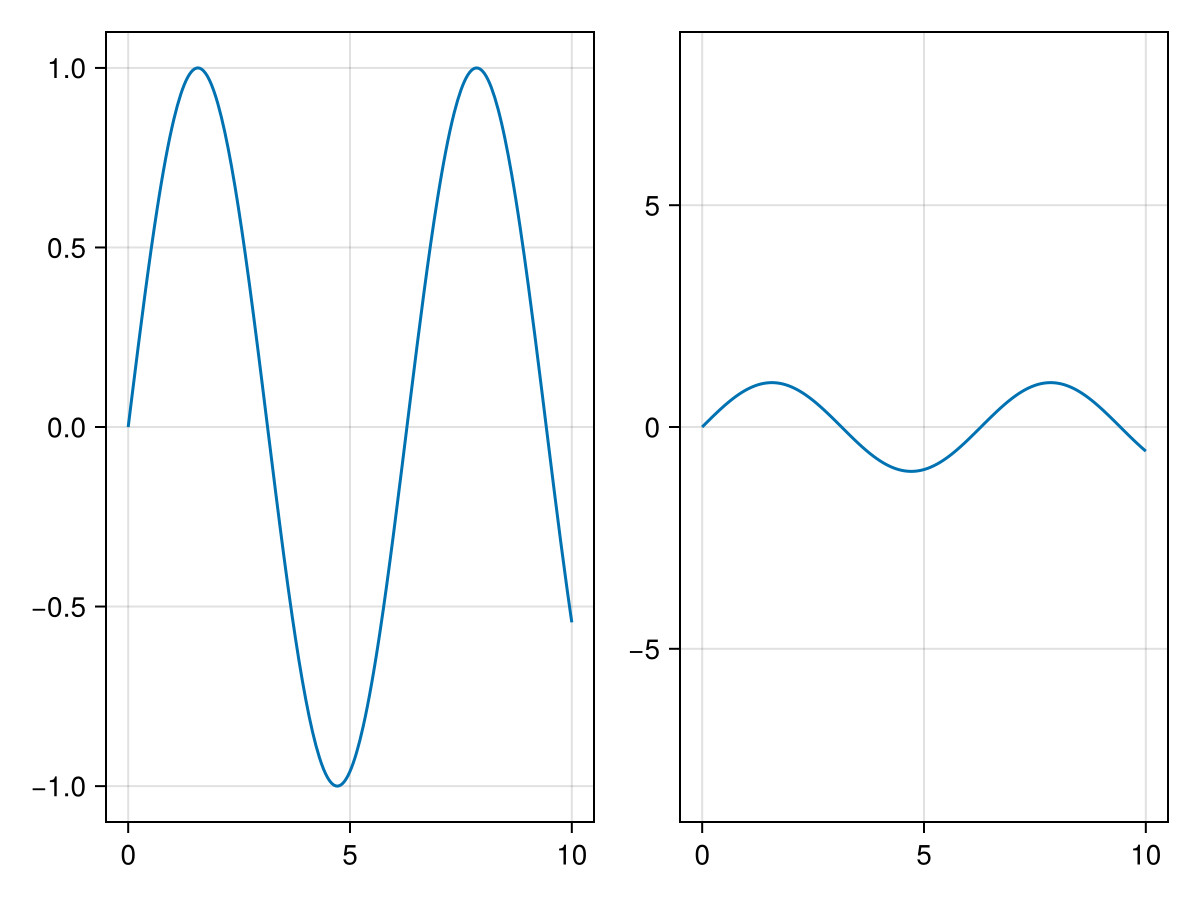
backgroundcolor
Defaults to :white
The background color of the axis.
using CairoMakie
    f = Figure()

    ax1 = Axis(f[1, 1])
    ax2 = Axis(f[1, 2], backgroundcolor = :gray80)

    f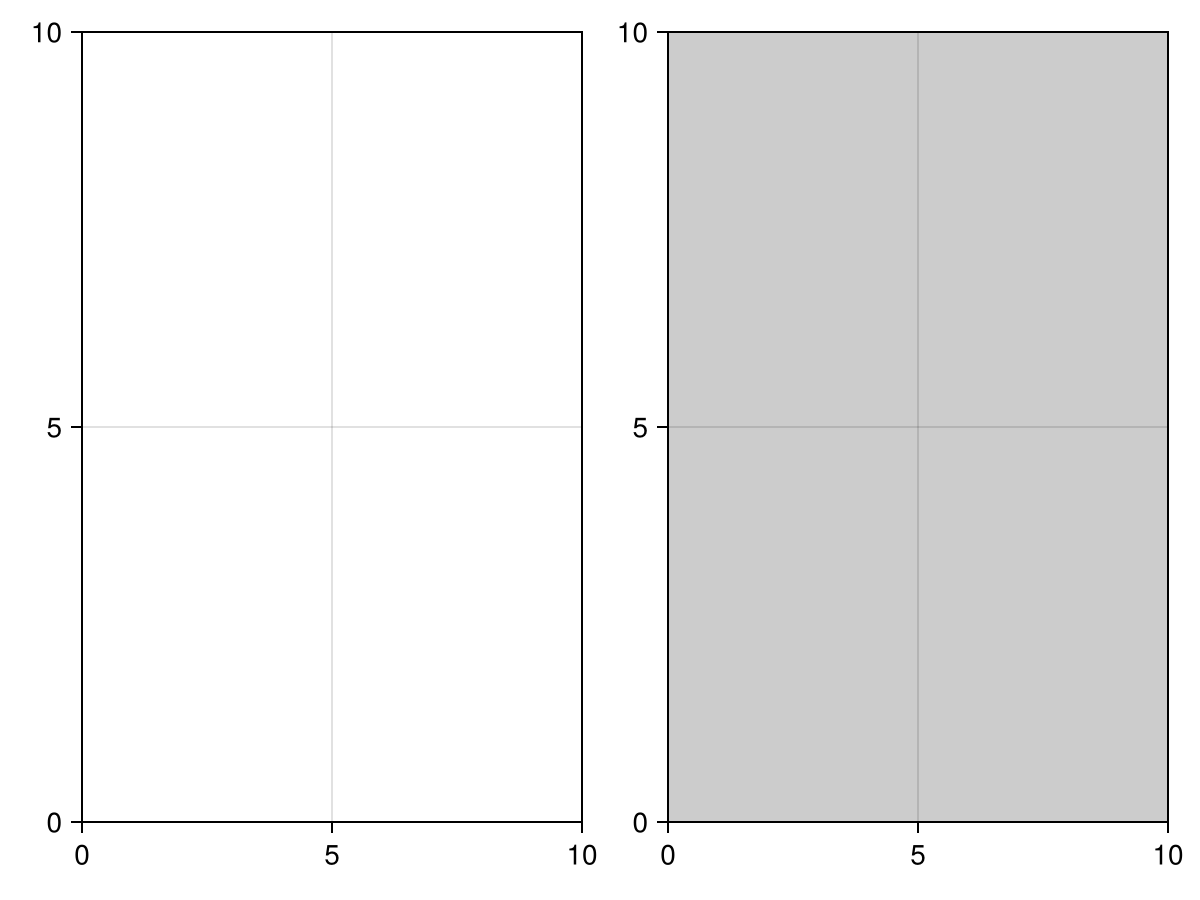
bottomspinecolor
Defaults to :black
The color of the bottom axis spine.
bottomspinevisible
Defaults to true
Controls if the bottom axis spine is visible.
dim1_conversion
Defaults to nothing
Global state for the x dimension conversion.
dim2_conversion
Defaults to nothing
Global state for the y dimension conversion.
flip_ylabel
Defaults to false
Controls if the ylabel's rotation is flipped.
halign
Defaults to :center
The horizontal alignment of the axis within its suggested bounding box.
height
Defaults to nothing
The height of the axis.
leftspinecolor
Defaults to :black
The color of the left axis spine.
leftspinevisible
Defaults to true
Controls if the left axis spine is visible.
limits
Defaults to (nothing, nothing)
Can be used to manually specify which axis limits are desired.
The limits attribute cannot be used to read out the actual limits of the axis. The value of limits does not change when interactively zooming and panning and the axis can be reset accordingly using the function reset_limits!.
The function autolimits! resets the value of limits to (nothing, nothing) and adjusts the axis limits according to the extents of the plots added to the axis.
The value of limits can be a four-element tuple (xlow, xhigh, ylow, yhigh) where each value can be a real number or nothing. It can also be a tuple (x, y) where x and y can be nothing or a tuple (low, high). In all cases, nothing means that the respective limit values will be automatically determined.
Automatically determined limits are also influenced by xautolimitmargin and yautolimitmargin.
The convenience functions xlims! and ylims! allow to set only the x or y part of limits. The function limits! is another option to set both x and y simultaneously.
using CairoMakie
f = Figure()

ax1 = Axis(f[1, 1], limits = (nothing, nothing), title = "(nothing, nothing)")
ax2 = Axis(f[1, 2], limits = (0, 4pi, -1, 1), title = "(0, 4pi, -1, 1)")
ax3 = Axis(f[2, 1], limits = ((0, 4pi), nothing), title = "((0, 4pi), nothing)")
ax4 = Axis(f[2, 2], limits = (nothing, 4pi, nothing, 1), title = "(nothing, 4pi, nothing, 1)")

for ax in [ax1, ax2, ax3, ax4]
    lines!(ax, 0..4pi, sin)
end

f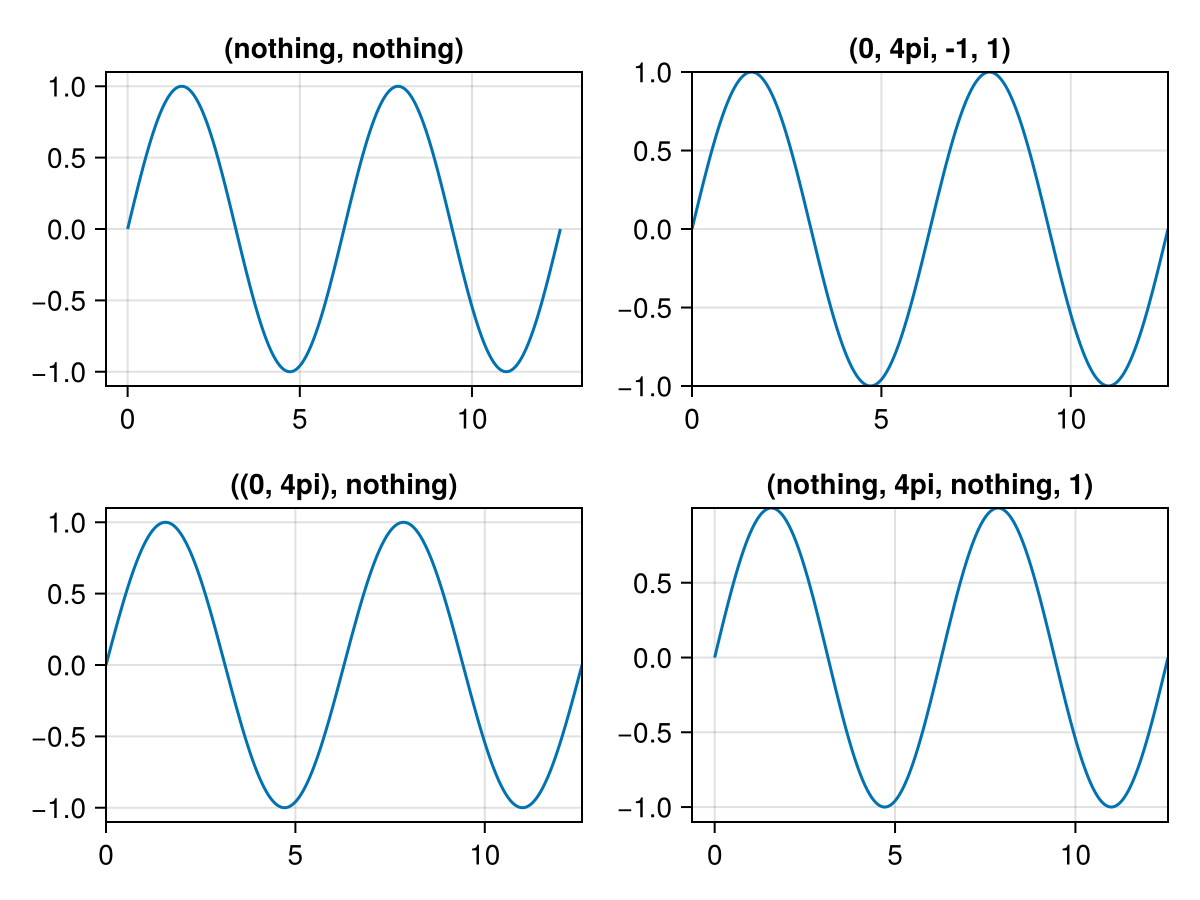
panbutton
Defaults to Makie.Mouse.right
The button for panning.
recomputelimitskey
Defaults to ((Keyboard.left_control | Keyboard.right_control) & (Keyboard.left_shift | Keyboard.right_shift)) & Mouse.left
The key (and button) combination for triggering a limit recalculation (equivalent to autolimits!(ax))
resetlimitskey
Defaults to Exclusively((Keyboard.left_control | Keyboard.right_control) & Mouse.left)
The key (and button) combination for triggering a limit reset (equivalent to reset_limits!(ax))
rightspinecolor
Defaults to :black
The color of the right axis spine.
rightspinevisible
Defaults to true
Controls if the right axis spine is visible.
spinewidth
Defaults to 1.0
The width of the axis spines.
subtitle
Defaults to ""
The content of the axis subtitle. The value can be any non-vector-valued object that the text primitive supports.
using CairoMakie
f = Figure()

Axis(f[1, 1], title = "Title", subtitle = "Subtitle")
Axis(f[2, 1], title = "Title", subtitle = L"\sum_i{x_i \times y_i}")
Axis(f[3, 1], title = "Title", subtitle = rich(
    "Rich text subtitle",
    subscript(" with subscript", color = :slategray)
))

f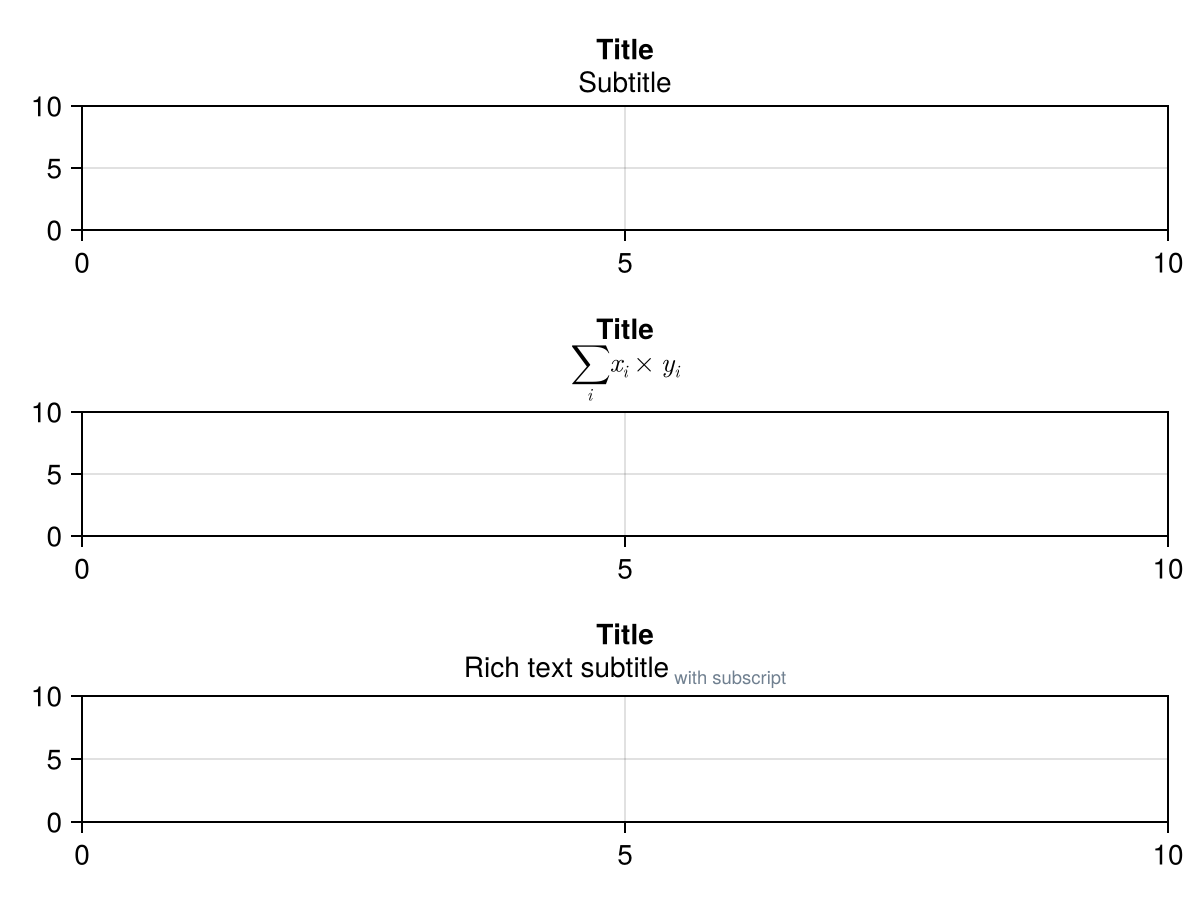
subtitlecolor
Defaults to @inherit :textcolor :black
The color of the subtitle
subtitlefont
Defaults to :regular
The font family of the subtitle.
subtitlegap
Defaults to 0
The gap between subtitle and title.
subtitlelineheight
Defaults to 1
The axis subtitle line height multiplier.
subtitlesize
Defaults to @inherit :fontsize 16.0f0
The subtitle's font size.
subtitlevisible
Defaults to true
Controls if the subtitle is visible.
tellheight
Defaults to true
Controls if the parent layout can adjust to this element's height
tellwidth
Defaults to true
Controls if the parent layout can adjust to this element's width
title
Defaults to ""
The content of the axis title. The value can be any non-vector-valued object that the text primitive supports.
using CairoMakie
f = Figure()

Axis(f[1, 1], title = "Title")
Axis(f[2, 1], title = L"\sum_i{x_i \times y_i}")
Axis(f[3, 1], title = rich(
    "Rich text title",
    subscript(" with subscript", color = :slategray)
))

f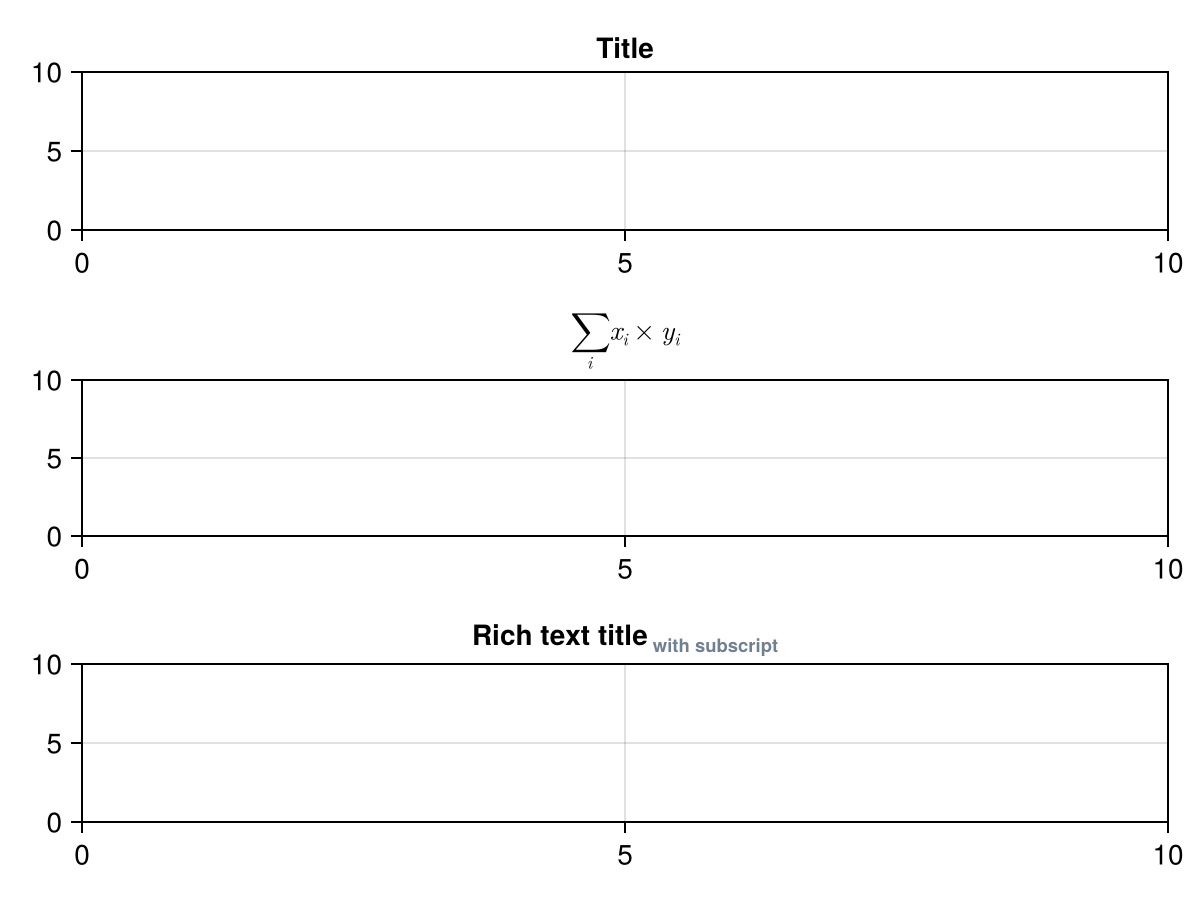
titlealign
Defaults to :center
The horizontal alignment of the title. The subtitle always follows this alignment setting.
Options are :center, :left or :right.
using CairoMakie
f = Figure()

Axis(f[1, 1], titlealign = :left, title = "Left aligned title")
Axis(f[2, 1], titlealign = :center, title = "Center aligned title")
Axis(f[3, 1], titlealign = :right, title = "Right aligned title")

f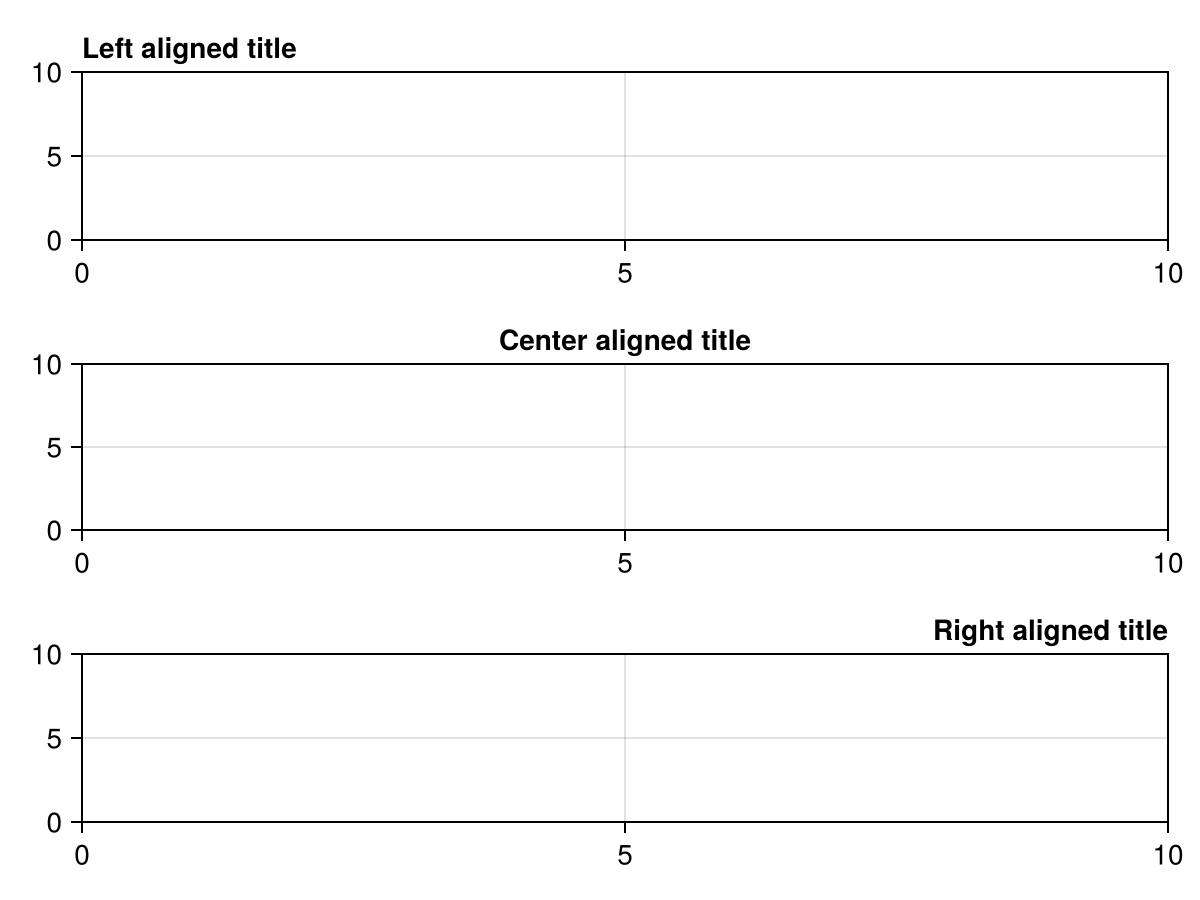
titlecolor
Defaults to @inherit :textcolor :black
The color of the title
titlefont
Defaults to :bold
The font family of the title.
titlegap
Defaults to 4.0
The gap between axis and title.
titlelineheight
Defaults to 1
The axis title line height multiplier.
titlesize
Defaults to @inherit :fontsize 16.0f0
The title's font size.
titlevisible
Defaults to true
Controls if the title is visible.
topspinecolor
Defaults to :black
The color of the top axis spine.
topspinevisible
Defaults to true
Controls if the top axis spine is visible.
valign
Defaults to :center
The vertical alignment of the axis within its suggested bounding box.
width
Defaults to nothing
The width of the axis.
xautolimitmargin
Defaults to (0.05f0, 0.05f0)
The relative margins added to the autolimits in x direction.
using CairoMakie
    f = Figure()

    data = 0:1

    ax1 = Axis(f[1, 1], xautolimitmargin = (0, 0), title = "xautolimitmargin = (0, 0)")
    ax2 = Axis(f[2, 1], xautolimitmargin = (0.05, 0.05), title = "xautolimitmargin = (0.05, 0.05)")
    ax3 = Axis(f[3, 1], xautolimitmargin = (0, 0.2), title = "xautolimitmargin = (0, 0.2)")

    for ax in [ax1, ax2, ax3]
        lines!(ax, data)
    end

    f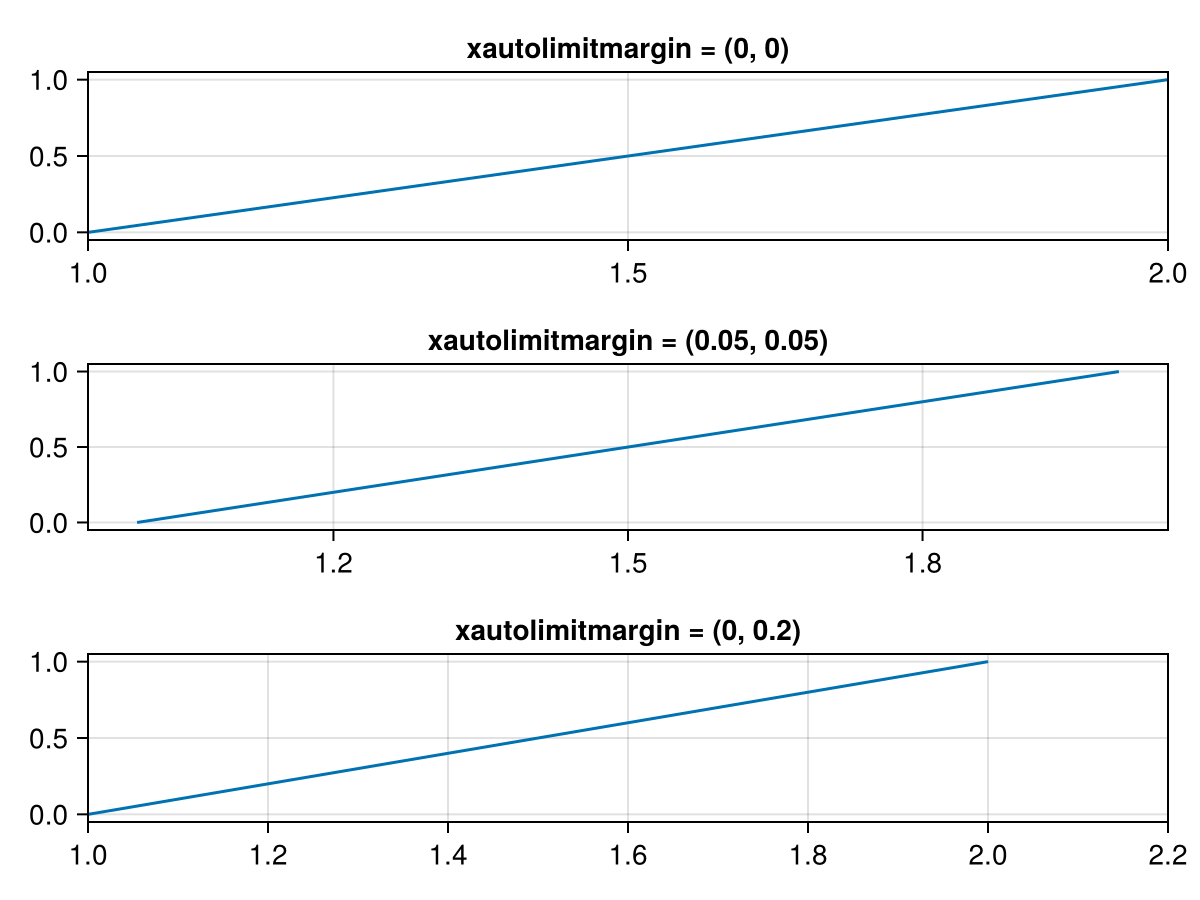
xaxisposition
Defaults to :bottom
The position of the x axis (:bottom or :top).
using CairoMakie
f = Figure()

Axis(f[1, 1], xaxisposition = :bottom)
Axis(f[1, 2], xaxisposition = :top)

f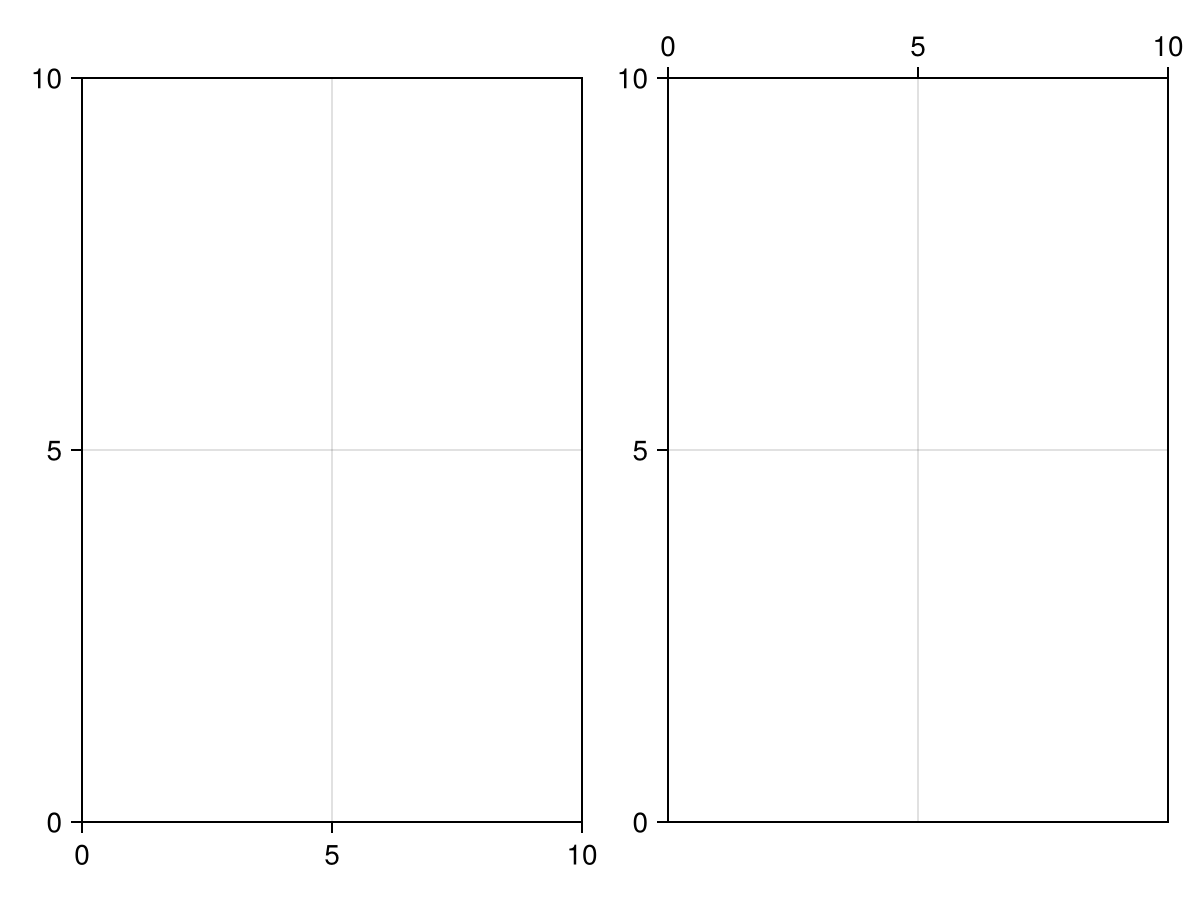
xgridcolor
Defaults to RGBAf(0, 0, 0, 0.12)
The color of the x grid lines.
xgridstyle
Defaults to nothing
The linestyle of the x grid lines.
xgridvisible
Defaults to true
Controls if the x grid lines are visible.
xgridwidth
Defaults to 1.0
The width of the x grid lines.
xlabel
Defaults to ""
The content of the x axis label. The value can be any non-vector-valued object that the text primitive supports.
using CairoMakie
f = Figure()

Axis(f[1, 1], xlabel = "X Label")
Axis(f[2, 1], xlabel = L"\sum_i{x_i \times y_i}")
Axis(f[3, 1], xlabel = rich(
    "X Label",
    subscript(" with subscript", color = :slategray)
))

f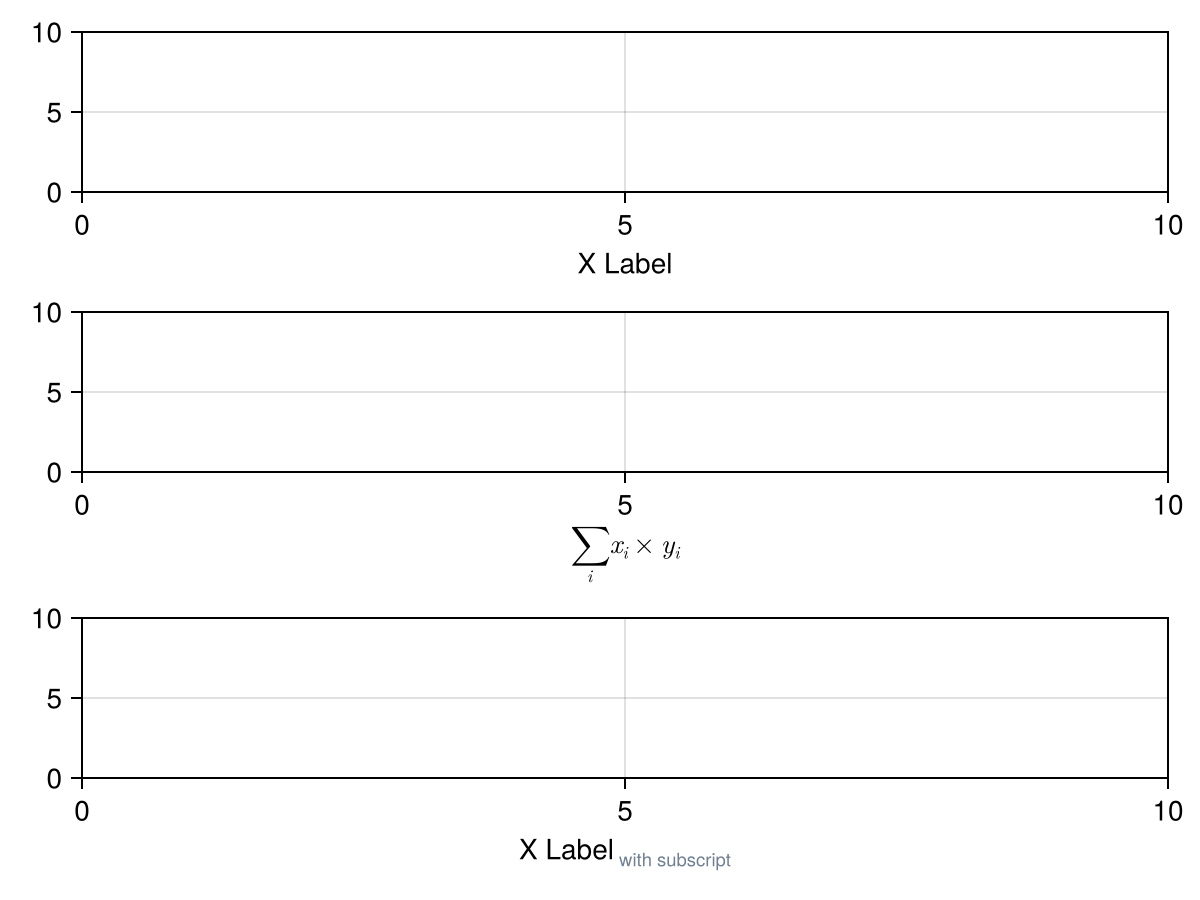
xlabelcolor
Defaults to @inherit :textcolor :black
The color of the xlabel.
xlabelfont
Defaults to :regular
The font family of the xlabel.
xlabelpadding
Defaults to 3.0
The additional padding between the xlabel and the ticks or axis.
using CairoMakie
    f = Figure()

    Axis(f[1, 1], xlabel = "X Label", xlabelpadding = 0, title = "xlabelpadding = 0")
    Axis(f[1, 2], xlabel = "X Label", xlabelpadding = 5, title = "xlabelpadding = 5")
    Axis(f[1, 3], xlabel = "X Label", xlabelpadding = 10, title = "xlabelpadding = 10")

    f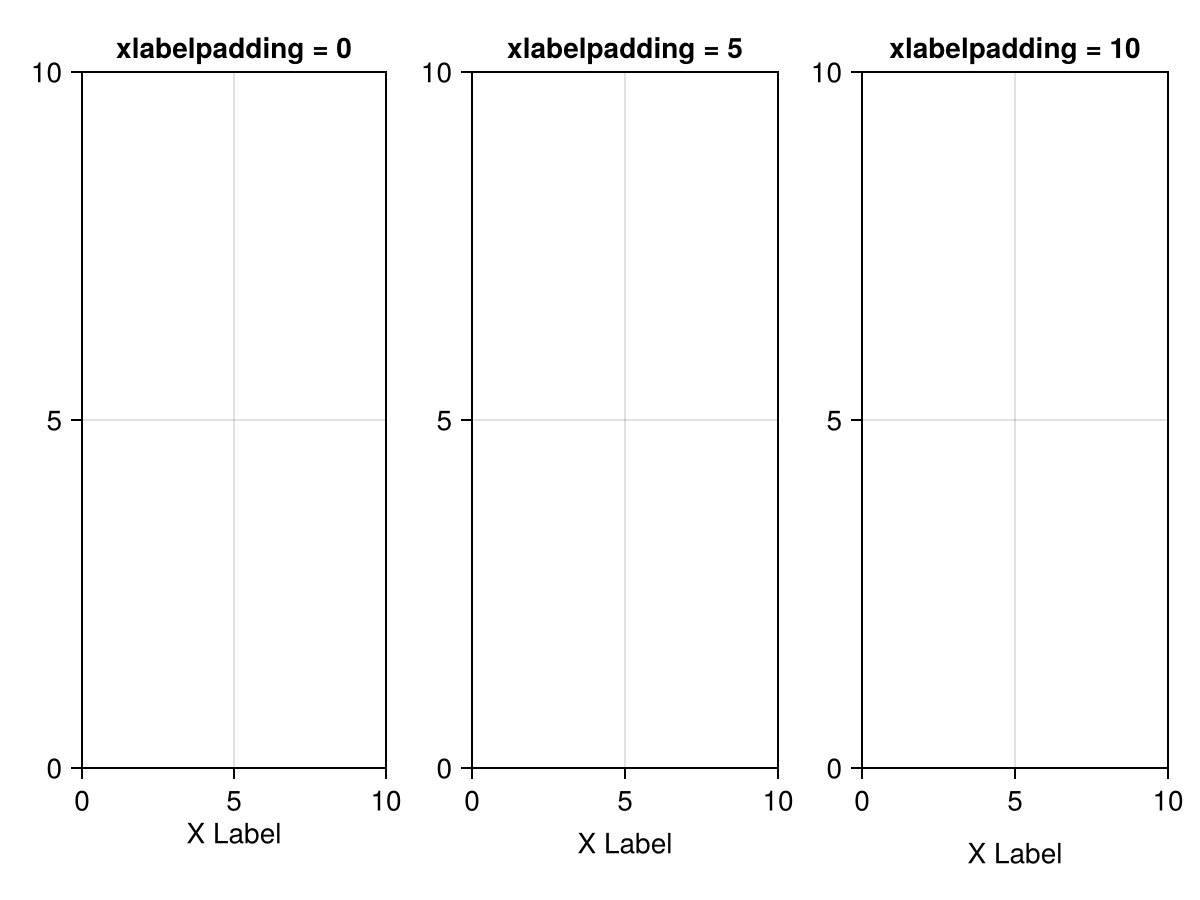
xlabelrotation
Defaults to Makie.automatic
The xlabel rotation in radians.
xlabelsize
Defaults to @inherit :fontsize 16.0f0
The font size of the xlabel.
xlabelvisible
Defaults to true
Controls if the xlabel is visible.
xminorgridcolor
Defaults to RGBAf(0, 0, 0, 0.05)
The color of the x minor grid lines.
xminorgridstyle
Defaults to nothing
The linestyle of the x minor grid lines.
xminorgridvisible
Defaults to false
Controls if the x minor grid lines are visible.
xminorgridwidth
Defaults to 1.0
The width of the x minor grid lines.
xminortickalign
Defaults to 0.0
The alignment of x minor ticks on the axis spine
xminortickcolor
Defaults to :black
The tick color of x minor ticks
xminorticks
Defaults to IntervalsBetween(2)
The tick locator for the minor ticks of the x axis.
Common objects that can be used are:
IntervalsBetween, divides the space between two adjacent major ticks intonintervals forn-1minor ticksA vector of numbers
using CairoMakie
f = Figure()

kwargs = (; xminorticksvisible = true, xminorgridvisible = true)
Axis(f[1, 1]; xminorticks = IntervalsBetween(2), kwargs...)
Axis(f[2, 1]; xminorticks = IntervalsBetween(5), kwargs...)
Axis(f[3, 1]; xminorticks = [1, 2, 3, 4], kwargs...)

f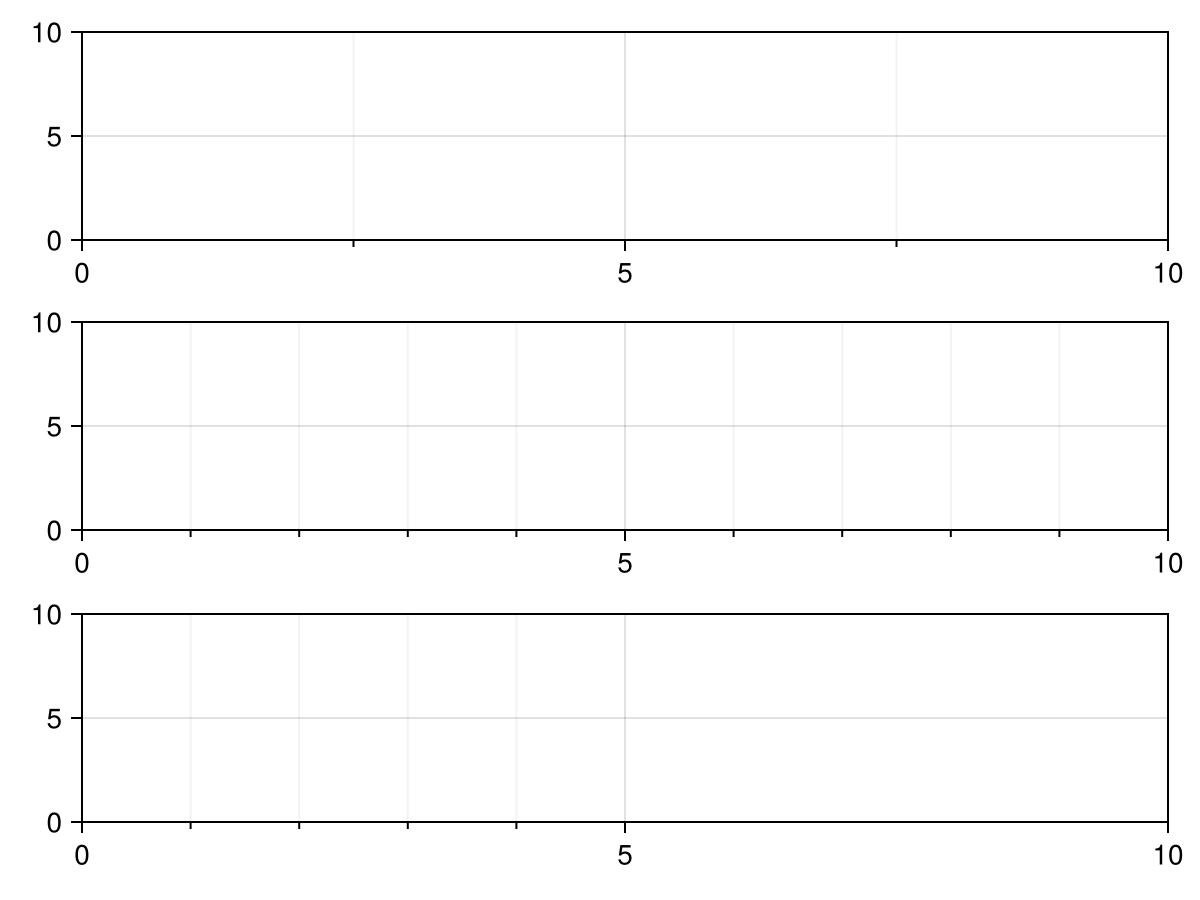
xminorticksize
Defaults to 3.0
The tick size of x minor ticks
xminorticksvisible
Defaults to false
Controls if minor ticks on the x axis are visible
xminortickwidth
Defaults to 1.0
The tick width of x minor ticks
xpankey
Defaults to Makie.Keyboard.x
The key for limiting panning to the x direction.
xpanlock
Defaults to false
Locks interactive panning in the x direction.
xrectzoom
Defaults to true
Controls if rectangle zooming affects the x dimension.
xreversed
Defaults to false
Controls if the x axis goes rightwards (false) or leftwards (true)
xscale
Defaults to identity
The scaling function for the x axis.
Can be any invertible function, some predefined options are identity, log, log2, log10, sqrt, logit, Makie.pseudolog10, Makie.Symlog10, Makie.AsinhScale, Makie.SinhScale, Makie.LogScale, Makie.LuptonAsinhScale, and Makie.PowerScale. To use a custom function, you have to define appropriate methods for Makie.inverse_transform, Makie.defaultlimits and Makie.defined_interval.
If the scaling function is only defined over a limited interval, no plot object may have a source datum that lies outside of that range. For example, there may be no x value lower than or equal to 0 when log is selected for xscale. What matters are the source data, not the user-selected limits, because all data have to be transformed, irrespective of whether they lie inside or outside of the current limits.
The axis scale may affect tick finding and formatting, depending on the values of xticks and xtickformat.
using CairoMakie
f = Figure()

for (i, scale) in enumerate([identity, log10, log2, log, sqrt, Makie.logit])
    row, col = fldmod1(i, 2)
    Axis(f[row, col], xscale = scale, title = string(scale),
        xminorticksvisible = true, xminorgridvisible = true,
        xminorticks = IntervalsBetween(5))

    lines!(range(0.01, 0.99, length = 200), 1:200)
end

f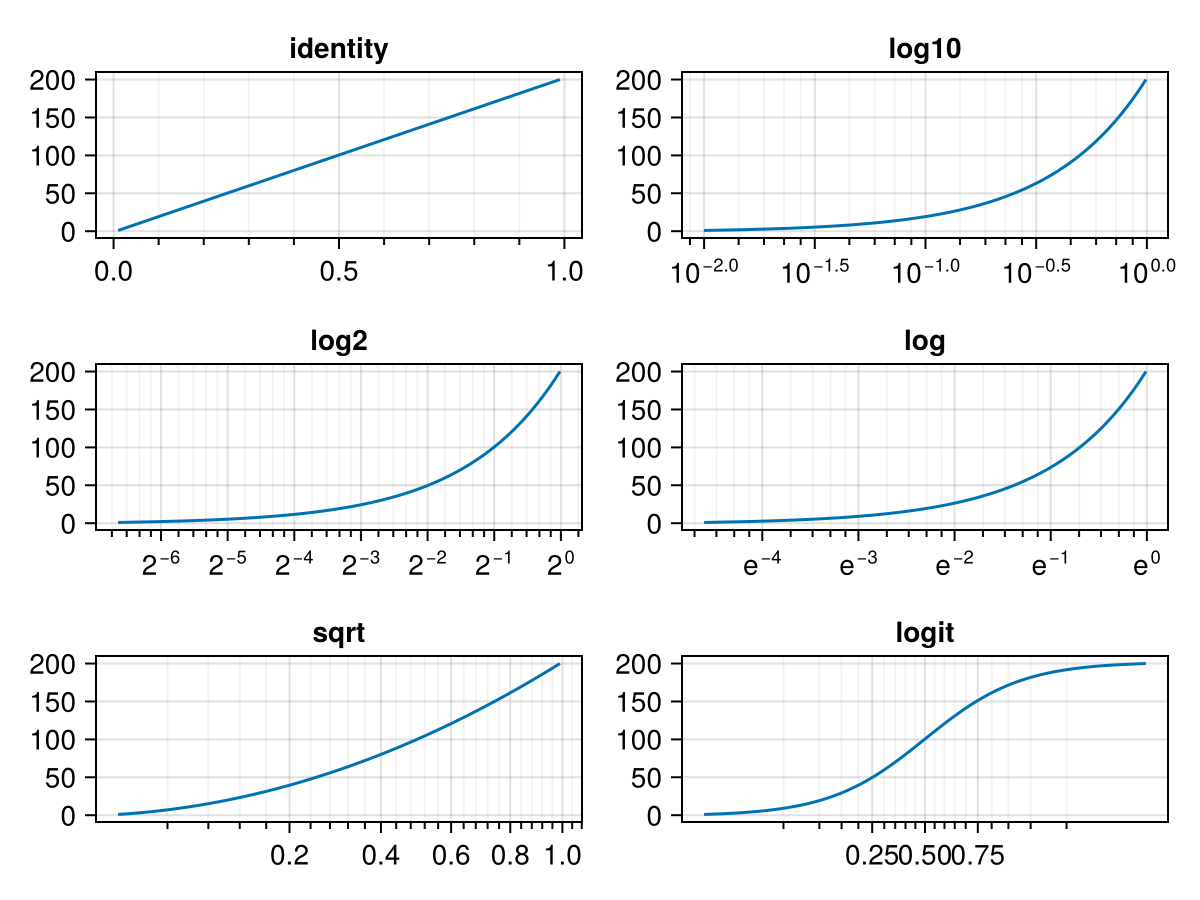
using CairoMakie
f = Figure()

ax1 = Axis(f[1, 1],
    xscale = Makie.pseudolog10,
    title = "Pseudolog scale",
    xticks = [-100, -10, -1, 0, 1, 10, 100]
)

ax2 = Axis(f[1, 2],
    xscale = Makie.Symlog10(10.0),
    title = "Symlog10 with linear scaling
between -10 and 10",
    xticks = [-100, -10, 0, 10, 100]
)

for ax in [ax1, ax2]
    lines!(ax, -100:0.1:100, -100:0.1:100)
end

f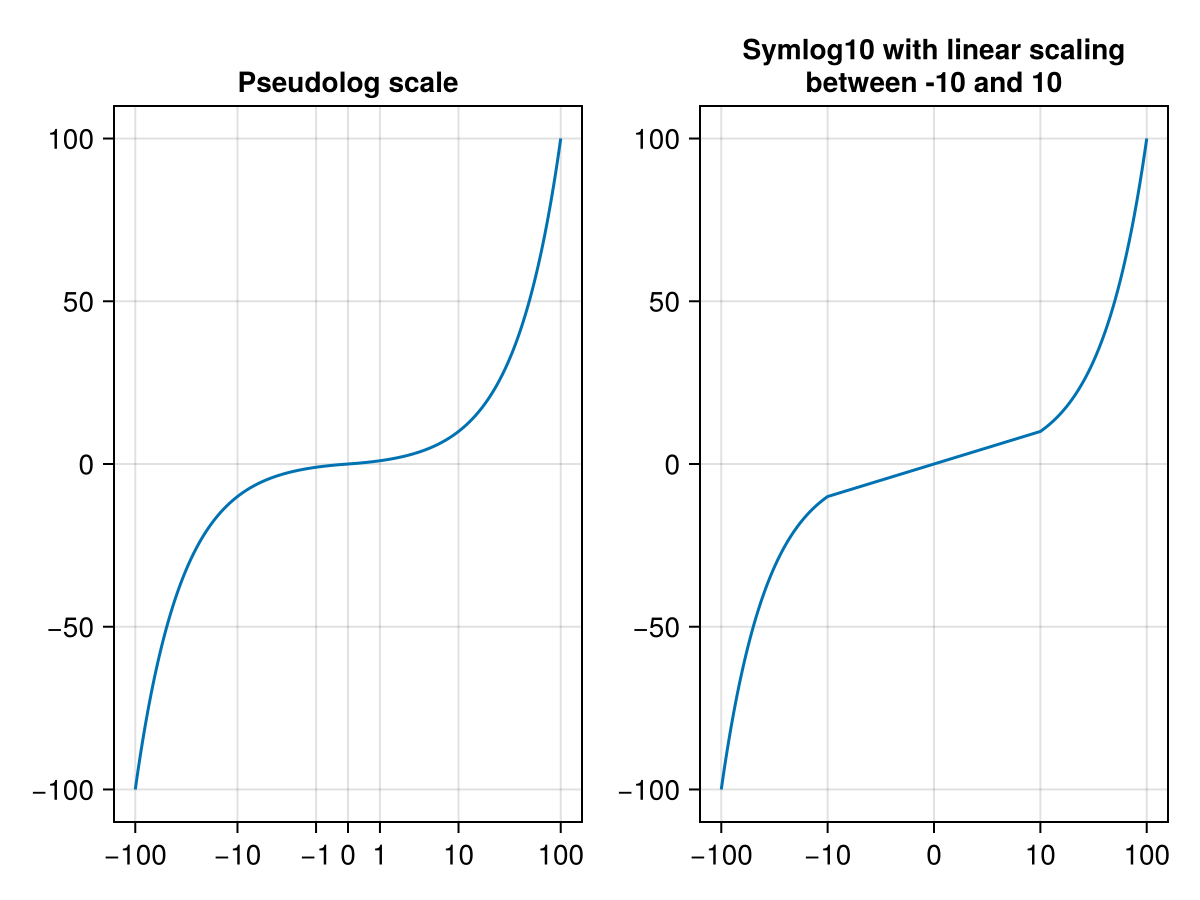
xtickalign
Defaults to 0.0
The alignment of the xtick marks relative to the axis spine (0 = out, 1 = in).
xtickcolor
Defaults to RGBf(0, 0, 0)
The color of the xtick marks.
xtickformat
Defaults to Makie.automatic
The formatter for the ticks on the x axis.
Usually, the tick values are determined first using Makie.get_tickvalues, after which Makie.get_ticklabels(xtickformat, xtickvalues) is called. If there is a special method defined, tick values and labels can be determined together using Makie.get_ticks instead. Check the docstring for xticks for more information.
The following is a list of common tick formatter objects.
Numeric:
A
Functionthat takes a vector of numbers and returns a vector of labels. A label can be anything that can be plotted by thetextprimitive.A
Stringwhich is used as a format specifier forFormat.jl. For example,"{:.2f}kg"formats numbers rounded to 2 decimal digits and with the suffixkg.
DateTime:
A
Functionthat takes a vector of datetimes and returns a vector of labels. A label can be anything that can be plotted by thetextprimitive.A
Stringwhich is used to construct aDates.DateFormatobject for use withDates.format. For example,"dd.mm.yyyy".A
Dates.DateFormatobject which is used withDates.formatlike theStringoption.
using CairoMakie
f = Figure(figure_padding = 50)

Axis(f[1, 1], xtickformat = values -> ["$(value)kg" for value in values])
Axis(f[2, 1], xtickformat = "{:.2f}ms")
Axis(f[3, 1], xtickformat = values -> [L"\sqrt{%$(value^2)}" for value in values])
Axis(f[4, 1], xtickformat = values -> [rich("$value", superscript("XY", color = :red))
                                       for value in values])

f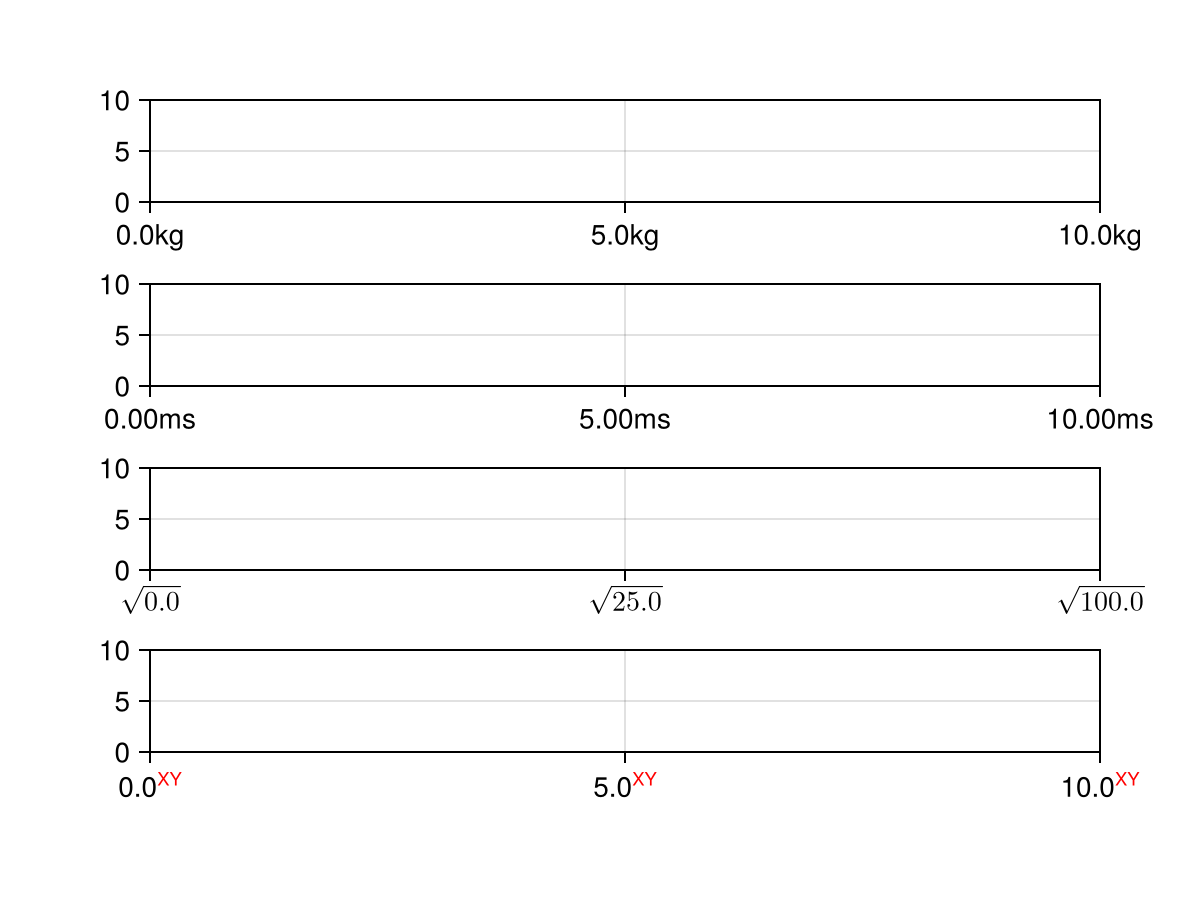
xticklabelalign
Defaults to Makie.automatic
The horizontal and vertical alignment of the xticklabels.
xticklabelcolor
Defaults to @inherit :textcolor :black
The color of xticklabels.
xticklabelfont
Defaults to :regular
The font family of the xticklabels.
xticklabelpad
Defaults to 2.0
The space between xticks and xticklabels.
using CairoMakie
    f = Figure()

    Axis(f[1, 1], xticklabelpad = 0, title = "xticklabelpad = 0")
    Axis(f[1, 2], xticklabelpad = 5, title = "xticklabelpad = 5")
    Axis(f[1, 3], xticklabelpad = 15, title = "xticklabelpad = 15")

    f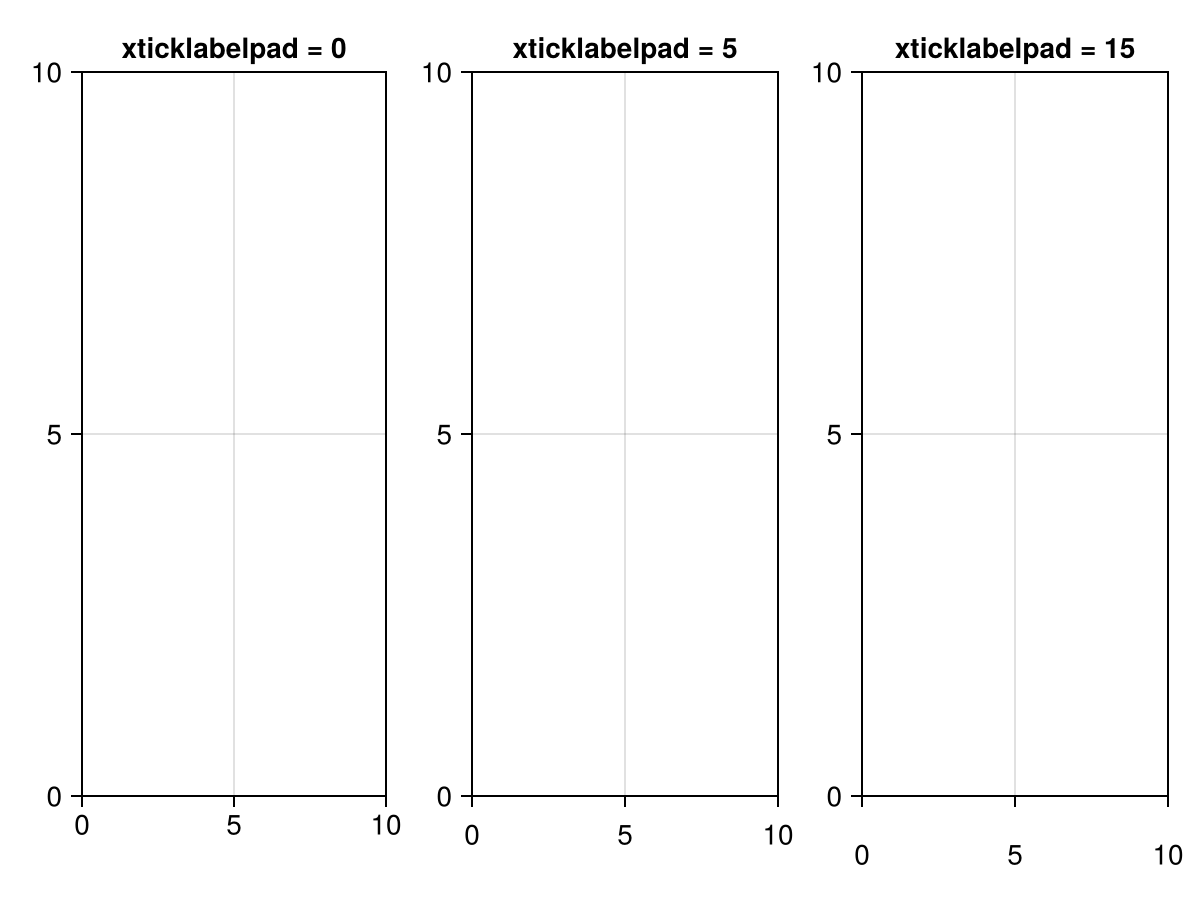
xticklabelrotation
Defaults to 0.0
The counterclockwise rotation of the xticklabels in radians.
xticklabelsize
Defaults to @inherit :fontsize 16.0f0
The font size of the xticklabels.
xticklabelspace
Defaults to Makie.automatic
The space reserved for the xticklabels. Can be set to Makie.automatic to automatically determine the space needed, :max_auto to only ever grow to fit the current ticklabels, or a specific value.
using CairoMakie
    f = Figure()

    Axis(f[1, 1], xlabel = "X Label", xticklabelspace = 0.0, title = "xticklabelspace = 0.0")
    Axis(f[1, 2], xlabel = "X Label", xticklabelspace = 30.0, title = "xticklabelspace = 30.0")
    Axis(f[1, 3], xlabel = "X Label", xticklabelspace = Makie.automatic, title = "xticklabelspace = automatic")

    f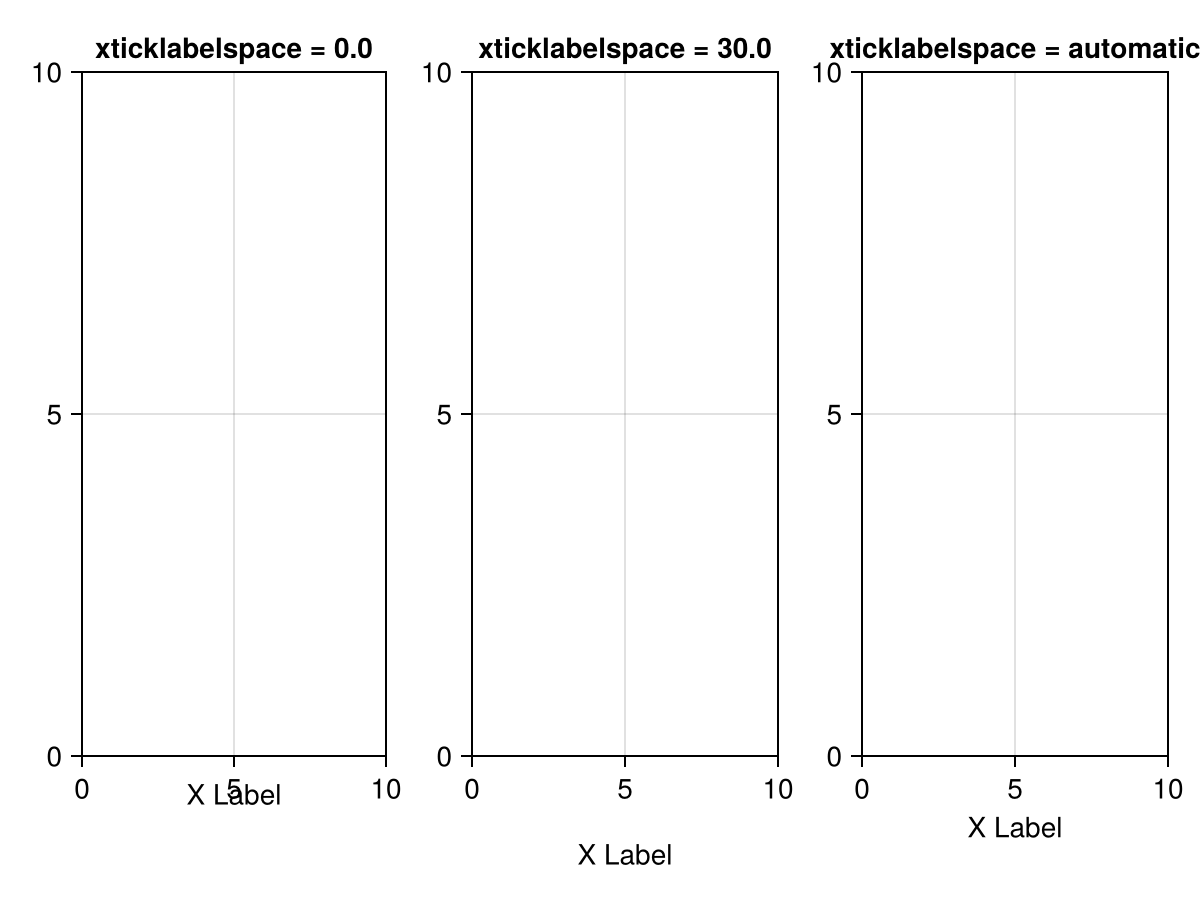
xticklabelsvisible
Defaults to true
Controls if the xticklabels are visible.
xticks
Defaults to Makie.automatic
Controls what numerical tick values are calculated for the x axis.
To determine tick values and labels, Makie first calls Makie.get_ticks(xticks, xscale, xtickformat, xmin, xmax). If there is no special method defined for the current combination of ticks, scale and formatter which returns both tick values and labels at once, then the numerical tick values will be determined using xtickvalues = Makie.get_tickvalues(xticks, xscale, xmin, xmax) after which the labels are determined using Makie.get_ticklabels(xtickformat, xtickvalues).
The following is a list of common tick objects.
Numeric:
A vector of numbers
A tuple with two vectors
(numbers, labels)wherelabelscan be any objects thattextcan handle.WilkinsonTicks, the default tick finder for linear ticksLinearTicks, an alternative tick finder for linear ticksLogTicks, a wrapper that applies any other wrapped tick finder on log-transformed valuesMultiplesTicks, for finding ticks at multiples of a given value, such asπAngularTicks, for finding tick steps that are fitting for angles with base 12 numbering (90° instead of 100)
DateTime:
A vector of
DateTimesA tuple with two vectors
(datetimes, labels)DateTimeTicks, the default tick finder for datetime ticks
using CairoMakie
fig = Figure()
Axis(fig[1, 1], xticks = 1:10)
Axis(fig[2, 1], xticks = (1:2:9, ["A", "B", "C", "D", "E"]))
Axis(fig[3, 1], xticks = WilkinsonTicks(5))
fig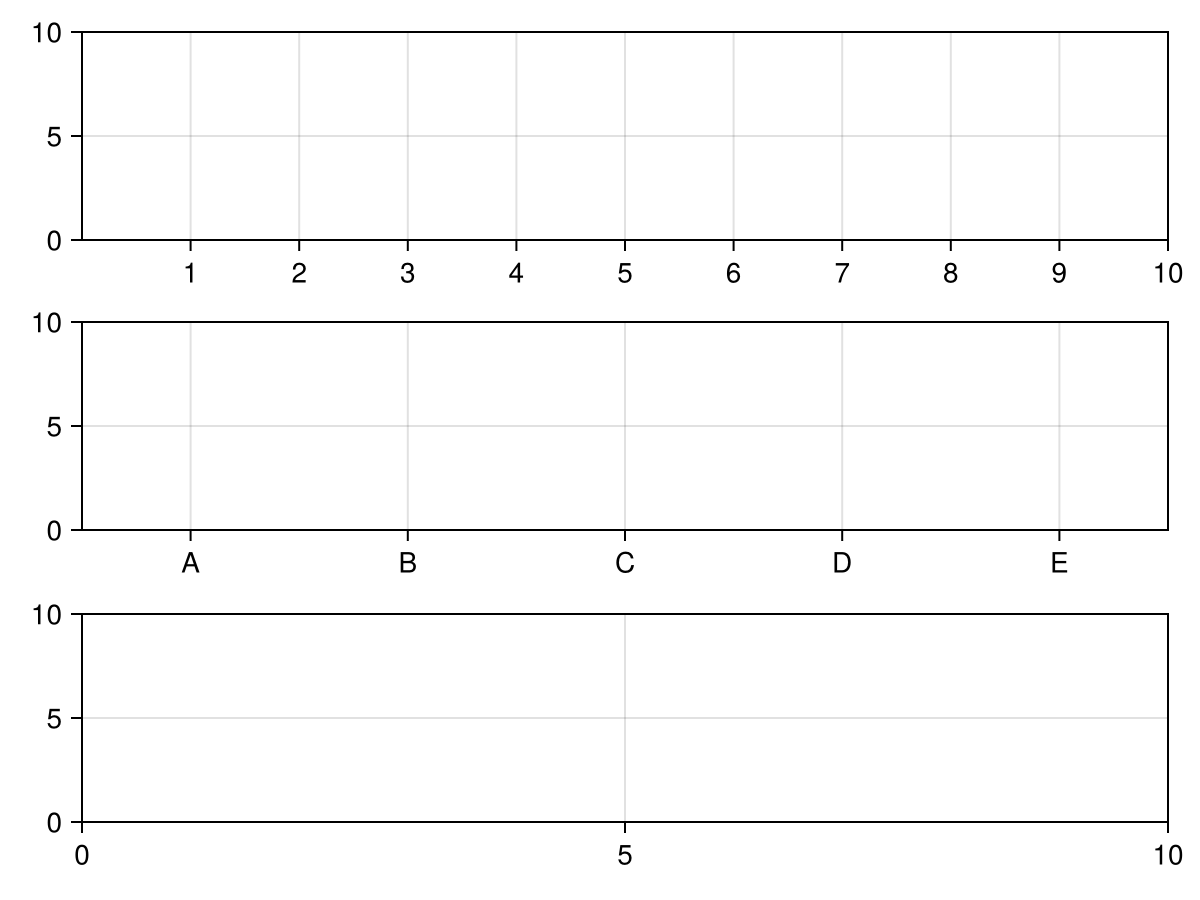
xticksize
Defaults to 5.0
The size of the xtick marks.
xticksmirrored
Defaults to false
Controls if the x ticks and minor ticks are mirrored on the other side of the Axis.
using CairoMakie
f = Figure()

Axis(f[1, 1], xticksmirrored = false, xminorticksvisible = true)
Axis(f[1, 2], xticksmirrored = true, xminorticksvisible = true)

f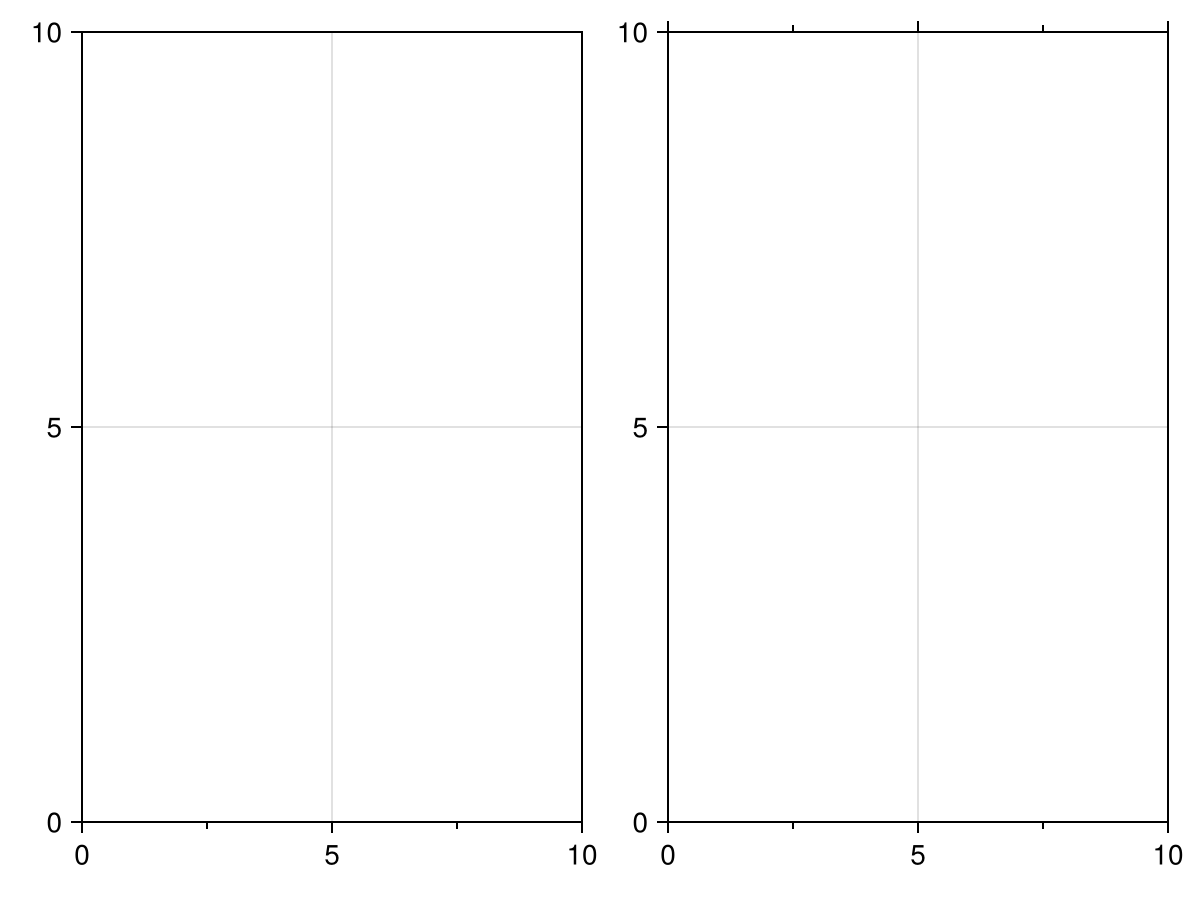
xticksvisible
Defaults to true
Controls if the xtick marks are visible.
xtickwidth
Defaults to 1.0
The width of the xtick marks.
xtrimspine
Defaults to false
If true, limits the x axis spine's extent to the outermost major tick marks. Can also be set to a Tuple{Bool,Bool} to control each side separately.
using CairoMakie
f = Figure()

ax1 = Axis(f[1, 1], xtrimspine = false)
ax2 = Axis(f[2, 1], xtrimspine = true)
ax3 = Axis(f[3, 1], xtrimspine = (true, false))
ax4 = Axis(f[4, 1], xtrimspine = (false, true))

for ax in [ax1, ax2, ax3, ax4]
    ax.xgridvisible = false
    ax.ygridvisible = false
    ax.rightspinevisible = false
    ax.topspinevisible = false
    xlims!(ax, 0.5, 5.5)
end

f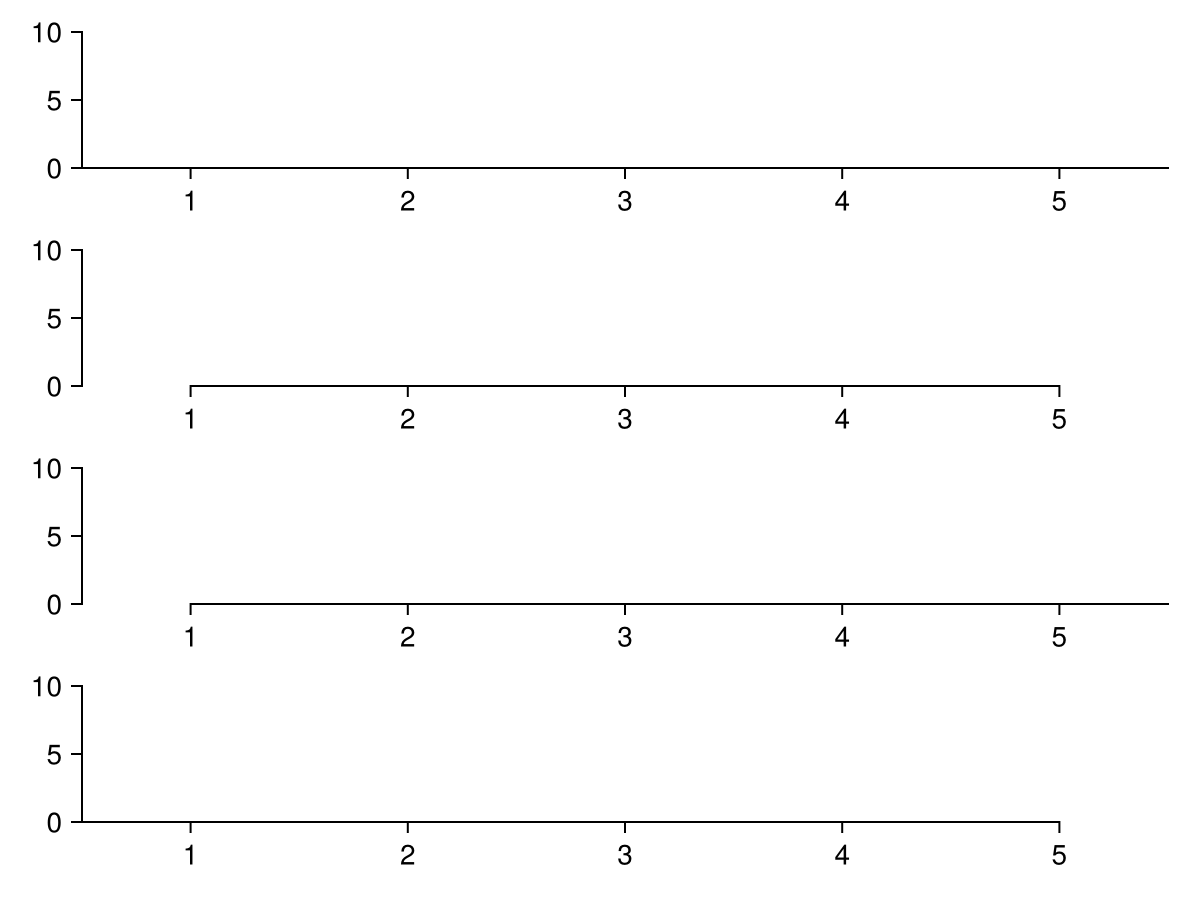
xzoomkey
Defaults to Makie.Keyboard.x
The key for limiting zooming to the x direction.
xzoomlock
Defaults to false
Locks interactive zooming in the x direction.
yautolimitmargin
Defaults to (0.05f0, 0.05f0)
The relative margins added to the autolimits in y direction.
using CairoMakie
    f = Figure()

    data = 0:1

    ax1 = Axis(f[1, 1], yautolimitmargin = (0, 0), title = "yautolimitmargin = (0, 0)")
    ax2 = Axis(f[1, 2], yautolimitmargin = (0.05, 0.05), title = "yautolimitmargin = (0.05, 0.05)")
    ax3 = Axis(f[1, 3], yautolimitmargin = (0, 0.2), title = "yautolimitmargin = (0, 0.2)")

    for ax in [ax1, ax2, ax3]
        lines!(ax, data)
    end

    f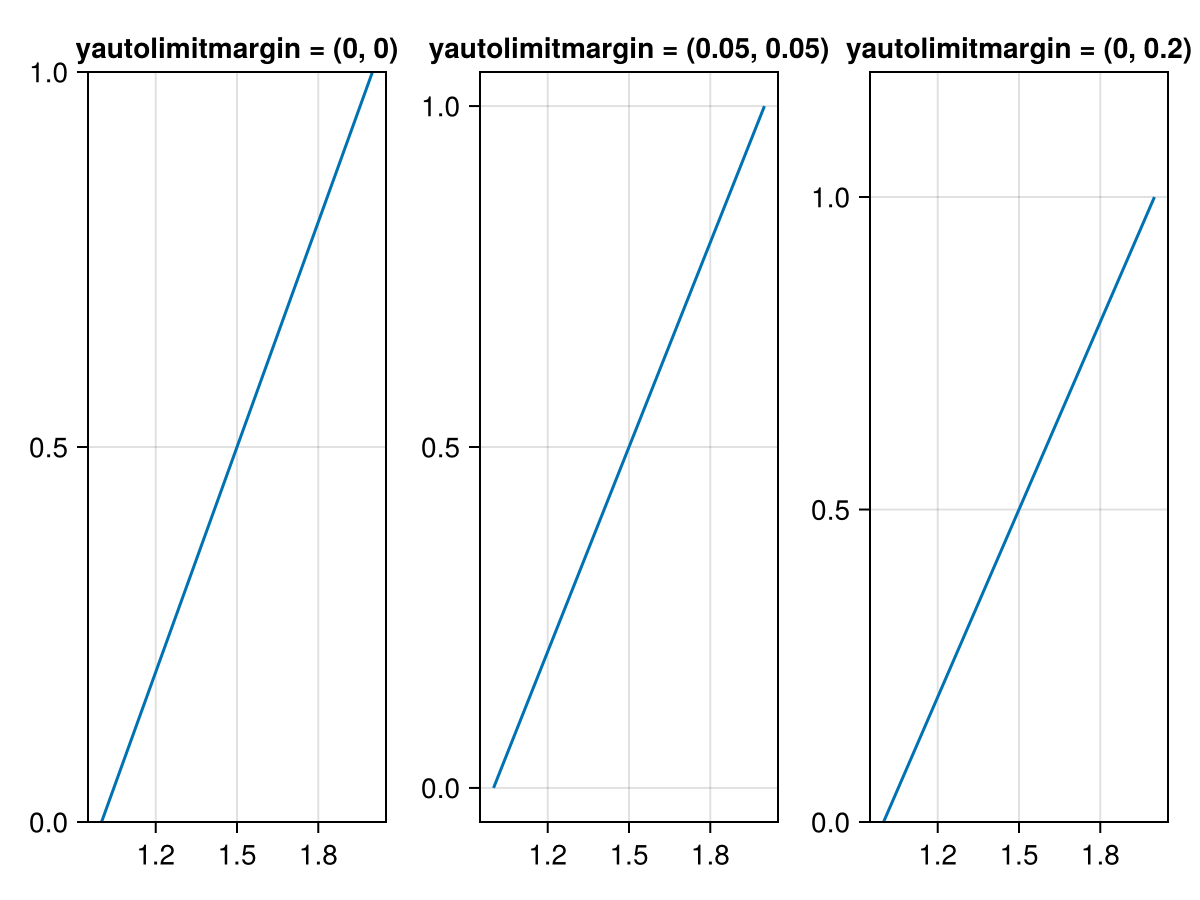
yaxisposition
Defaults to :left
The position of the y axis (:left or :right).
using CairoMakie
f = Figure()

Axis(f[1, 1], yaxisposition = :left)
Axis(f[2, 1], yaxisposition = :right)

f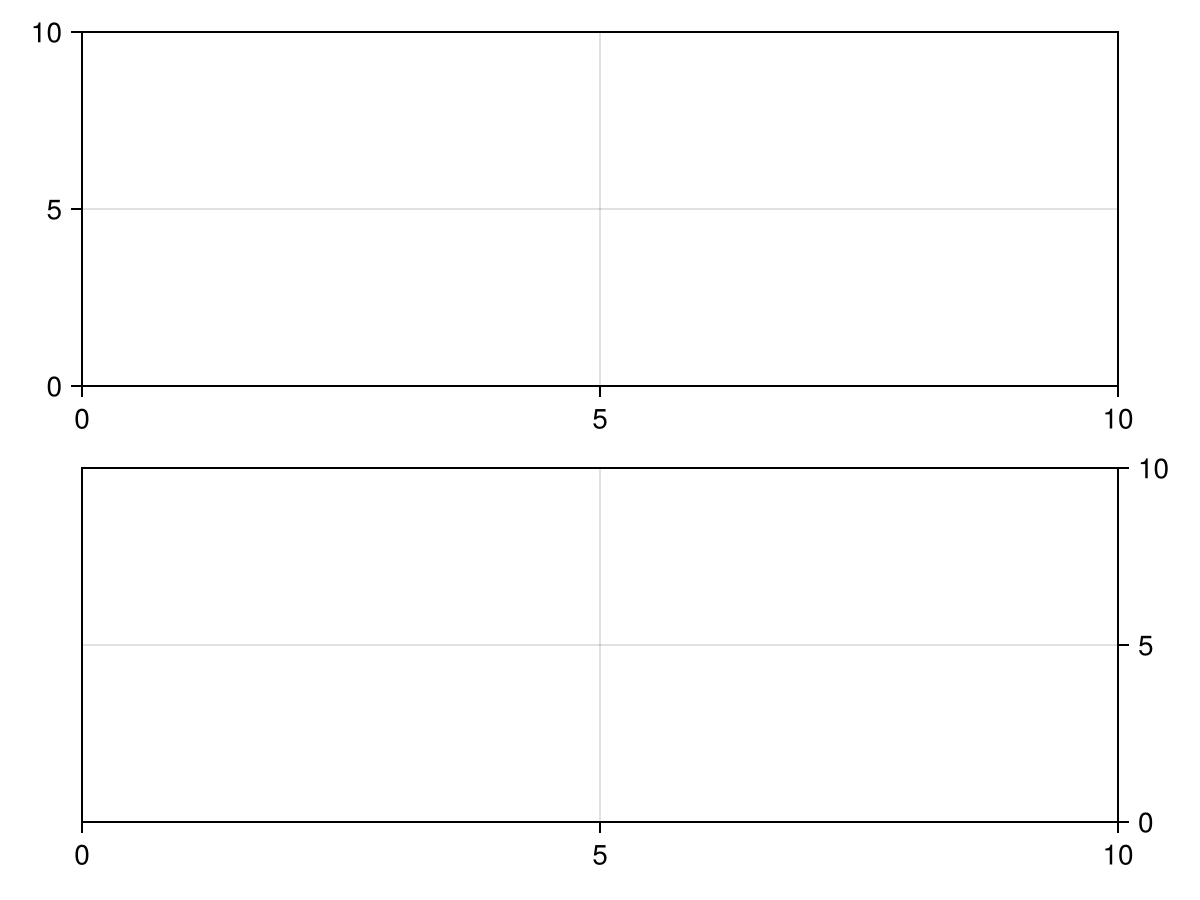
ygridcolor
Defaults to RGBAf(0, 0, 0, 0.12)
The color of the y grid lines.
ygridstyle
Defaults to nothing
The linestyle of the y grid lines.
ygridvisible
Defaults to true
Controls if the y grid lines are visible.
ygridwidth
Defaults to 1.0
The width of the y grid lines.
ylabel
Defaults to ""
The content of the y axis label. The value can be any non-vector-valued object that the text primitive supports.
using CairoMakie
f = Figure()

Axis(f[1, 1], ylabel = "Y Label")
Axis(f[2, 1], ylabel = L"\sum_i{x_i \times y_i}")
Axis(f[3, 1], ylabel = rich(
    "Y Label",
    subscript(" with subscript", color = :slategray)
))

f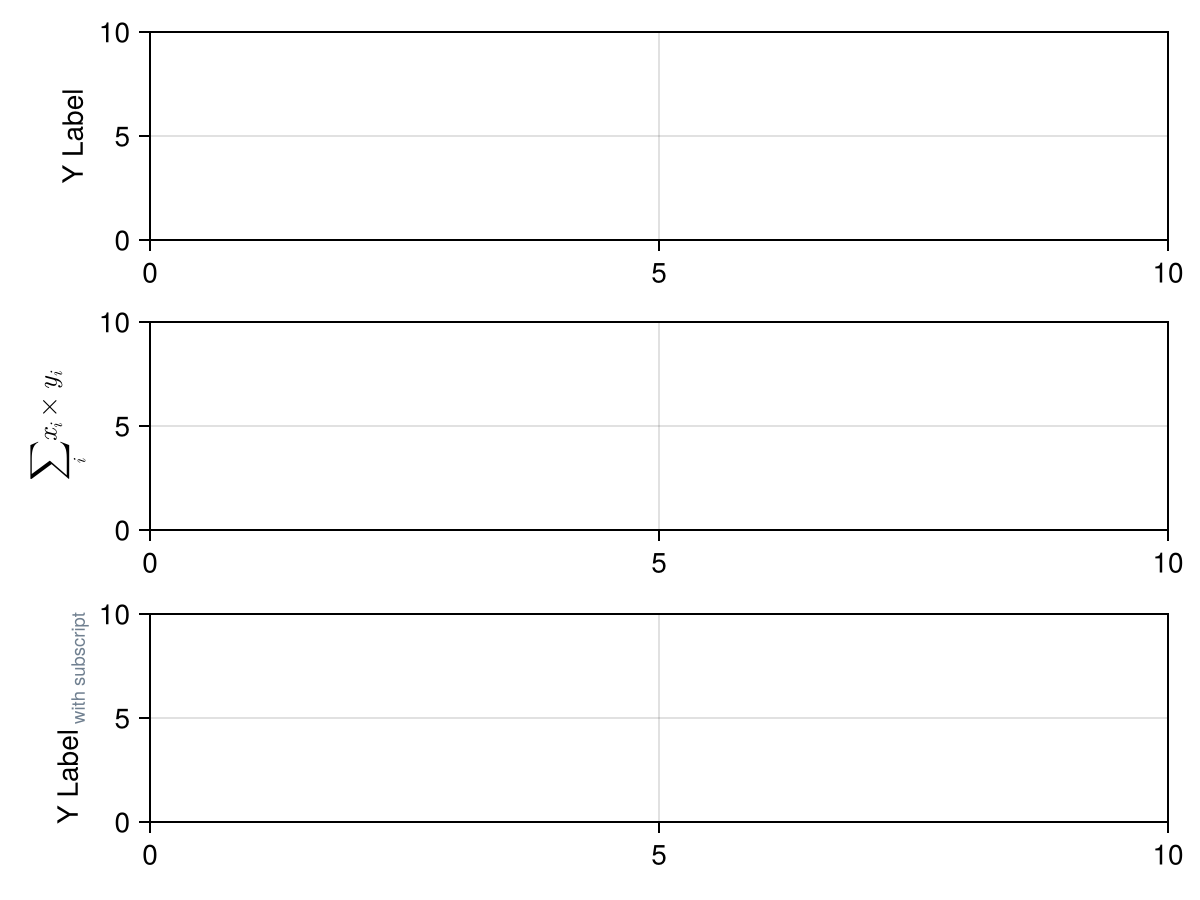
ylabelcolor
Defaults to @inherit :textcolor :black
The color of the ylabel.
ylabelfont
Defaults to :regular
The font family of the ylabel.
ylabelpadding
Defaults to 5.0
The additional padding between the ylabel and the ticks or axis.
using CairoMakie
    f = Figure()

    Axis(f[1, 1], ylabel = "Y Label", ylabelpadding = 0, title = "ylabelpadding = 0")
    Axis(f[2, 1], ylabel = "Y Label", ylabelpadding = 5, title = "ylabelpadding = 5")
    Axis(f[3, 1], ylabel = "Y Label", ylabelpadding = 10, title = "ylabelpadding = 10")

    f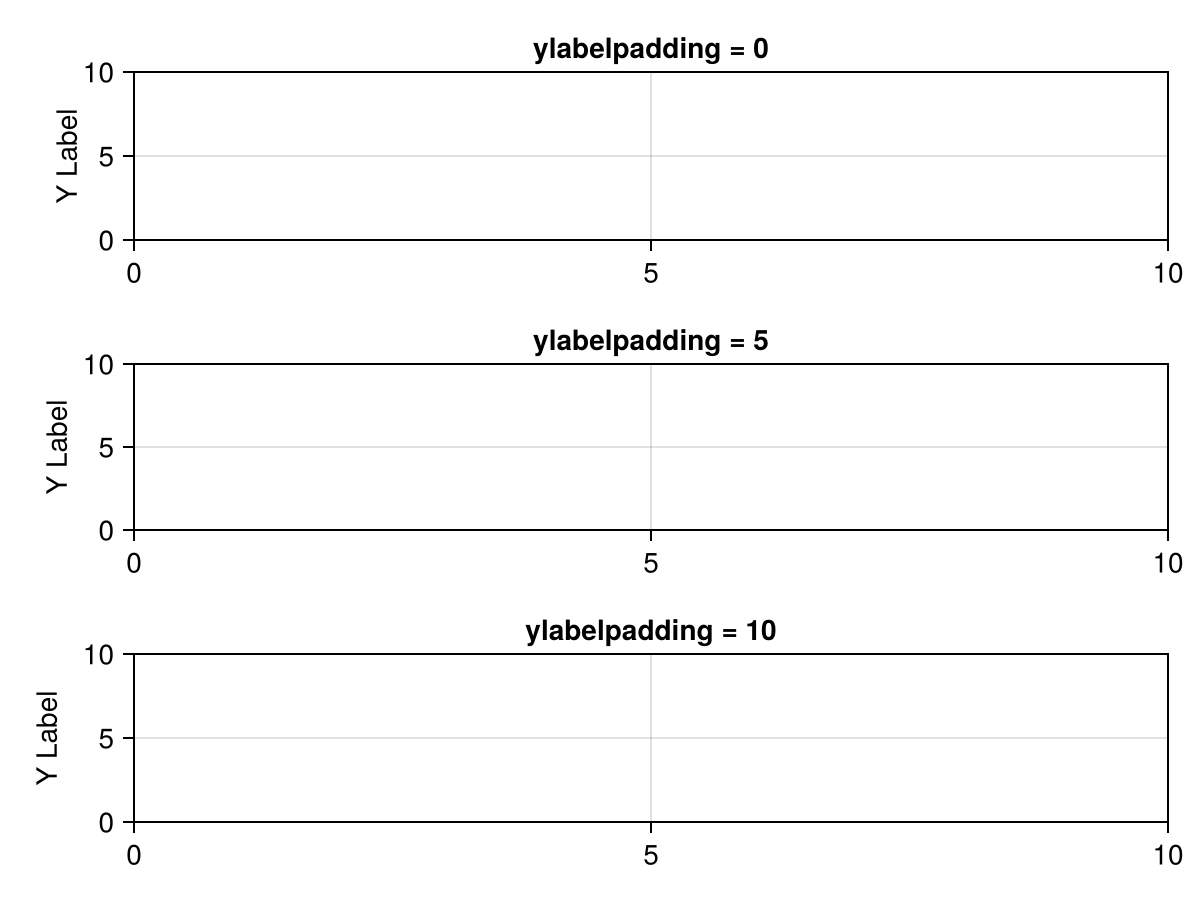
ylabelrotation
Defaults to Makie.automatic
The ylabel rotation in radians.
ylabelsize
Defaults to @inherit :fontsize 16.0f0
The font size of the ylabel.
ylabelvisible
Defaults to true
Controls if the ylabel is visible.
yminorgridcolor
Defaults to RGBAf(0, 0, 0, 0.05)
The color of the y minor grid lines.
yminorgridstyle
Defaults to nothing
The linestyle of the y minor grid lines.
yminorgridvisible
Defaults to false
Controls if the y minor grid lines are visible.
yminorgridwidth
Defaults to 1.0
The width of the y minor grid lines.
yminortickalign
Defaults to 0.0
The alignment of y minor ticks on the axis spine
yminortickcolor
Defaults to :black
The tick color of y minor ticks
yminorticks
Defaults to IntervalsBetween(2)
The tick locator for the minor ticks of the y axis.
Common objects that can be used are:
IntervalsBetween, divides the space between two adjacent major ticks intonintervals forn-1minor ticksA vector of numbers
using CairoMakie
f = Figure()

kwargs = (; yminorticksvisible = true, yminorgridvisible = true)
Axis(f[1, 1]; yminorticks = IntervalsBetween(2), kwargs...)
Axis(f[1, 2]; yminorticks = IntervalsBetween(5), kwargs...)
Axis(f[1, 3]; yminorticks = [1, 2, 3, 4], kwargs...)

f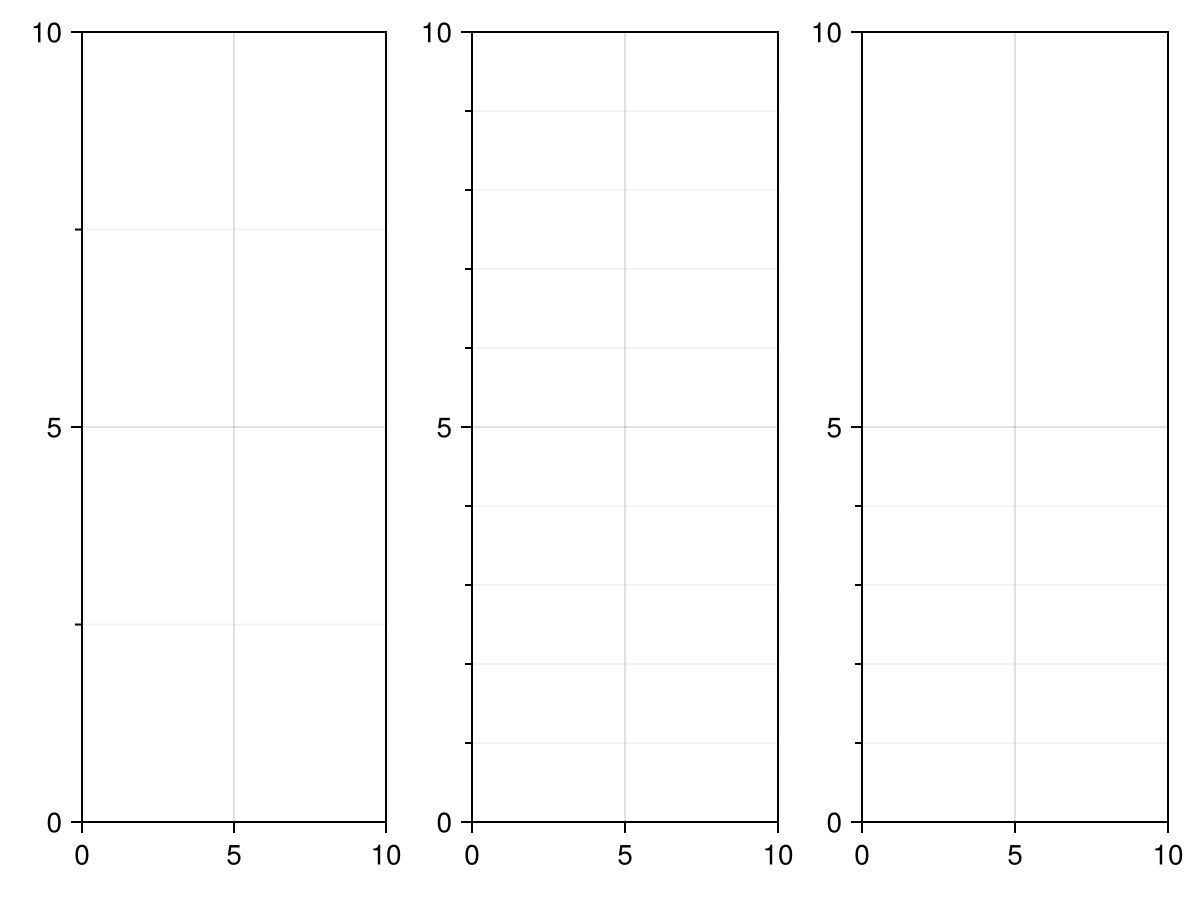
yminorticksize
Defaults to 3.0
The tick size of y minor ticks
yminorticksvisible
Defaults to false
Controls if minor ticks on the y axis are visible
yminortickwidth
Defaults to 1.0
The tick width of y minor ticks
ypankey
Defaults to Makie.Keyboard.y
The key for limiting panning to the y direction.
ypanlock
Defaults to false
Locks interactive panning in the y direction.
yrectzoom
Defaults to true
Controls if rectangle zooming affects the y dimension.
yreversed
Defaults to false
Controls if the y axis goes upwards (false) or downwards (true)
yscale
Defaults to identity
The scaling function for the y axis.
Can be any invertible function, some predefined options are identity, log, log2, log10, sqrt, logit, Makie.pseudolog10, Makie.Symlog10, Makie.AsinhScale, Makie.SinhScale, Makie.LogScale, Makie.LuptonAsinhScale, and Makie.PowerScale. To use a custom function, you have to define appropriate methods for Makie.inverse_transform, Makie.defaultlimits and Makie.defined_interval.
If the scaling function is only defined over a limited interval, no plot object may have a source datum that lies outside of that range. For example, there may be no y value lower than or equal to 0 when log is selected for yscale. What matters are the source data, not the user-selected limits, because all data have to be transformed, irrespective of whether they lie inside or outside of the current limits.
The axis scale may affect tick finding and formatting, depending on the values of yticks and ytickformat.
using CairoMakie
f = Figure()

for (i, scale) in enumerate([identity, log10, log2, log, sqrt, Makie.logit])
    row, col = fldmod1(i, 3)
    Axis(f[row, col], yscale = scale, title = string(scale),
        yminorticksvisible = true, yminorgridvisible = true,
        yminorticks = IntervalsBetween(5))

    lines!(range(0.01, 0.99, length = 200))
end

f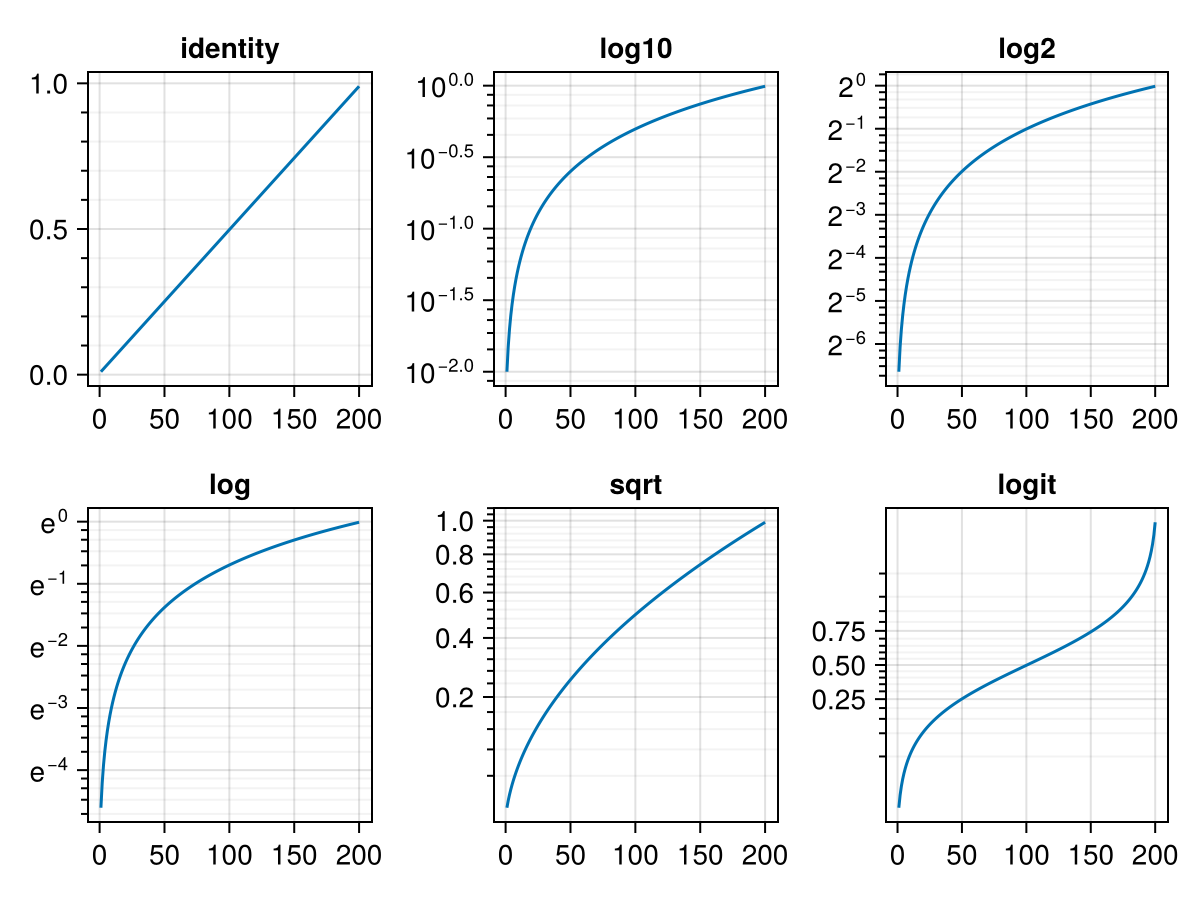
using CairoMakie
f = Figure()

ax1 = Axis(f[1, 1],
    yscale = Makie.pseudolog10,
    title = "Pseudolog scale",
    yticks = [-100, -10, -1, 0, 1, 10, 100]
)

ax2 = Axis(f[2, 1],
    yscale = Makie.Symlog10(10.0),
    title = "Symlog10 with linear scaling between -10 and 10",
    yticks = [-100, -10, 0, 10, 100]
)

ax3 = Axis(f[3, 1],
    yscale = Makie.pseudolog10,
    title = "Pseudolog scale with automatic decade ticks"
)

for ax in [ax1, ax2, ax3]
    lines!(ax, -100:0.1:100)
end

f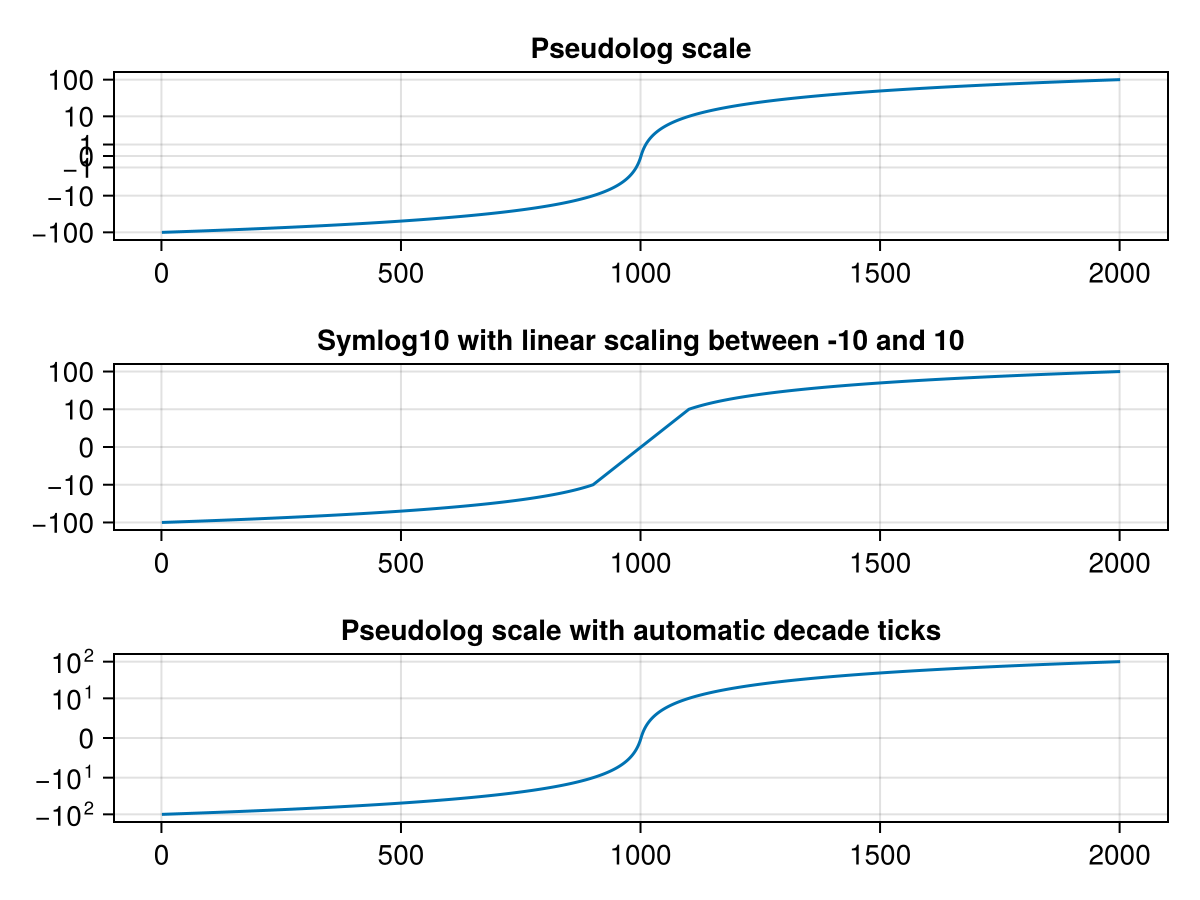
ytickalign
Defaults to 0.0
The alignment of the ytick marks relative to the axis spine (0 = out, 1 = in).
ytickcolor
Defaults to RGBf(0, 0, 0)
The color of the ytick marks.
ytickformat
Defaults to Makie.automatic
The formatter for the ticks on the y axis.
Usually, the tick values are determined first using Makie.get_tickvalues, after which Makie.get_ticklabels(ytickformat, ytickvalues) is called. If there is a special method defined, tick values and labels can be determined together using Makie.get_ticks instead. Check the docstring for yticks for more information.
The following is a list of common tick formatter objects.
Numeric:
A
Functionthat takes a vector of numbers and returns a vector of labels. A label can be anything that can be plotted by thetextprimitive.A
Stringwhich is used as a format specifier forFormat.jl. For example,"{:.2f}kg"formats numbers rounded to 2 decimal digits and with the suffixkg.
DateTime:
A
Functionthat takes a vector of datetimes and returns a vector of labels. A label can be anything that can be plotted by thetextprimitive.A
Stringwhich is used to construct aDates.DateFormatobject for use withDates.format. For example,"dd.mm.yyyy".A
Dates.DateFormatobject which is used withDates.formatlike theStringoption.
using CairoMakie
f = Figure()

Axis(f[1, 1], ytickformat = values -> ["$(value)kg" for value in values])
Axis(f[1, 2], ytickformat = "{:.2f}ms")
Axis(f[1, 3], ytickformat = values -> [L"\sqrt{%$(value^2)}" for value in values])
Axis(f[1, 4], ytickformat = values -> [rich("$value", superscript("XY", color = :red))
                                       for value in values])

f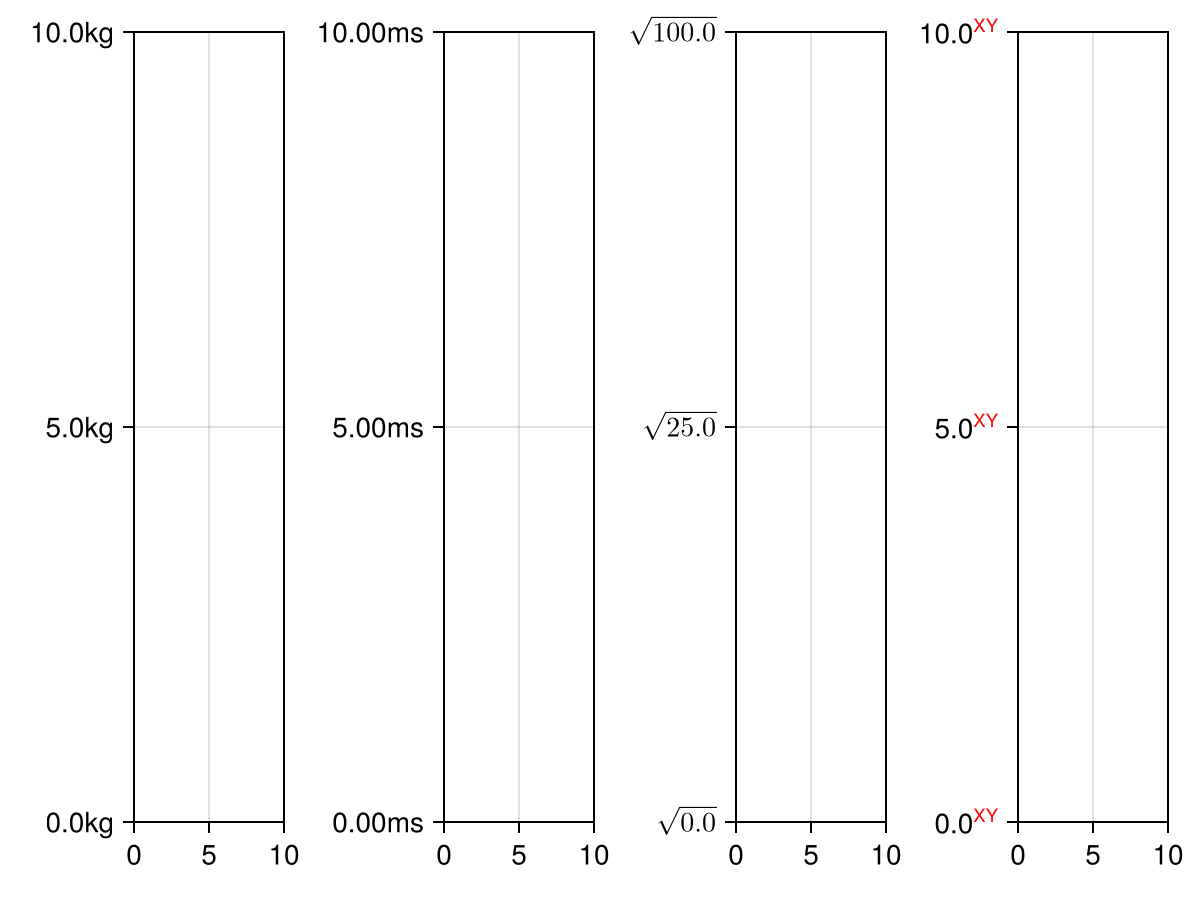
yticklabelalign
Defaults to Makie.automatic
The horizontal and vertical alignment of the yticklabels.
yticklabelcolor
Defaults to @inherit :textcolor :black
The color of yticklabels.
yticklabelfont
Defaults to :regular
The font family of the yticklabels.
yticklabelpad
Defaults to 4.0
The space between yticks and yticklabels.
using CairoMakie
    f = Figure()

    Axis(f[1, 1], yticklabelpad = 0, title = "yticklabelpad = 0")
    Axis(f[2, 1], yticklabelpad = 5, title = "yticklabelpad = 5")
    Axis(f[3, 1], yticklabelpad = 15, title = "yticklabelpad = 15")

    f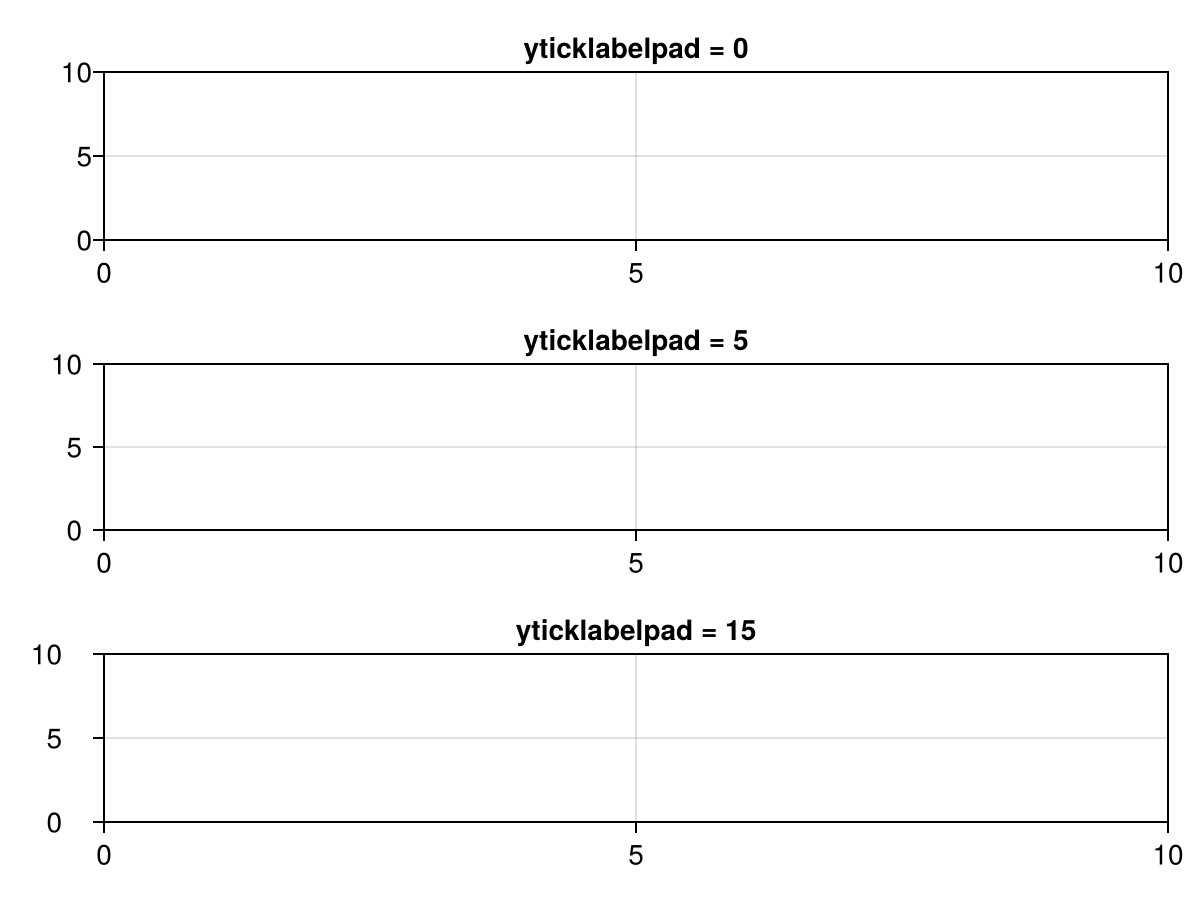
yticklabelrotation
Defaults to 0.0
The counterclockwise rotation of the yticklabels in radians.
yticklabelsize
Defaults to @inherit :fontsize 16.0f0
The font size of the yticklabels.
yticklabelspace
Defaults to Makie.automatic
The space reserved for the yticklabels. Can be set to Makie.automatic to automatically determine the space needed, :max_auto to only ever grow to fit the current ticklabels, or a specific value.
using CairoMakie
    f = Figure()

    Axis(f[1, 1], ylabel = "Y Label", yticklabelspace = 0.0, title = "yticklabelspace = 0.0")
    Axis(f[2, 1], ylabel = "Y Label", yticklabelspace = 30.0, title = "yticklabelspace = 30.0")
    Axis(f[3, 1], ylabel = "Y Label", yticklabelspace = Makie.automatic, title = "yticklabelspace = automatic")

    f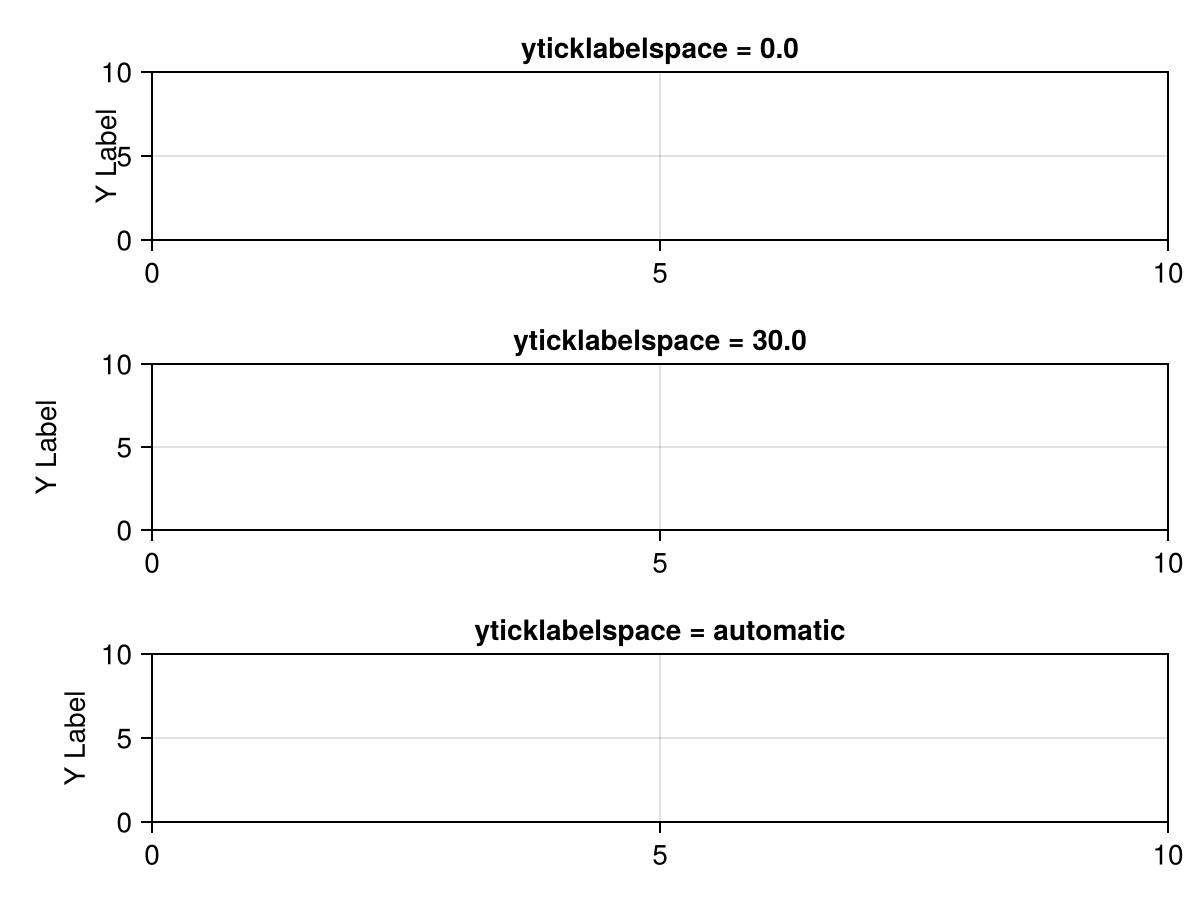
yticklabelsvisible
Defaults to true
Controls if the yticklabels are visible.
yticks
Defaults to Makie.automatic
Controls what numerical tick values are calculated for the y axis.
To determine tick values and labels, Makie first calls Makie.get_ticks(yticks, yscale, ytickformat, ymin, ymax). If there is no special method defined for the current combination of ticks, scale and formatter which returns both tick values and labels at once, then the numerical tick values will be determined using ytickvalues = Makie.get_tickvalues(yticks, yscale, ymin, ymax) after which the labels are determined using Makie.get_ticklabels(ytickformat, ytickvalues).
The following is a list of common tick objects.
Numeric:
A vector of numbers
A tuple with two vectors
(numbers, labels)wherelabelscan be any objects thattextcan handle.WilkinsonTicks, the default tick finder for linear ticksLinearTicks, an alternative tick finder for linear ticksLogTicks, a wrapper that applies any other wrapped tick finder on log-transformed valuesMultiplesTicks, for finding ticks at multiples of a given value, such asπAngularTicks, for finding tick steps that are fitting for angles with base 12 numbering (90° instead of 100)
DateTime:
A vector of
DateTimesA tuple with two vectors
(datetimes, labels)DateTimeTicks, the default tick finder for datetime ticks
using CairoMakie
fig = Figure()
Axis(fig[1, 1], yticks = 1:10)
Axis(fig[1, 2], yticks = (1:2:9, ["A", "B", "C", "D", "E"]))
Axis(fig[1, 3], yticks = WilkinsonTicks(5))
fig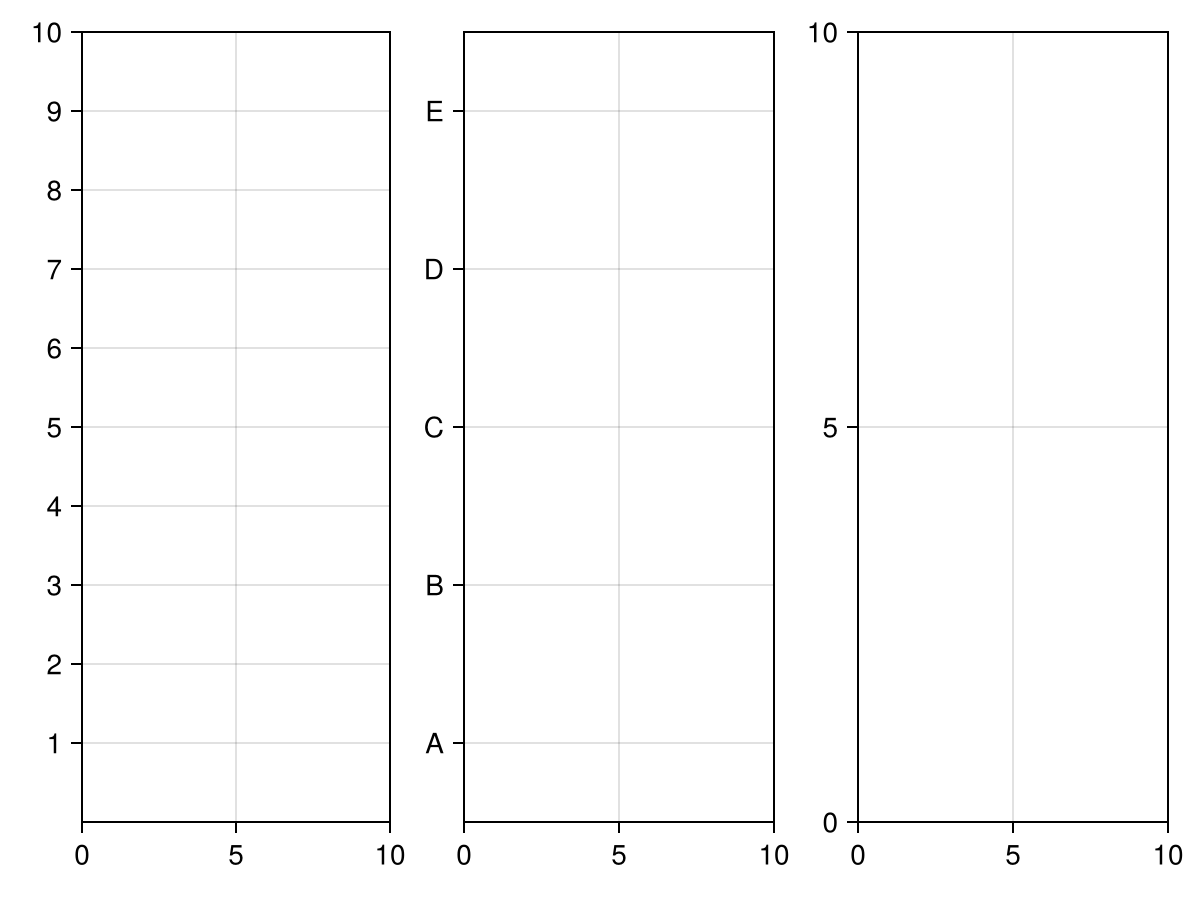
yticksize
Defaults to 5.0
The size of the ytick marks.
yticksmirrored
Defaults to false
Controls if the y ticks and minor ticks are mirrored on the other side of the Axis.
using CairoMakie
f = Figure()

Axis(f[1, 1], yticksmirrored = false, yminorticksvisible = true)
Axis(f[2, 1], yticksmirrored = true, yminorticksvisible = true)

f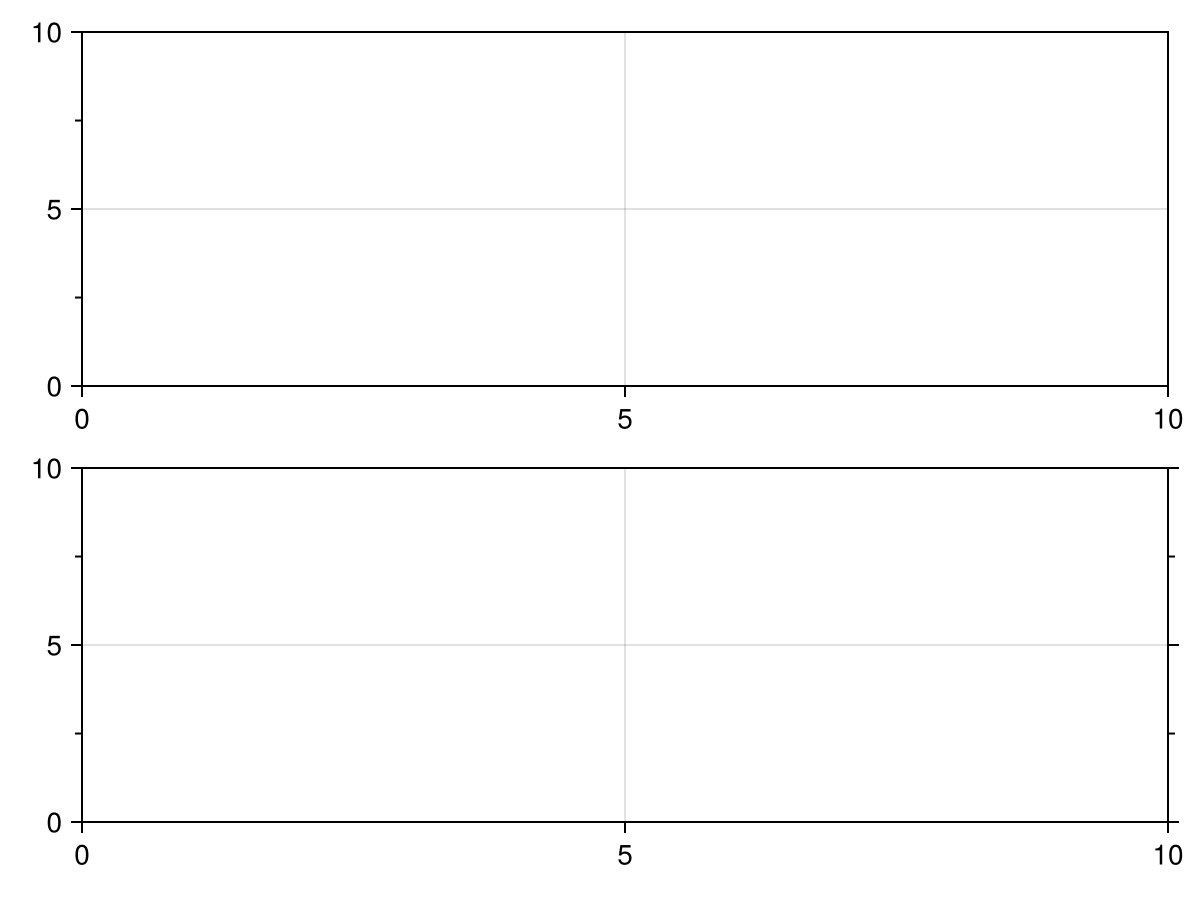
yticksvisible
Defaults to true
Controls if the ytick marks are visible.
ytickwidth
Defaults to 1.0
The width of the ytick marks.
ytrimspine
Defaults to false
If true, limits the y axis spine's extent to the outermost major tick marks. Can also be set to a Tuple{Bool,Bool} to control each side separately.
using CairoMakie
f = Figure()

ax1 = Axis(f[1, 1], ytrimspine = false)
ax2 = Axis(f[1, 2], ytrimspine = true)
ax3 = Axis(f[1, 3], ytrimspine = (true, false))
ax4 = Axis(f[1, 4], ytrimspine = (false, true))

for ax in [ax1, ax2, ax3, ax4]
    ax.xgridvisible = false
    ax.ygridvisible = false
    ax.rightspinevisible = false
    ax.topspinevisible = false
    ylims!(ax, 0.5, 5.5)
end

f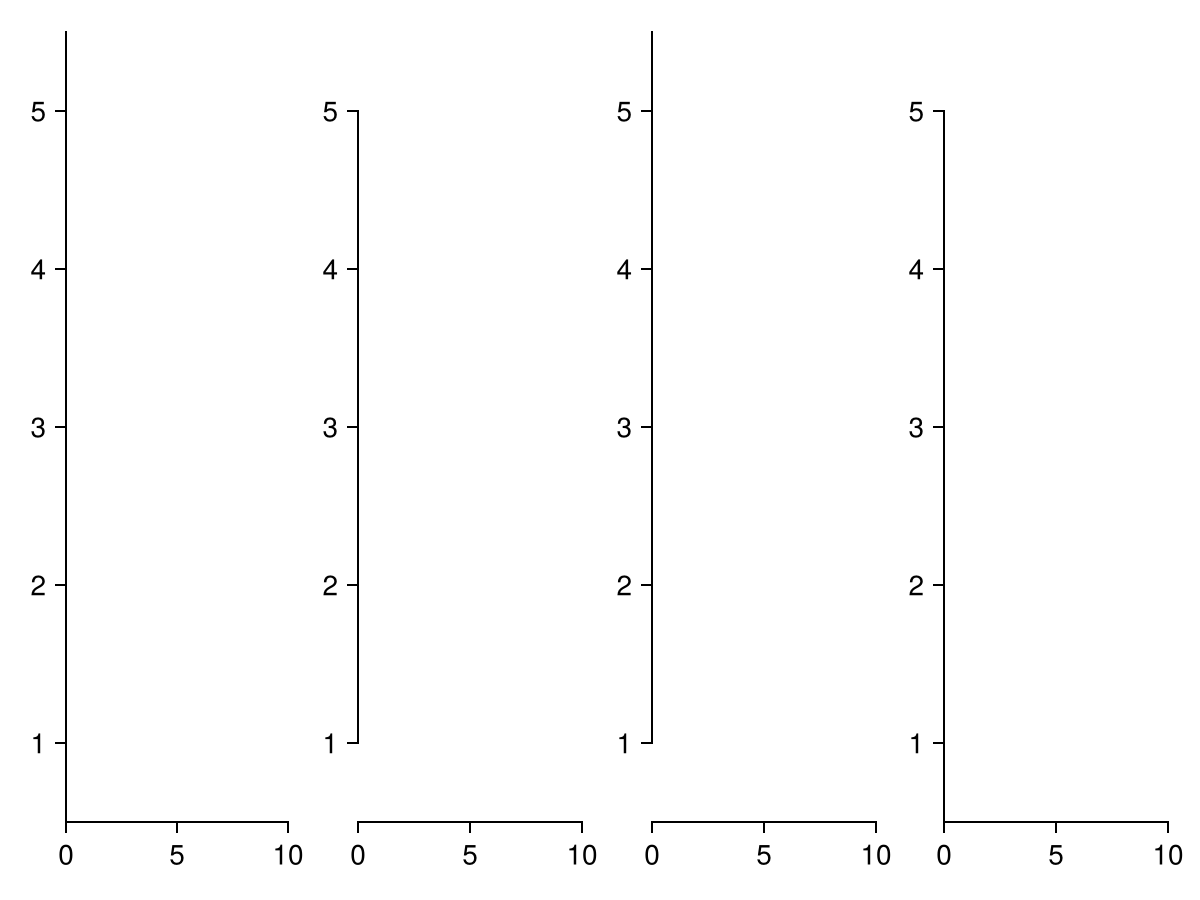
yzoomkey
Defaults to Makie.Keyboard.y
The key for limiting zooming to the y direction.
yzoomlock
Defaults to false
Locks interactive zooming in the y direction.
zoombutton
Defaults to true
Button that needs to be pressed to allow scroll zooming.