heatmap
heatmap(x, y, values)
heatmap(values)
Plots a heatmap as an image on x, y (defaults to interpretation as dimensions).
Attributes
Specific to Heatmap
interpolate::Bool = falsesets whether colors should be interpolated.
Color attributes
colormap::Union{Symbol, Vector{<:Colorant}} = :viridissets the colormap that is sampled for numericcolors.PlotUtils.cgrad(...),Makie.Reverse(any_colormap)can be used as well, or any symbol from ColorBrewer or PlotUtils. To see all available color gradients, you can callMakie.available_gradients().colorscale::Function = identitycolor transform function. Can be any function, but only works well together withColorbarforidentity,log,log2,log10,sqrt,logit,Makie.pseudolog10andMakie.Symlog10.colorrange::Tuple{<:Real, <:Real}sets the values representing the start and end points ofcolormap.nan_color::Union{Symbol, <:Colorant} = RGBAf(0,0,0,0)sets a replacement color forcolor = NaN.lowclip::Union{Nothing, Symbol, <:Colorant} = nothingsets a color for any value below the colorrange.highclip::Union{Nothing, Symbol, <:Colorant} = nothingsets a color for any value above the colorrange.alpha = 1.0sets the alpha value of the colormap or color attribute. Multiple alphas like inplot(alpha=0.2, color=(:red, 0.5), will get multiplied.
Generic attributes
visible::Bool = truesets whether the plot will be rendered or not.overdraw::Bool = falsesets whether the plot will draw over other plots. This specifically means ignoring depth checks in GL backends.transparency::Bool = falseadjusts how the plot deals with transparency. In GLMakietransparency = trueresults in using Order Independent Transparency.fxaa::Bool = trueadjusts whether the plot is rendered with fxaa (anti-aliasing).inspectable::Bool = truesets whether this plot should be seen byDataInspector.depth_shift::Float32 = 0f0adjusts the depth value of a plot after all other transformations, i.e. in clip space, where0 <= depth <= 1. This only applies to GLMakie and WGLMakie and can be used to adjust render order (like a tunable overdraw).model::Makie.Mat4fsets a model matrix for the plot. This replaces adjustments made withtranslate!,rotate!andscale!.space::Symbol = :datasets the transformation space for box encompassing the volume plot. SeeMakie.spaces()for possible inputs.
Examples
Two vectors and a matrix
using CairoMakie


xs = range(0, 10, length = 25)
ys = range(0, 15, length = 25)
zs = [cos(x) * sin(y) for x in xs, y in ys]

heatmap(xs, ys, zs)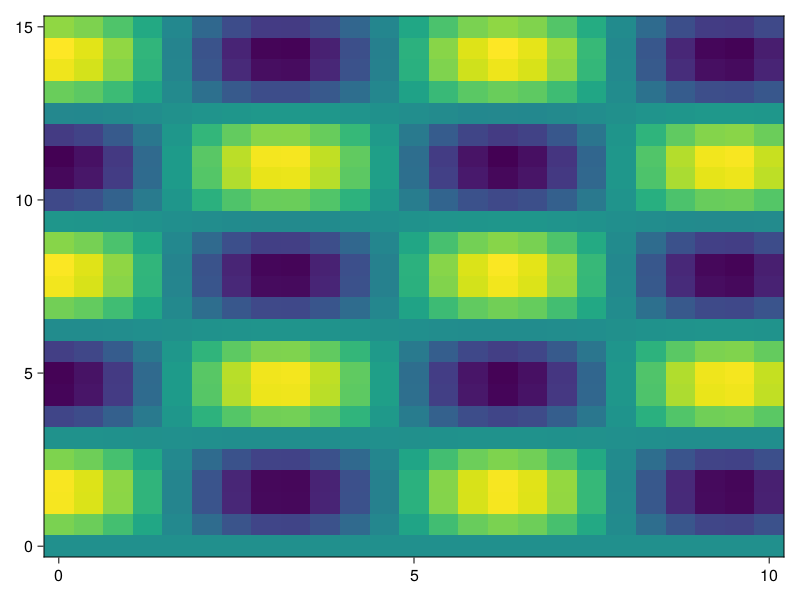
Two ranges and a function
using CairoMakie


function mandelbrot(x, y)
    z = c = x + y*im
    for i in 1:30.0; abs(z) > 2 && return i; z = z^2 + c; end; 0
end

heatmap(-2:0.001:1, -1.1:0.001:1.1, mandelbrot,
    colormap = Reverse(:deep))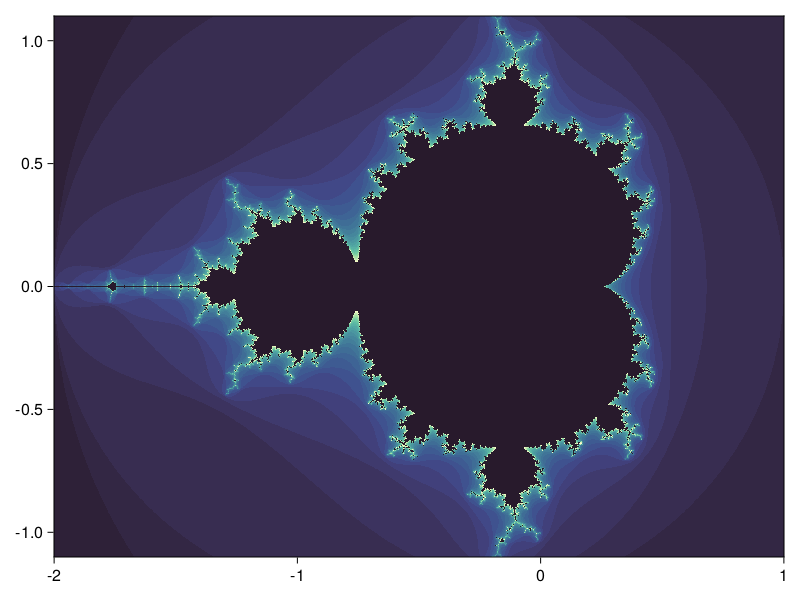
Three vectors
There must be no duplicate combinations of x and y, but it is allowed to leave out values.
using CairoMakie


xs = [1, 2, 3, 1, 2, 3, 1, 2, 3]
ys = [1, 1, 1, 2, 2, 2, 3, 3, 3]
zs = [1, 2, 3, 4, 5, 6, 7, 8, NaN]

heatmap(xs, ys, zs)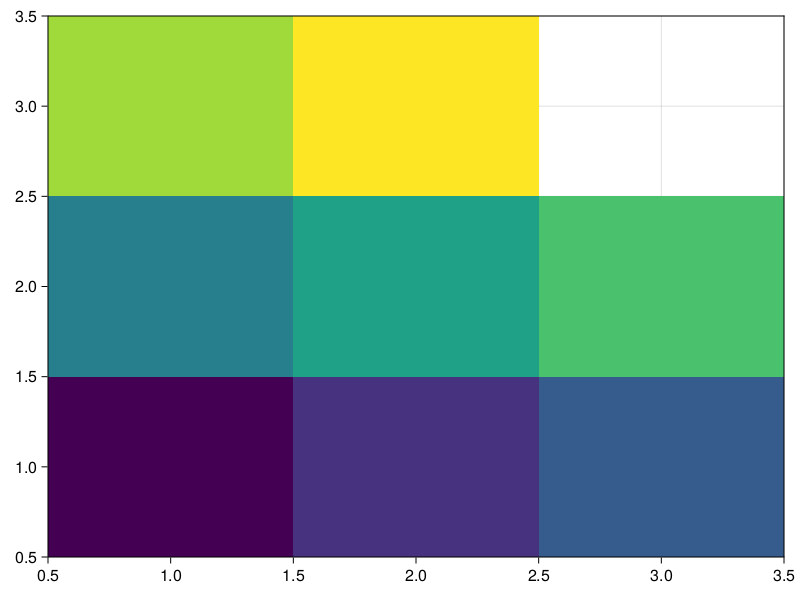
Colorbar for single heatmap
To get a scale for what the colors represent, add a colorbar. The colorbar is placed within the figure in the first argument, and the scale and colormap can be conveniently set by passing the relevant heatmap to it.
using CairoMakie


xs = range(0, 2π, length=100)
ys = range(0, 2π, length=100)
zs = [sin(x*y) for x in xs, y in ys]

fig, ax, hm = heatmap(xs, ys, zs)
Colorbar(fig[:, end+1], hm)

fig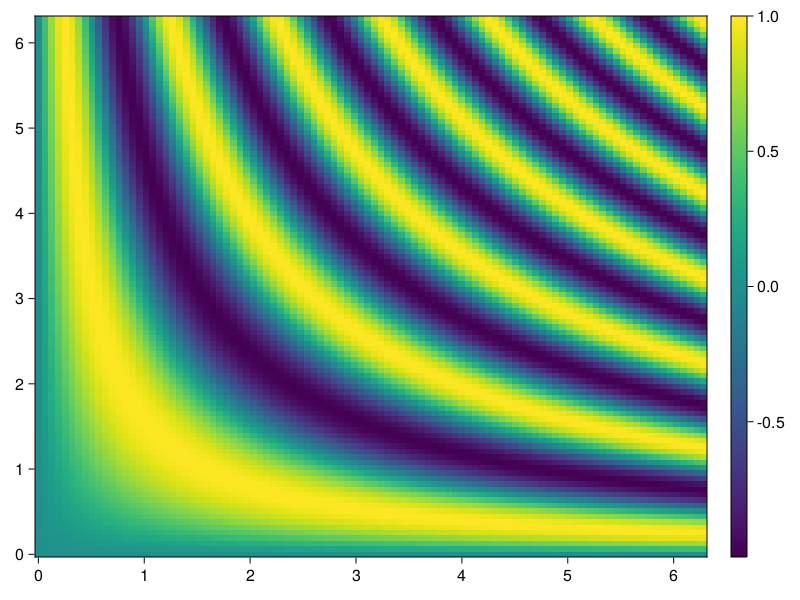
Colorbar for multiple heatmaps
When there are several heatmaps in a single figure, it can be useful to have a single colorbar represent all of them. It is important to then have synchronized scales and colormaps for the heatmaps and colorbar. This is done by setting the colorrange explicitly, so that it is independent of the data shown by that particular heatmap.
Since the heatmaps in the example below have the same colorrange and colormap, any of them can be passed to Colorbar to give the colorbar the same attributes. Alternativly, the colorbar attributes can be set explicitly.
using CairoMakie


xs = range(0, 2π, length=100)
ys = range(0, 2π, length=100)
zs1 = [sin(x*y) for x in xs, y in ys]
zs2 = [2sin(x*y) for x in xs, y in ys]

joint_limits = (-2, 2)  # here we pick the limits manually for simplicity instead of computing them

fig, ax1, hm1 = heatmap(xs, ys, zs1,  colorrange = joint_limits)
ax2, hm2 = heatmap(fig[1, end+1], xs, ys, zs2, colorrange = joint_limits)

Colorbar(fig[:, end+1], hm1)                     # These three
Colorbar(fig[:, end+1], hm2)                     # colorbars are
Colorbar(fig[:, end+1], colorrange = joint_limits)  # equivalent

fig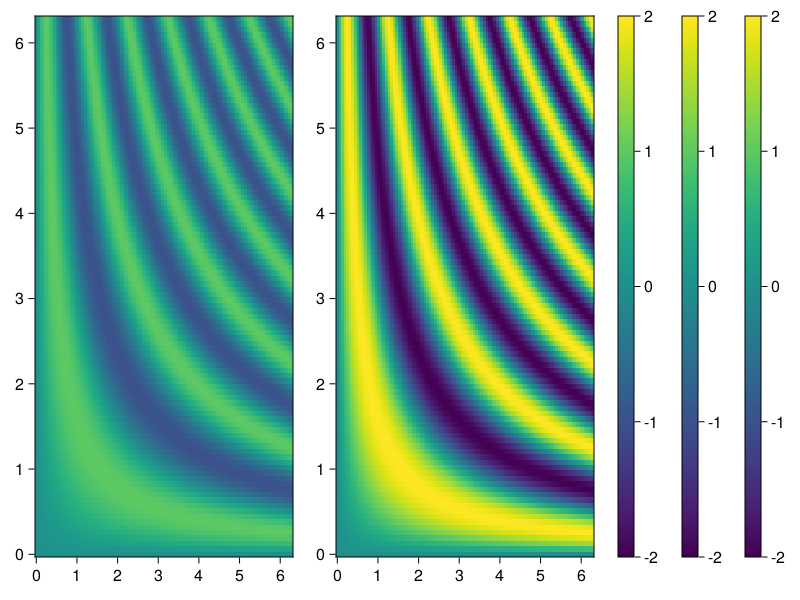
Using a custom colorscale
One can define a custom (color)scale using the ReversibleScale type. When the transformation is simple enough (log, sqrt, ...), the inverse transform is automatically deduced.
using CairoMakie

x = 10.0.^(1:0.1:4)
y = 1.0:0.1:5.0
z = broadcast((x, y) -> x - 10, x, y')

scale = ReversibleScale(x -> asinh(x / 2) / log(10), x -> 2sinh(log(10) * x))
fig, ax, hm = heatmap(x, y, z; colorscale = scale, axis = (; xscale = scale))
Colorbar(fig[1, 2], hm)

fig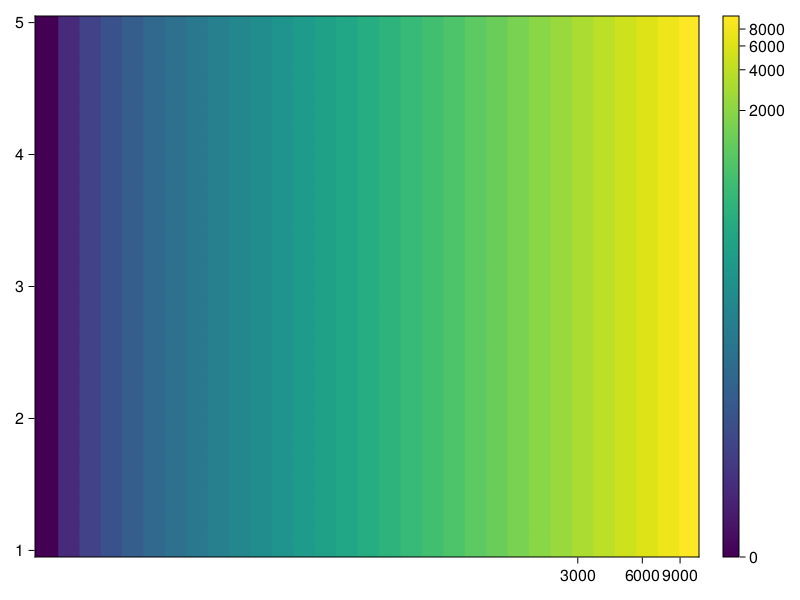
These docs were autogenerated using Makie: v0.19.12, GLMakie: v0.8.12, CairoMakie: v0.10.12, WGLMakie: v0.8.16
