Figures
The
Figure
object contains a top-level
Scene
and a
GridLayout
, as well as a list of blocks that have been placed into it, like
Axis
,
Colorbar
,
Slider
,
Legend
, etc.
Creating a
Figure
You can create a figure explicitly with the
Figure()
function, and set attributes of the underlying scene. The most important one of which is the
resolution
.
f = Figure()
f = Figure(resolution = (600, 400))
A figure is also created implicitly when you use simple, non-mutating plotting commands like
plot()
,
scatter()
,
lines()
, etc. Because these commands also create an axis for the plot to live in and the plot itself, they return a compound object
FigureAxisPlot
, which just stores these three parts. To access the figure you can either destructure that object into its three parts or access the figure field directly.
figureaxisplot = scatter(rand(100, 2))
figure = figureaxisplot.figure

# destructuring syntax
figure, axis, plot = scatter(rand(100, 2))

# you can also ignore components
figure, = scatter(rand(100, 2))
You can pass arguments to the created figure in a dict-like object to the special
figure
keyword:
scatter(rand(100, 2), figure = (resolution = (600, 400),))
Placing blocks into a
Figure
All blocks take their parent figure as the first argument, then you can place them in the figure layout via indexing syntax.
f = Figure()
ax = f[1, 1] = Axis(f)
sl = f[2, 1] = Slider(f)
GridPositions and GridSubpositions
The indexing syntax of
Figure
is implemented to work seamlessly with layouting. If you index into the figure, a
GridPosition
object that stores this indexing operation is created. This object can be used to plot a new axis into a certain layout position in the figure, for example like this:
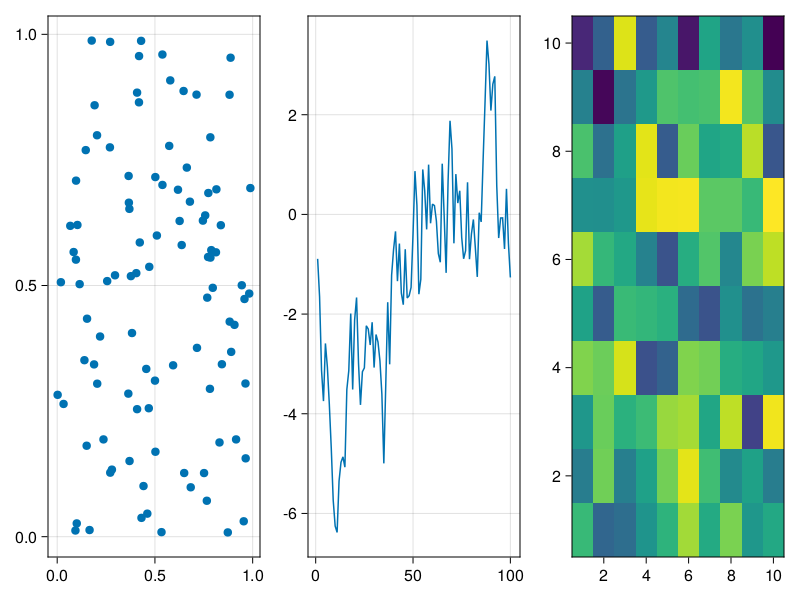
using CairoMakie

f = Figure()
pos = f[1, 1]
scatter(pos, rand(100, 2))

pos2 = f[1, 2]
lines(pos2, cumsum(randn(100)))

# you don't have to store the position in a variable first, of course
heatmap(f[1, 3], randn(10, 10))

f
You can also index further into a
GridPosition
, which creates a
GridSubposition
. With
GridSubposition
s you can describe positions in arbitrarily nested grid layouts. Often, a desired plot layout can only be achieved with nesting, and repeatedly indexing makes this easy.
using CairoMakie

f = Figure()

f[1, 1] = Axis(f, title = "I'm not nested")
f[1, 2][1, 1] = Axis(f, title = "I'm nested")

# plotting into nested positions also works
heatmap(f[1, 2][2, 1], randn(20, 20))

f

All nested GridLayouts that don't exist yet, but are needed for a nested plotting call, are created in the background automatically.
Note
The
GridLayout
s that are implicitly created when using
GridSubpositions
are not directly available in the return value for further manipulation. You can instead retrieve them after the fact with the
content
function, for example, as explained in the following section.
Figure padding
You can change the amount of whitespace around the figure content with the keyword
figure_padding
. This takes either a number for all four sides, or a tuple of four numbers for left, right, bottom, top. You can also theme this setting with
set_theme!(figure_padding = 30)
, for example.
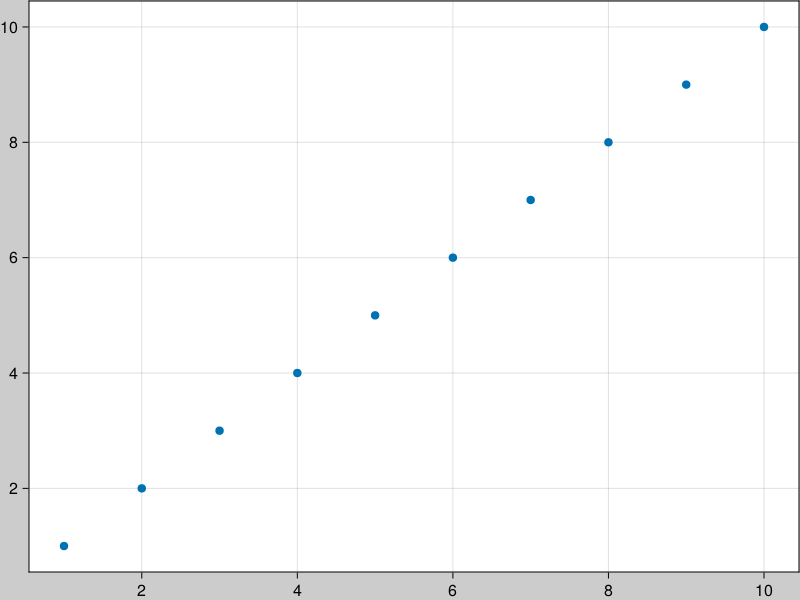
using CairoMakie

f = Figure(figure_padding = 1, backgroundcolor = :gray80)

Axis(f[1, 1])
scatter!(1:10)

f
Retrieving Objects From A Figure
Sometimes users are surprised that indexing into a figure does not retrieve the object placed at that position. This is because the
GridPosition
is needed for plotting, and returning content objects directly would take away that possibility. Furthermore, a
GridLayout
can hold multiple objects at the same position, or have partially overlapping content, so it's not well-defined what should be returned given a certain index.
To retrieve objects from a Figure you can instead use indexing plus the
contents
or
content
functions. The
contents
function returns a Vector of all objects found at the given
GridPosition
. You can use the
exact = true
keyword argument so that the position has to match exactly, otherwise objects contained in that position are also returned.
f = Figure()
box = f[1:3, 1:2] = Box(f)
ax = f[1, 1] = Axis(f)

contents(f[1, 1]) == [ax]
contents(f[1:3, 1:2]) == [box, ax]
contents(f[1:3, 1:2], exact = true) == [box]
If you use
contents
on a
GridSubposition
, the
exact
keyword only refers to the lowest-level grid layout, all upper levels have to match exactly.
f = Figure()
ax = f[1, 1][2, 3] = Axis(f)

contents(f[1, 1][2, 3]) == [ax]
contents(f[1:2, 1:2][2, 3]) == [] # the upper level has to match exactly
Often, you will expect only one object at a certain position and you want to work directly with it, without retrieving it from the Vector returned by
contents
. In that case, use the
content
function instead. It works equivalently to
only(contents(pos, exact = true))
, so it errors if it can't return exactly one object from an exact given position.
f = Figure()
ax = f[1, 1] = Axis(f)

contents(f[1, 1]) == [ax]
content(f[1, 1]) == ax These docs were autogenerated using Makie: v0.18.4, GLMakie: v0.7.4, CairoMakie: v0.9.4, WGLMakie: v0.7.4